Cited by 26

The DOI matches its Crossref record; 5 of the 5 references it cites were found in a registry or an index.

DRAM1 increases the secretion of PKM2-enriched EVs from hepatocytes to promote macrophage activation and disease progression in ALD

Tan, Jie, Zhang, Jie, Wang, Mengke, Wang, Yifen, Dong, Mengzhen, Ma, Xuefeng, Sun, Baokai, Liu, Shousheng, Zhao, Zhenzhen, Chen, Lizhen, Jin, Wenwen, Liu, Kai, Xin, Yongning, Zhuang, Likun·2022·Molecular Therapy Nucleic Acids

Overview

The claims and statistics of this paper haven’t been checked yet.

Run the check — free, no account needed. It reads the open-access text and checks the sources it cites.

A few free checks a day · papers already verified open instantly · results are public

Integrity signals

Registry

Crossref · 10.1016/j.omtn.2021.12.017

Cites

5 of 5 references verified0 citation errors · 0 not checkable

Statistics

Figures

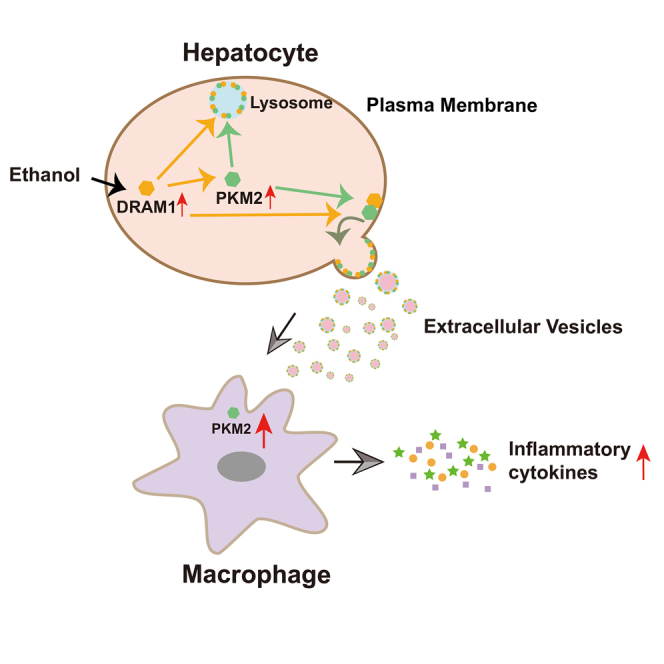
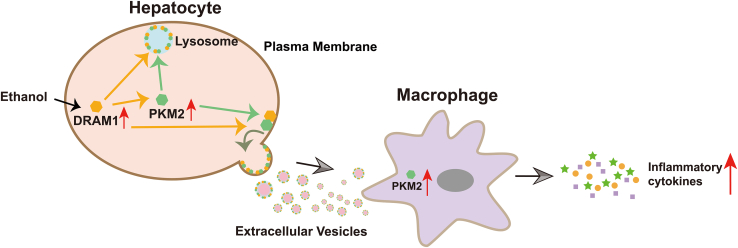
Graphical abstract
Graphical abstract CC BY-NC-ND · PubMed Central
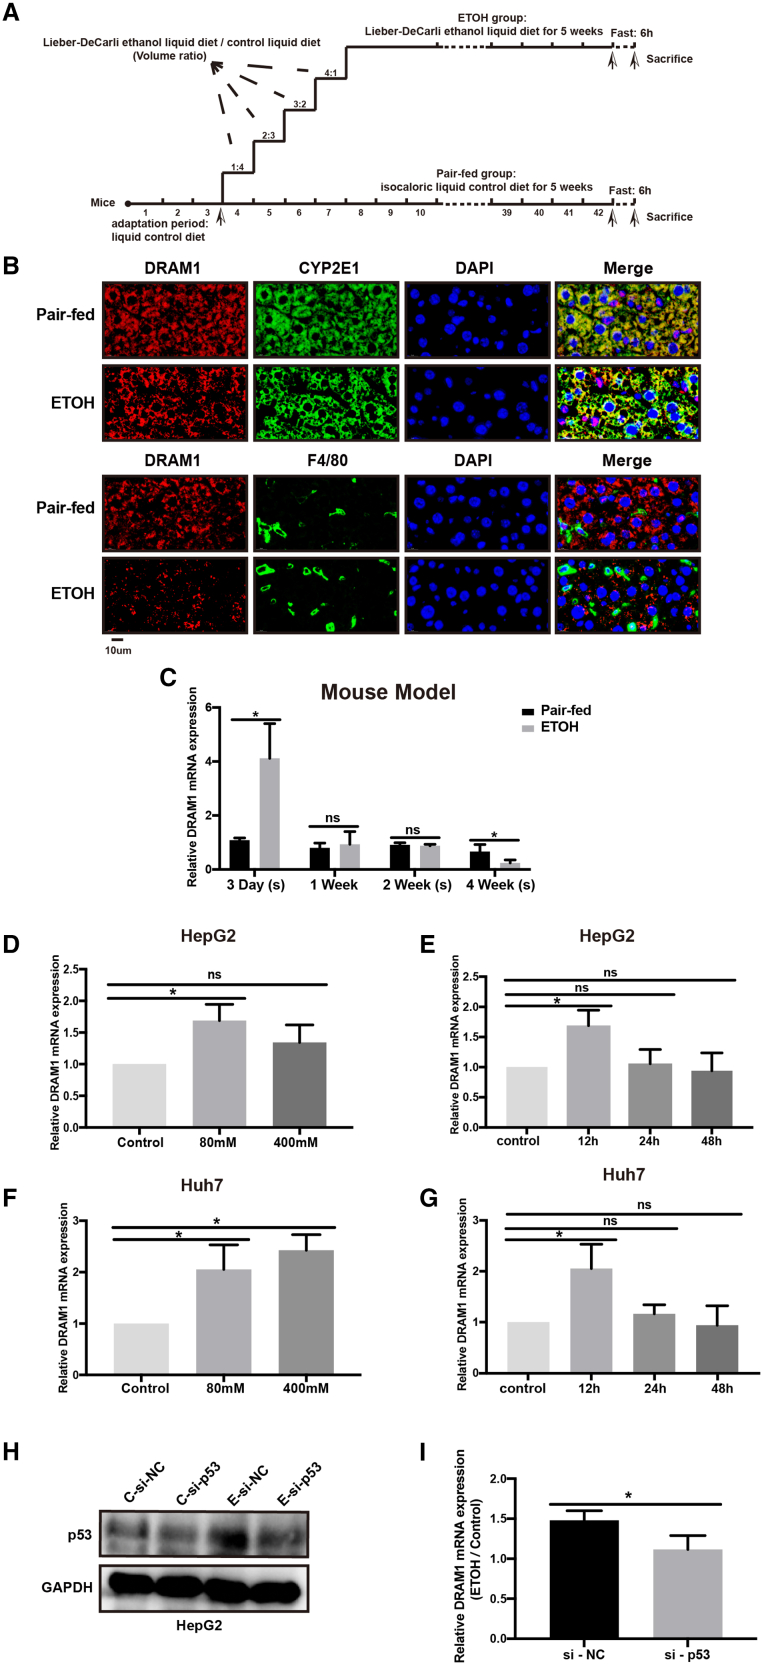
Figure 1 DRAM1 expressions in liver tissues of mice and hepatic cells with ethanol treatment (A) Schematic diagram for the construction of mouse model of ALD. (B) Immunofluorescence assays of liver tissues in pair-fed and ethanol-fed mice were used to measure the expressions of DRAM1, CYP2E1, and F4/80 (Scale bars: 10μm). (C) Mice were fed with ethanol diet or control diet for 3 days, 1 week, 2 weeks, and 4 weeks, respectively. The expression levels of DRAM1 in liver tissues of mice were measured by qRT-PCR (n = 3–4). (D–G) HepG2 cells (D) and Huh7 cells (F) were treated with 80 mM or 400 mM ethanol for 12 h, and the levels of DRAM1 were measured by qRT-PCR. The levels of DRAM1 in HepG2 (E) and Huh7 cells (G) were measured by qRT-PCR after being treated with 80 mM ethanol for 12 h, 24 h, or 48 h. (H) Levels of p53 protein were detected by western blot in ethanol-treated HepG2 cells transfected with p53 siRNAs. (I) qRT-PCR was used to detect the mRNA level of DRAM1, and the ratio between the values of the ETOH-treated group and the control group was calculated. ∗p < 0.05; ns, no significance.
Figure 1 DRAM1 expressions in liver tissues of mice and hepatic cells with ethanol treatment (A) Schematic diagram for the construction of mouse model of ALD. (B) Immunofluorescence assays of liver tissues in pair-fed and ethanol-fed mice were used to measure the expressions of DRAM1, CYP2E1, and F4/80 (Scale bars: 10μm). (C) Mice were fed with ethanol diet or control diet for 3 days, 1 week, 2 weeks, and 4 weeks, respectively. The expression levels of DRAM1 in liver tissues of mice were measured by qRT-PCR (n = 3–4). (D–G) HepG2 cells (D) and Huh7 cells (F) were treated with 80 mM or 400 mM ethanol for 12 h, and the levels of DRAM1 were measured by qRT-PCR. The levels of DRAM1 in HepG2 (E) and Huh7 cells (G) were measured by qRT-PCR after being treated with 80 mM ethanol for 12 h, 24 h, or 48 h. (H) Levels of p53 protein were detected by western blot in ethanol-treated HepG2 cells transfected with p53 siRNAs. (I) qRT-PCR was used to detect the mRNA level of DRAM1, and the ratio between the values of the ETOH-treated group and the control group was calculated. ∗p < 0.05; ns, no significance.CC BY-NC-ND · PubMed Central
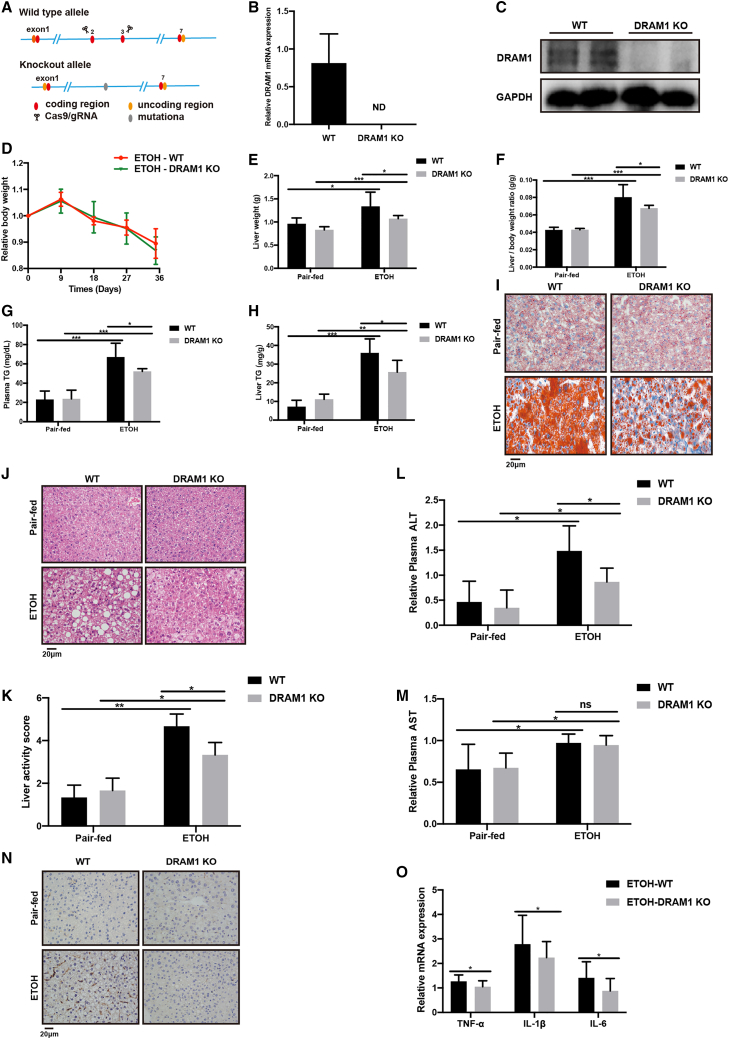
Figure 2 Ethanol-induced hepatic lipid accumulation, hepatic injury, and expressions of M1 macrophage markers in DRAM1-knockout mice (A) CRISPR/cas9 technology was used to knockout the DRAM1 gene in mice. (B and C) DRAM1 levels in liver tissues of DRAM1-KO mice were measured by qRT-PCR (B) and western blot (C). (D–O) WT and DRAM1-KO mice (n = 4–6) were fed with ethanol diet or control diet for five weeks. Body weight (D), liver weight (E), liver-to-body weight ratio (F), plasma TG levels (G), liver tissue TG levels (H), oil red O staining (I), H&E staining (J), liver activity score (K), plasma ALT levels (L), plasma AST levels (M), immunohistochemistry staining for F4/80 (N), and the mRNA levels of TNF-α, IL-1β, and IL-6 in liver tissues (O) were measured. Images were captured for oil red O staining, H&E staining, and F4/80 immunohistochemistry staining at 400× magnification (Scale bars: 20μm). ∗p < 0.05; ∗∗p < 0.01; ∗∗∗p < 0.001; ns, no significance; ND, no detection.
Figure 2 Ethanol-induced hepatic lipid accumulation, hepatic injury, and expressions of M1 macrophage markers in DRAM1-knockout mice (A) CRISPR/cas9 technology was used to knockout the DRAM1 gene in mice. (B and C) DRAM1 levels in liver tissues of DRAM1-KO mice were measured by qRT-PCR (B) and western blot (C). (D–O) WT and DRAM1-KO mice (n = 4–6) were fed with ethanol diet or control diet for five weeks. Body weight (D), liver weight (E), liver-to-body weight ratio (F), plasma TG levels (G), liver tissue TG levels (H), oil red O staining (I), H&E staining (J), liver activity score (K), plasma ALT levels (L), plasma AST levels (M), immunohistochemistry staining for F4/80 (N), and the mRNA levels of TNF-α, IL-1β, and IL-6 in liver tissues (O) were measured. Images were captured for oil red O staining, H&E staining, and F4/80 immunohistochemistry staining at 400× magnification (Scale bars: 20μm). ∗p < 0.05; ∗∗p < 0.01; ∗∗∗p < 0.001; ns, no significance; ND, no detection.CC BY-NC-ND · PubMed Central
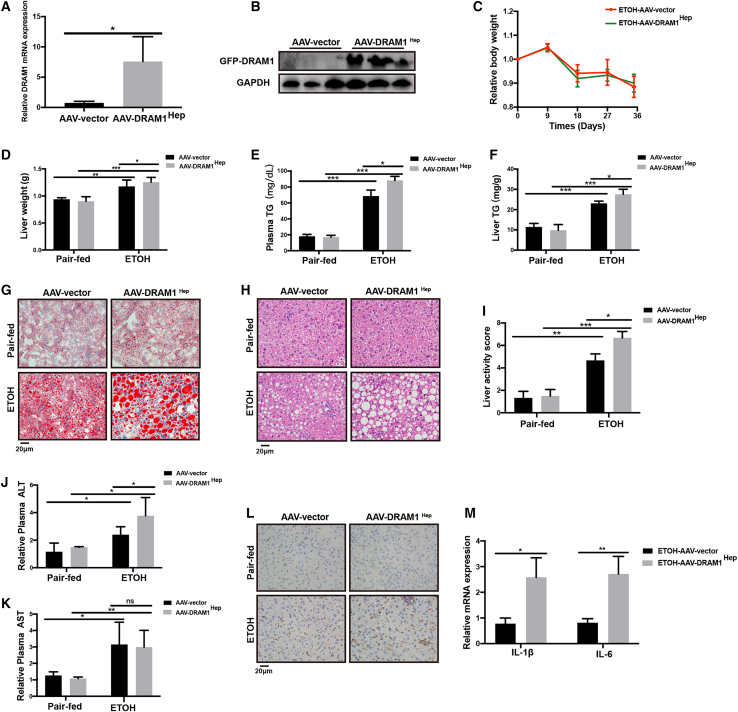
Figure 3 Ethanol-induced hepatic lipid accumulation, hepatic injury, and expressions of M1 macrophage markers in mice with liver-specific overexpression of DRAM1 (A) DRAM1 levels of liver tissues in AAV-vector and AAV-DRAM1Hep mice were measured by qRT-PCR. (B) Western blot assay for GFP tag in liver tissues of AAV-vector and AAV-DRAM1Hep mice. (C–M) AAV-vector and AAV-DRAM1Hep mice (n = 3–5) were fed with ethanol diet or control diet for 5 weeks. Body weight (C), liver weight (D), plasma TG levels (E), TG levels of liver tissues (F), oil red O staining (G), H&E staining (H), liver activity score (I), plasma ALT levels (J), plasma AST levels (K), immunohistochemistry staining for F4/80 (L), and the mRNA levels of IL-1β and IL-6 in liver tissues (M) were measured. Images were captured for oil red O staining, H&E staining, and F4/80 immunohistochemistry staining at 400× magnification (Scale bars: 20μm). ∗p < 0.05; ∗∗p < 0.01; ∗∗∗p < 0.001; ns, no significance.
Figure 3 Ethanol-induced hepatic lipid accumulation, hepatic injury, and expressions of M1 macrophage markers in mice with liver-specific overexpression of DRAM1 (A) DRAM1 levels of liver tissues in AAV-vector and AAV-DRAM1Hep mice were measured by qRT-PCR. (B) Western blot assay for GFP tag in liver tissues of AAV-vector and AAV-DRAM1Hep mice. (C–M) AAV-vector and AAV-DRAM1Hep mice (n = 3–5) were fed with ethanol diet or control diet for 5 weeks. Body weight (C), liver weight (D), plasma TG levels (E), TG levels of liver tissues (F), oil red O staining (G), H&E staining (H), liver activity score (I), plasma ALT levels (J), plasma AST levels (K), immunohistochemistry staining for F4/80 (L), and the mRNA levels of IL-1β and IL-6 in liver tissues (M) were measured. Images were captured for oil red O staining, H&E staining, and F4/80 immunohistochemistry staining at 400× magnification (Scale bars: 20μm). ∗p < 0.05; ∗∗p < 0.01; ∗∗∗p < 0.001; ns, no significance.CC BY-NC-ND · PubMed Central
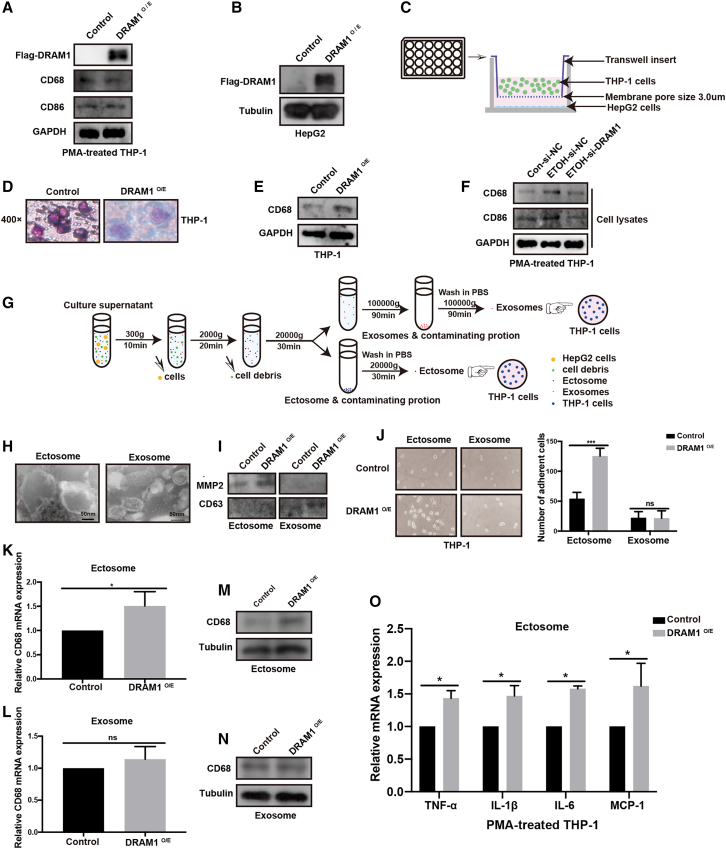
Figure 4 Ectosomes from hepatic cells overexpressing DRAM1 regulated the differentiation and activation of macrophages (A) Flag-DRAM1 was overexpressed in PMA-treated THP-1 cells, and the protein levels of CD68 and CD86 were detected by western blot. (B) HepG2 cells were transfected with the Flag-DRAM1 expression plasmids, and the level of Flag-DRAM1 was detected by western blot. (C) HepG2 cells in the lower plate were transfected with Flag-DRAM1 expression plasmids, and the THP-1 cells were placed in the upper chamber. The two cells were co-cultured in a transwell chamber. (D–E) The morphological images (D) and CD68 protein level (E) of co-cultured THP-1 cells were detected. (F) The culture supernatant of HepG2 cells transfected with the corresponding siRNAs were incubated with PMA-incubated THP-1 cells. The protein levels of CD68 and CD86 in PMA-treated THP-1 cells were detected by western blot. (G) Ultracentrifugation was used to isolate the ectosomes and exosomes in the culture supernatant of HepG2 cells transfected with Flag-DRAM1 expression plasmids or empty vector. (H) The typical pictures of ectosomes and exosomes were respectively visualized under the transmission electron microscope. (I) The ectosome marker MMP2 and the exosome marker CD63 were detected by western blot. (J–N) Ectosomes or exosomes extracted from the culture supernatants of HepG2 cells transfected with Flag-DRAM1 expression plasmids or empty vector were respectively added into the culture medium of THP-1 cells. The adhesion of THP-1 cells was observed and counted in each group (J). The mRNA and protein levels of CD68 in THP-1 cells incubated with ectosomes or exosomes (K–N). (O) Ectosomes extracted from the culture supernatants of HepG2 cells transfected with Flag-DRAM1 expression plasmids or empty vector were incubated with PMA-treated THP-1 cells. The mRNA levels of M1 macrophage markers, including TNF-α, IL-1β, IL-6, and MCP-1, were detected by qRT-PCR. ∗p < 0.05; ∗∗∗p < 0.001; ns, no significance.
Figure 4 Ectosomes from hepatic cells overexpressing DRAM1 regulated the differentiation and activation of macrophages (A) Flag-DRAM1 was overexpressed in PMA-treated THP-1 cells, and the protein levels of CD68 and CD86 were detected by western blot. (B) HepG2 cells were transfected with the Flag-DRAM1 expression plasmids, and the level of Flag-DRAM1 was detected by western blot. (C) HepG2 cells in the lower plate were transfected with Flag-DRAM1 expression plasmids, and the THP-1 cells were placed in the upper chamber. The two cells were co-cultured in a transwell chamber. (D–E) The morphological images (D) and CD68 protein level (E) of co-cultured THP-1 cells were detected. (F) The culture supernatant of HepG2 cells transfected with the corresponding siRNAs were incubated with PMA-incubated THP-1 cells. The protein levels of CD68 and CD86 in PMA-treated THP-1 cells were detected by western blot. (G) Ultracentrifugation was used to isolate the ectosomes and exosomes in the culture supernatant of HepG2 cells transfected with Flag-DRAM1 expression plasmids or empty vector. (H) The typical pictures of ectosomes and exosomes were respectively visualized under the transmission electron microscope. (I) The ectosome marker MMP2 and the exosome marker CD63 were detected by western blot. (J–N) Ectosomes or exosomes extracted from the culture supernatants of HepG2 cells transfected with Flag-DRAM1 expression plasmids or empty vector were respectively added into the culture medium of THP-1 cells. The adhesion of THP-1 cells was observed and counted in each group (J). The mRNA and protein levels of CD68 in THP-1 cells incubated with ectosomes or exosomes (K–N). (O) Ectosomes extracted from the culture supernatants of HepG2 cells transfected with Flag-DRAM1 expression plasmids or empty vector were incubated with PMA-treated THP-1 cells. The mRNA levels of M1 macrophage markers, including TNF-α, IL-1β, IL-6, and MCP-1, were detected by qRT-PCR. ∗p < 0.05; ∗∗∗p < 0.001; ns, no significance.CC BY-NC-ND · PubMed Central
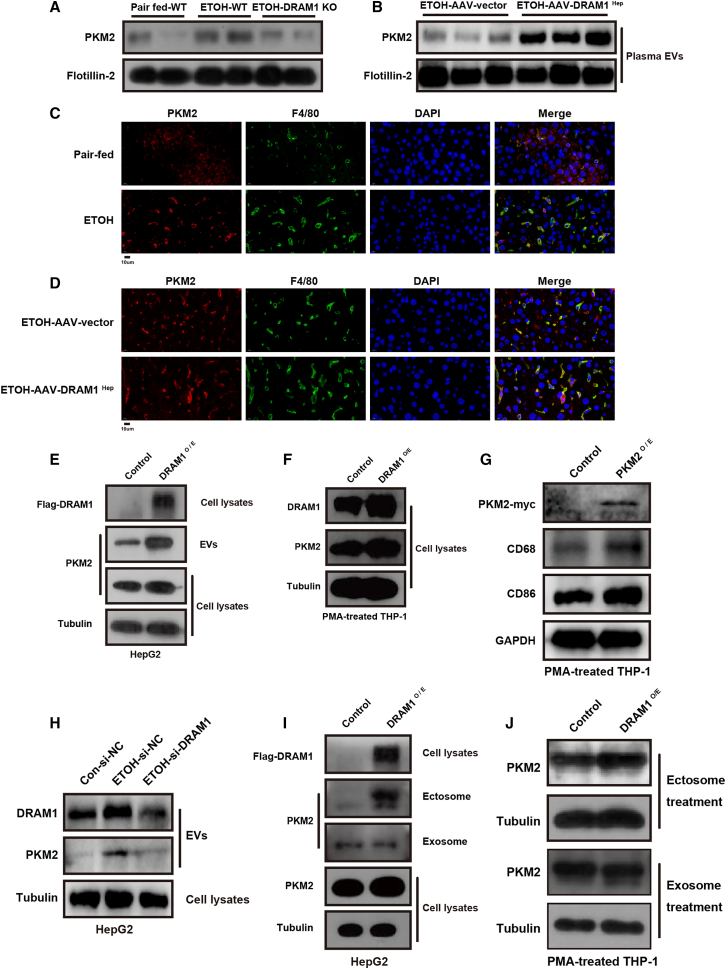
Figure 5 DRAM1 regulated PKM2 level in extracellular vesicles released from hepatic cells (A) EVs were extracted from the plasma of WT or DRAM1-KO mice fed with control or ethanol diet. Protein level of PKM2 in EVs were detected by western blot. (B) EVs were extracted from the plasma of AAV-vector and AAV-DRAM1Hep mice fed with ethanol. Protein level of PKM2 in EVs was detected by western blot. (C) Immunofluorescence assays of liver tissues in control and ethanol-fed mice were used to measure the expressions of PKM2 and F4/80 (Scale bars: 10μm). (D) Immunofluorescence assays of liver tissues in AAV-vector and AAV-DRAM1Hep mice fed with ethanol were used to measure the expressions of PKM2 and F4/80 (Scale bars: 10μm). (E) Protein levels of PKM2 in EVs and cell lysates of hepG2 cells with DRAM1 overexpression were detected by western blot. (F) The culture supernatant of HepG2 cells transfected with the Flag-DRAM1 expression plasmids were incubated with PMA-incubated THP-1 cells. The expressions of both DRAM1 and PKM2 in PMA-treated THP-1 cells were detected by western blot. (G) PKM2-myc plasmids were transfected into PMA-treated THP-1 cells, and the protein levels of CD68 and CD86 were detected by western blot. (H) Ethanol-treated HepG2 cells were transfected with DRAM1 siRNAs and the EVs were isolated. The protein levels of DRAM1 and PKM2 in EVs were detected by western blot. (I–J) By ultracentrifugation, ectosomes and exosomes were extracted from the culture supernatants of HepG2 cells transfected with Flag-DRAM1 expression plasmids or empty vector and were added into the culture medium of PMA-treated THP-1 cells. Protein level of PKM2 in ectosomes, exosomes, and cell lysates of HepG2 cells were detected by western blot (I). PKM2 levels in PMA-treated THP-1 cells incubated with the corresponding ectosomes or exosomes were detected by western blot (J).
Figure 5 DRAM1 regulated PKM2 level in extracellular vesicles released from hepatic cells (A) EVs were extracted from the plasma of WT or DRAM1-KO mice fed with control or ethanol diet. Protein level of PKM2 in EVs were detected by western blot. (B) EVs were extracted from the plasma of AAV-vector and AAV-DRAM1Hep mice fed with ethanol. Protein level of PKM2 in EVs was detected by western blot. (C) Immunofluorescence assays of liver tissues in control and ethanol-fed mice were used to measure the expressions of PKM2 and F4/80 (Scale bars: 10μm). (D) Immunofluorescence assays of liver tissues in AAV-vector and AAV-DRAM1Hep mice fed with ethanol were used to measure the expressions of PKM2 and F4/80 (Scale bars: 10μm). (E) Protein levels of PKM2 in EVs and cell lysates of hepG2 cells with DRAM1 overexpression were detected by western blot. (F) The culture supernatant of HepG2 cells transfected with the Flag-DRAM1 expression plasmids were incubated with PMA-incubated THP-1 cells. The expressions of both DRAM1 and PKM2 in PMA-treated THP-1 cells were detected by western blot. (G) PKM2-myc plasmids were transfected into PMA-treated THP-1 cells, and the protein levels of CD68 and CD86 were detected by western blot. (H) Ethanol-treated HepG2 cells were transfected with DRAM1 siRNAs and the EVs were isolated. The protein levels of DRAM1 and PKM2 in EVs were detected by western blot. (I–J) By ultracentrifugation, ectosomes and exosomes were extracted from the culture supernatants of HepG2 cells transfected with Flag-DRAM1 expression plasmids or empty vector and were added into the culture medium of PMA-treated THP-1 cells. Protein level of PKM2 in ectosomes, exosomes, and cell lysates of HepG2 cells were detected by western blot (I). PKM2 levels in PMA-treated THP-1 cells incubated with the corresponding ectosomes or exosomes were detected by western blot (J).CC BY-NC-ND · PubMed Central
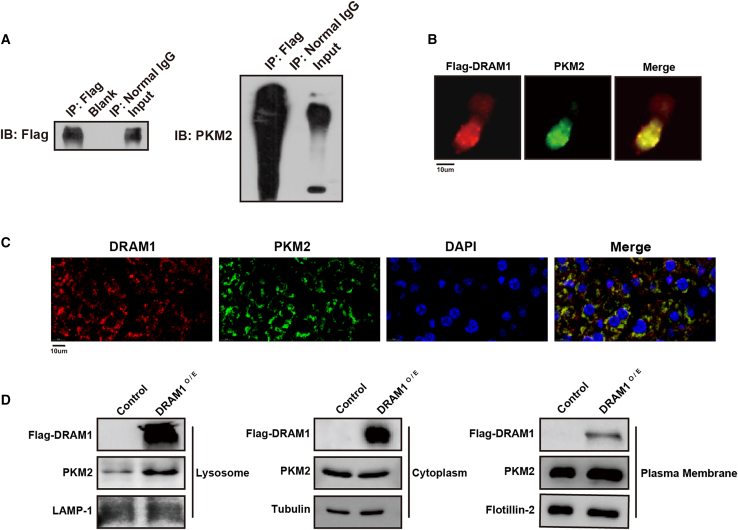
Figure 6 DRAM1 interacted with PKM2 and regulated its plasma membrane localization in hepatic cells (A) coIP assay was conducted in cell lysates from HepG2 cells transfected with Flag-DRAM1 and PKM2-myc expression plasmids using anti-Flag antibody. Levels of Flag-DRAM1 and PKM2 were measured by western blot. (B) Immunofluorescence for Flag-DRAM1 and PKM2 in HepG2 cells transfected with Flag-DRAM1 expression plasmids (Scale bars: 10μm). (C) Immunofluorescence assays of liver tissues in WT mice were used to measure the expressions of DRAM1 and PKM2 (Scale bars: 10μm). (D) Protein levels of Flag-DRAM1 and PKM2 were detected in plasma membrane, lysosomes, and cytoplasm of HepG2 cells transfected with Flag-DRAM1 expression plasmids.
Figure 6 DRAM1 interacted with PKM2 and regulated its plasma membrane localization in hepatic cells (A) coIP assay was conducted in cell lysates from HepG2 cells transfected with Flag-DRAM1 and PKM2-myc expression plasmids using anti-Flag antibody. Levels of Flag-DRAM1 and PKM2 were measured by western blot. (B) Immunofluorescence for Flag-DRAM1 and PKM2 in HepG2 cells transfected with Flag-DRAM1 expression plasmids (Scale bars: 10μm). (C) Immunofluorescence assays of liver tissues in WT mice were used to measure the expressions of DRAM1 and PKM2 (Scale bars: 10μm). (D) Protein levels of Flag-DRAM1 and PKM2 were detected in plasma membrane, lysosomes, and cytoplasm of HepG2 cells transfected with Flag-DRAM1 expression plasmids.CC BY-NC-ND · PubMed Central
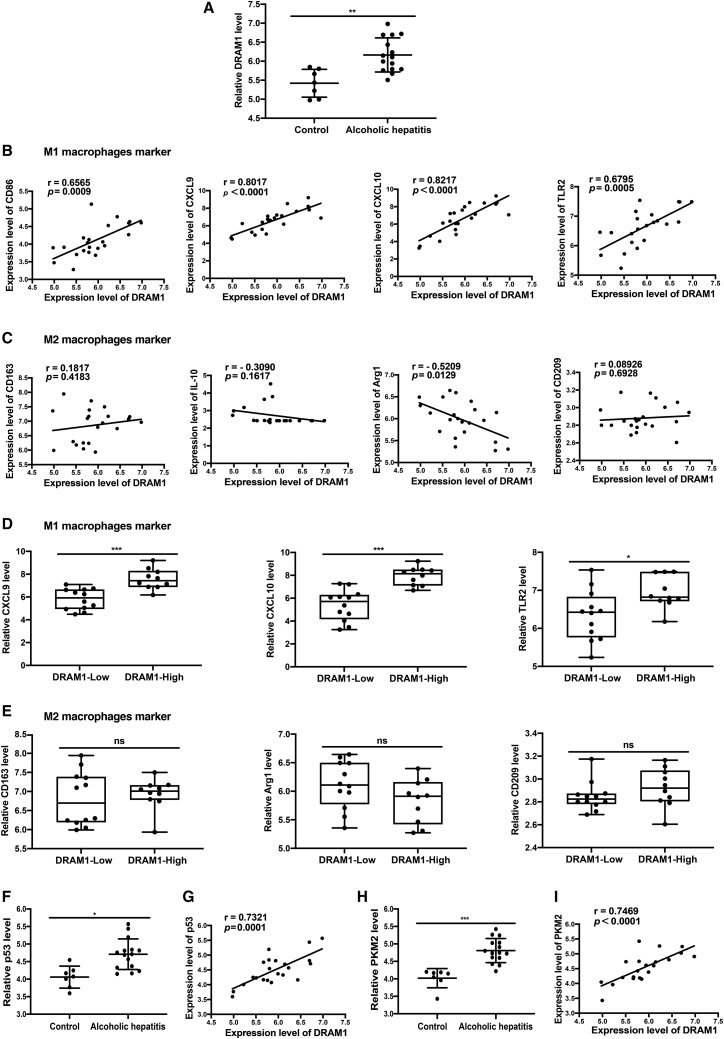
Figure 7 DRAM1 expression in liver tissues of AH patients Dataset (GEO database: GSE28619) of AH patients and normal controls were analyzed. (A) DRAM1 levels in liver tissues of AH patients and controls were analyzed. The adjusted p value was calculated. (B) Pearson correlation analysis was used to analyze the correlations between DRAM1 level and M1 macrophage markers including CD86, CXCL9, CXCL10, and TLR2. (C) Pearson correlation analysis was used to analyze the correlations between DRAM1 level and M2 macrophage markers including CD163, IL-10, Arg1, and CD209. (D) The expression levels of CXCL9, CXCL10, and TLR2 in the DRAM1-high expression group and DRAM1-low expression group. (E) The expression levels of CD163, Arg1, and CD209 in the DRAM1-high expression group and DRAM1-low expression group. (F) p53 levels in liver tissues of AH patients and controls were analyzed. The adjusted p value was calculated. (G) Pearson correlation analysis was used to analyze the correlation between the DRAM1 and p53 level. (H) PKM2 levels in liver tissues of AH patients and controls were analyzed. The adjusted p value was calculated. (I) Pearson correlation analysis was used to analyze the correlation between DRAM1 level and PKM2 level. ∗p < 0.05; ∗∗p < 0.01; ∗∗∗p < 0.001; ns, no significance.
Figure 7 DRAM1 expression in liver tissues of AH patients Dataset (GEO database: GSE28619) of AH patients and normal controls were analyzed. (A) DRAM1 levels in liver tissues of AH patients and controls were analyzed. The adjusted p value was calculated. (B) Pearson correlation analysis was used to analyze the correlations between DRAM1 level and M1 macrophage markers including CD86, CXCL9, CXCL10, and TLR2. (C) Pearson correlation analysis was used to analyze the correlations between DRAM1 level and M2 macrophage markers including CD163, IL-10, Arg1, and CD209. (D) The expression levels of CXCL9, CXCL10, and TLR2 in the DRAM1-high expression group and DRAM1-low expression group. (E) The expression levels of CD163, Arg1, and CD209 in the DRAM1-high expression group and DRAM1-low expression group. (F) p53 levels in liver tissues of AH patients and controls were analyzed. The adjusted p value was calculated. (G) Pearson correlation analysis was used to analyze the correlation between the DRAM1 and p53 level. (H) PKM2 levels in liver tissues of AH patients and controls were analyzed. The adjusted p value was calculated. (I) Pearson correlation analysis was used to analyze the correlation between DRAM1 level and PKM2 level. ∗p < 0.05; ∗∗p < 0.01; ∗∗∗p < 0.001; ns, no significance.CC BY-NC-ND · PubMed Central
Figure 8 Diagram for the expression, role, and mechanism of DRAM1 in ethanol-treated hepatic cells Ethanol can upregulate the expression of DRAM1 in hepatic cells at the early stage. DRAM1 further interacts with PKM2, promotes the translocation of PKM2 to the plasma membrane, and increases the secretion of PKM2-enriched EVs. Then the released EVs can promote macrophage activation and the expression of M1 macrophage markers.
Figure 8 Diagram for the expression, role, and mechanism of DRAM1 in ethanol-treated hepatic cells Ethanol can upregulate the expression of DRAM1 in hepatic cells at the early stage. DRAM1 further interacts with PKM2, promotes the translocation of PKM2 to the plasma membrane, and increases the secretion of PKM2-enriched EVs. Then the released EVs can promote macrophage activation and the expression of M1 macrophage markers.CC BY-NC-ND · PubMed Central

Verification

Claims the paper makes

The claims and statistics of this paper haven’t been checked yet.

Run the check — free, no account needed. It reads the open-access text and checks the sources it cites.

A few free checks a day · papers already verified open instantly · results are public

Claims other papers make about this one

Each is checked against this paper’s own text: does it say what the citing paper says it does?

Self-check

Percentages, sums and reported differences re-computed from the paper’s own numbers.

The self-check needs the paper’s full text.

Citations

Cites

Research works printed but not linked: 40

  1. Wei, 2019, DRAM1 deficiency affects the organization and function of the Golgi apparatus, Cell. Signal., 63, 109375, 10.1016/j.cellsig.2019.109375 · DOI
  2. Kerley-Hamilton, 2007, The direct p53 target gene, FLJ11259/DRAM, is a member of a novel family of transmembrane proteins, Biochim. Biophys. Acta., 1769, 209, 10.1016/j.bbaexp.2007.02.002 · DOI
  3. Liu, 2013, Depending on the stage of hepatosteatosis, p53 causes apoptosis primarily through either DRAM-induced autophagy or BAX, Liver Int., 33, 1566, 10.1111/liv.12238 · DOI
  4. Tang, 2019, Effect of autophagy gene DRAM on proliferation, cell cycle, apoptosis, and autophagy of osteoblast in osteoporosis rats, J. Cell. Physiol., 234, 5023, 10.1002/jcp.27304 · DOI · Paper page
  5. Memmert, 2018, Damage-regulated autophagy modulator 1 in oral inflammation and infection, Clin. Oral Investig., 22, 2933, 10.1007/s00784-018-2381-6 · DOI
  6. Avila, 2020, Recent advances in alcohol-related liver disease (ALD): summary of a Gut round table meeting, Gut, 69, 764, 10.1136/gutjnl-2019-319720 · DOI
  7. Thursz, 2019, Alcohol-related liver disease: areas of consensus, unmet needs and opportunities for further study, J. Hepatol., 70, 521, 10.1016/j.jhep.2018.10.041 · DOI
  8. Griswold, 2018, Alcohol use and burden for 195 countries and territories, 1990-2016: a systematic analysis for the Global Burden of Disease Study 2016, Lancet, 392, 1015, 10.1016/S0140-6736(18)31310-2 · DOI · Paper page
  9. Kong, 2019, Pathogenesis, early diagnosis, and therapeutic management of alcoholic liver disease, Int. J. Mol. Sci., 20, 2712, 10.3390/ijms20112712 · DOI
  10. Amini, 2010, Alcoholic hepatitis 2010: a clinician's guide to diagnosis and therapy. World, J. Gastroenterol., 16, 4905
  11. Naveau, 2004, A double-blind randomized controlled trial of infliximab associated with prednisolone in acute alcoholic hepatitis, Hepatology, 39, 1390, 10.1002/hep.20206 · DOI
  12. Verma, 2016, Alcohol stimulates macrophage activation through caspase-dependent hepatocyte derived release of CD40L containing extracellular vesicles, J. Hepatol., 64, 651, 10.1016/j.jhep.2015.11.020 · DOI
  13. Ge, 2014, Osteopontin binding to lipopolysaccharide lowers tumor necrosis factor-α and prevents early alcohol-induced liver injury in mice, Hepatology, 59, 1600, 10.1002/hep.26931 · DOI
  14. Dou, 2019, Macrophage phenotype and function in liver disorder, Front. Immunol., 10, 3112, 10.3389/fimmu.2019.03112 · DOI
  15. Li, 2020, DNMT3b-mediated methylation of ZSWIM3 enhances inflammation in alcohol-induced liver injury via regulating TRAF2-mediated NF-κB pathway, Clin. Sci. (Lond)., 134, 1935, 10.1042/CS20200031 · DOI
  16. Slevin, 2020, Kupffer cells: inflammation pathways and cell-cell interactions in alcohol-associated liver disease, Am. J. Pathol., 190, 2185, 10.1016/j.ajpath.2020.08.014 · DOI
  17. Kong, 2019, HSPA12A is a novel player in nonalcoholic steatohepatitis via promoting nuclear PKM2-mediated M1 macrophage polarization, Diabetes, 68, 361, 10.2337/db18-0035 · DOI
  18. Elsharkasy, 2020, Extracellular vesicles as drug delivery systems: Why and how?, Adv. Drug Deliv. Rev., 159, 332, 10.1016/j.addr.2020.04.004 · DOI
  19. Mead, 2020, Extracellular vesicle therapy for retinal diseases, Prog. Retin. Eye Res., 79, 100849, 10.1016/j.preteyeres.2020.100849 · DOI
  20. Azparren-Angulo, 2021, Extracellular vesicles in hepatology: physiological role, involvement in pathogenesis, and therapeutic opportunities, Pharmacol. Ther., 218, 107683, 10.1016/j.pharmthera.2020.107683 · DOI
  21. Thietart, 2020, Extracellular vesicles as biomarkers in liver diseases: a clinician's point of view, J. Hepatol., 73, 1507, 10.1016/j.jhep.2020.07.014 · DOI
  22. Mandrekar, 2009, Signalling pathways in alcohol-induced liver inflammation, J. Hepatol., 50, 1258, 10.1016/j.jhep.2009.03.007 · DOI
  23. Kreimer, 2015, Mass-spectrometry-based molecular characterization of extracellular vesicles: lipidomics and proteomics, J. Proteome. Res., 14, 2367, 10.1021/pr501279t · DOI
  24. Hou, 2020, Ectosomal PKM2 promotes HCC by inducing macrophage differentiation and remodeling the tumor microenvironment, Mol. Cell., 78, 1192, 10.1016/j.molcel.2020.05.004 · DOI
  25. Ni, 2012, Serum starvation induces DRAM expression in liver cancer cells via histone modifications within its promoter locus, PLoS. One., 7, 10.1371/journal.pone.0050502 · DOI
  26. Yu, 2014, DRAM1 protects neuroblastoma cells from oxygen-glucose deprivation/reperfusion-induced injury via autophagy, Int. J. Mol. Sci., 15, 19253, 10.3390/ijms151019253 · DOI
  27. Xu, 2019, DRAM is involved in hypoxia/ischemia-induced autophagic apoptosis in hepatocytes, Aging Dis., 10, 82, 10.14336/AD.2018.0210 · DOI
  28. Xu, 2018, Protective effects of taraxasterol against ethanol-induced liver injury by regulating CYP2E1/Nrf2/HO-1 and NF-κB signaling pathways in mice, Oxid. Med. Cell. Longev., 2018, 8284107, 10.1155/2018/8284107 · DOI
  29. Sangineto, 2020, Dimethyl fumarate ameliorates hepatic inflammation in alcohol related liver disease, Liver Int., 40, 1610, 10.1111/liv.14483 · DOI
  30. Ho, 2019, Transcription-independent and -dependent p53-mediated apoptosis in response to genotoxic and non-genotoxic stress, Cell. Death Discov., 5, 131, 10.1038/s41420-019-0211-5 · DOI
  31. Ahn, 2010, Tid1 is a new regulator of p53 mitochondrial translocation and apoptosis in cancer, Oncogene, 29, 1155, 10.1038/onc.2009.413 · DOI
  32. Yu, 2019, Loss of p53 sensitizes cells to palmitic acid-induced apoptosis by reactive oxygen species accumulation, Int. J. Mol. Sci., 20, 6268, 10.3390/ijms20246268 · DOI
  33. Yuan, 2020, Vitexin protects against ethanol-induced liver injury through Sirt1/p53 signaling pathway, Eur. J. Pharmacol., 873, 173007, 10.1016/j.ejphar.2020.173007 · DOI
  34. Yan, 2018, p53 as a double-edged sword in the progression of non-alcoholic fatty liver disease, Life Sci., 215, 64, 10.1016/j.lfs.2018.10.051 · DOI
  35. McGill, 1999, p53 and cancer therapy: a double-edged sword, J. Clin. Invest., 104, 223, 10.1172/JCI7861 · DOI
  36. Alquraishi, 2019, Pyruvate kinase M2: a simple molecule with complex functions, Free Radic. Biol. Med., 143, 176, 10.1016/j.freeradbiomed.2019.08.007 · DOI
  37. Hsu, 2018, Pyruvate kinase M2 fuels multiple aspects of cancer cells: from cellular metabolism, transcriptional regulation to extracellular signaling, Mol. Cancer, 17, 35, 10.1186/s12943-018-0791-3 · DOI
  38. Yang, 2014, PKM2 regulates the Warburg effect and promotes HMGB1 release in sepsis, Nat. Commun., 5, 4436, 10.1038/ncomms5436 · DOI
  39. Meoli, 2018, Nonalcoholic fatty liver disease and gastric bypass surgery regulate serum and hepatic levels of pyruvate kinase isoenzyme M2, Am. J. Physiol. Endocrinol. Metab., 315, E613, 10.1152/ajpendo.00296.2017 · DOI
  40. Amin, 2019, Pyruvate kinase M2: a multifarious enzyme in non-canonical localization to promote cancer progression, Biochim. Biophys. Acta. Rev. Cancer, 1871, 331, 10.1016/j.bbcan.2019.02.003 · DOI

Cited by

Sorted by citations

See all 26

Metadata

Authors
Tan, J., Zhang, J., Wang, M., Wang, Y., Dong, M., Ma, X., Sun, B., Liu, S., Zhao, Z., Chen, L., Jin, W., Liu, K., Xin, Y., & Zhuang, L.
Venue
Molecular Therapy Nucleic Acids
Publisher
Elsevier BV
Published
2022-03
Volume
27
Pages
375-389
ISSN
2162-2531
Cited by
26
References
5
Language
en
Funders
  • National Natural Science Foundation of China (31770837, 81873976)
  • Department of Science and Technology of Shandong Province
  • Key Technology Research and Development Program of Shandong (2019GSF108148)

About these checks

Registry, retraction, Cites and statistics results are computed, not judged, with one exception: a printed reference that no index lists is read once by a model before it counts as a citation error. Claims are extracted by a model and kept only when their quote appears verbatim in the text; each cited source is then checked, with a model’s help, for whether it says what the claim relies on. Those verdicts can be wrong — read the claim’s quote and the cited source before relying on one.

Statistics and arithmetic are recomputed, not judged.

Confidence bands are shown only for fields calibrated on our annotated test set. None is calibrated yet, so no band is shown.

What counts as a claim ›How we measure confidence ›How we check this ›

Are you an author, or do you see a problem with this page? Request a review