Cited by 70

The DOI matches its Crossref record; 2 of the 2 references it cites were found in a registry or an index.

Glacial lake evolution and Atlantic-Pacific drainage reversals during deglaciation of the Patagonian Ice Sheet

Thorndycraft, Varyl R., Bendle, Jacob M., Benito, Gerardo, Davies, Bethan J., Sancho, Carlos, Palmer, Adrian P., Fabel, Derek, Medialdea, Alicia, Martin, Julian R.V.·2019·Quaternary Science Reviews

Abstract

Modelling experiments of drainage events from proglacial lakes of the Río Baker catchment (central Patagonia, 46–48 ⁰S) indicate that Atlantic-Pacific drainage reversals may have caused freshwater forcing of regional climate. However, much of the region remains unmapped in detail and available geochronological data is equivocal, leading to multiple published palaeolake evolution models. We evaluate these models through new geomorphological mapping from the Baker valley; cosmogenic dating of moraine boulders that demonstrates an Antarctic Cold Reversal ice readvance that blocked drainage through the Río Baker; an altitudinal-based review of published geochronology; and regional analysis of shoreline glacio-isostasy and palaeolake levels. We use these datasets to present a new regional palaeolake evolution model underpinned by Bayesian age modelling. We demonstrate that 10 3 km 3 of freshwater was released to the Pacific over at least 6 drainage events from before 15.3–15.0 cal yr BP to the early Holocene. The final stages of lake drainage involved catastrophic flooding along the Baker valley, evidenced by high magnitude flood landforms such as boulder bars, likely caused by failure of large valley floor moraine dams. We place these drainage events in the context of Late Quaternary meltwater pathways associated with advance/retreat of the Patagonian Ice Sheet and early human occupation across the region. Although broad patterns of ice retreat and lake formation may be similar a…

Overview

The claims and statistics of this paper haven’t been checked yet.

Run the check — free, no account needed. It reads the open-access text and checks the sources it cites.

A few free checks a day · papers already verified open instantly · results are public

Integrity signals

Registry

Crossref · 10.1016/j.quascirev.2018.10.036

Cites

2 of 2 references verified0 citation errors · 0 not checkable

Statistics

Figures

Image 1
CC BY 4.0 · From the PDF
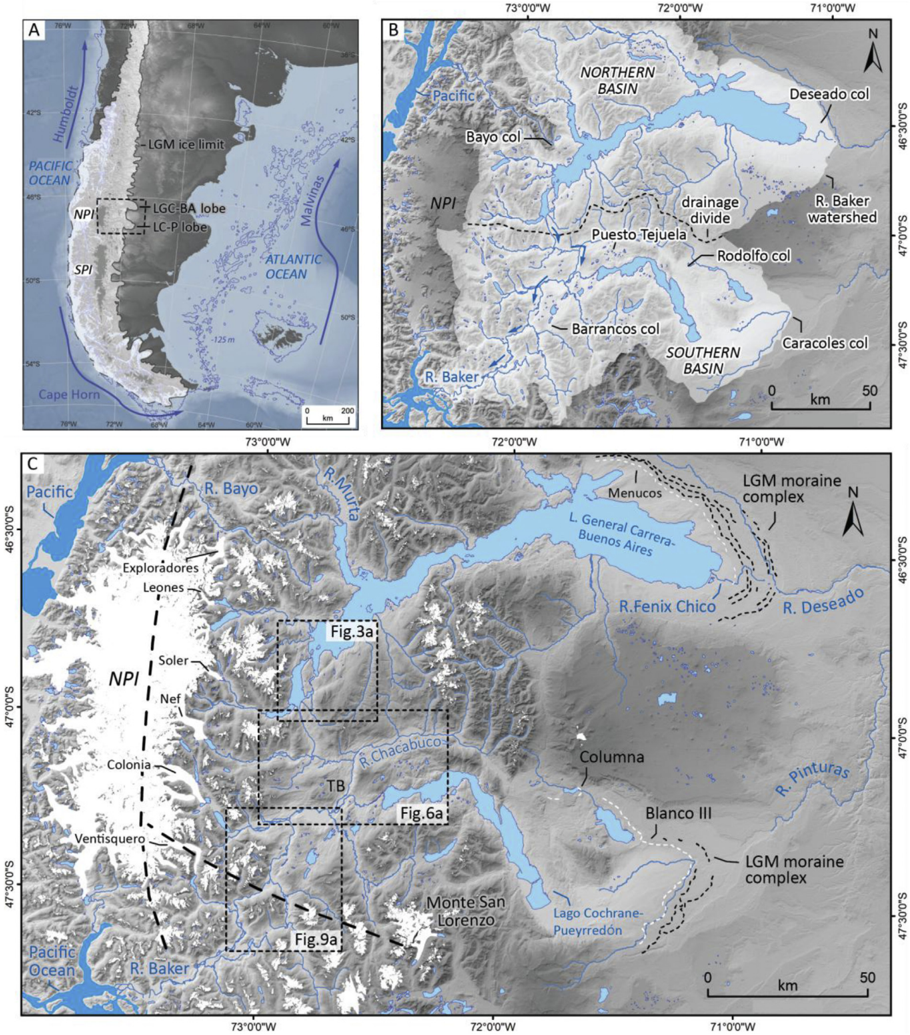
Fig. 1 (a). The study area in southern South America with the LGM ice limit of the former Patagonian Ice Sheet (PIS) (Bendle et al., 2017a) and principal ocean currents shown. (b) The Río Baker catchment, divided into northern and southern basins as used in the text. Blue arrows indicate river fl ow direction. Also shown are the major palaeolake out fl ow cols discussed in the text. (c) Regional map showing the spatial context of the main fi eld study areas to the Northern Patagonian Ice fi eld (NPI) and the basins of Lago General Carrera/ Buenos Aires (LGC-BA) and Lago Cochrane/Puerreyd  on (LC-P), the two lakes hypothesised to join through the Baker Valley in the Tamango Basin (TB) sector. Contemporary glaciers (Randolph Glacier Inventory) are shown in white, highlighting both the NPI and Monte San Lorenzo (MSL) ice cap. Also shown are the LGM limits (dotted lines) associated with the main eastward fl owing ice-lobes of the PIS, and the LGM ice divides (black dashed lines) from Hubbard et al. (2005). Dates from the youngest moraines (white dotted line) are used in our geochronological review.
Fig. 1 (a). The study area in southern South America with the LGM ice limit of the former Patagonian Ice Sheet (PIS) (Bendle et al., 2017a) and principal ocean currents shown. (b) The Río Baker catchment, divided into northern and southern basins as used in the text. Blue arrows indicate river fl ow direction. Also shown are the major palaeolake out fl ow cols discussed in the text. (c) Regional map showing the spatial context of the main fi eld study areas to the Northern Patagonian Ice fi eld (NPI) and the basins of Lago General Carrera/ Buenos Aires (LGC-BA) and Lago Cochrane/Puerreyd  on (LC-P), the two lakes hypothesised to join through the Baker Valley in the Tamango Basin (TB) sector. Contemporary glaciers (Randolph Glacier Inventory) are shown in white, highlighting both the NPI and Monte San Lorenzo (MSL) ice cap. Also shown are the LGM limits (dotted lines) associated with the main eastward fl owing ice-lobes of the PIS, and the LGM ice divides (black dashed lines) from Hubbard et al. (2005). Dates from the youngest moraines (white dotted line) are used in our geochronological review.CC BY 4.0 · From the PDF
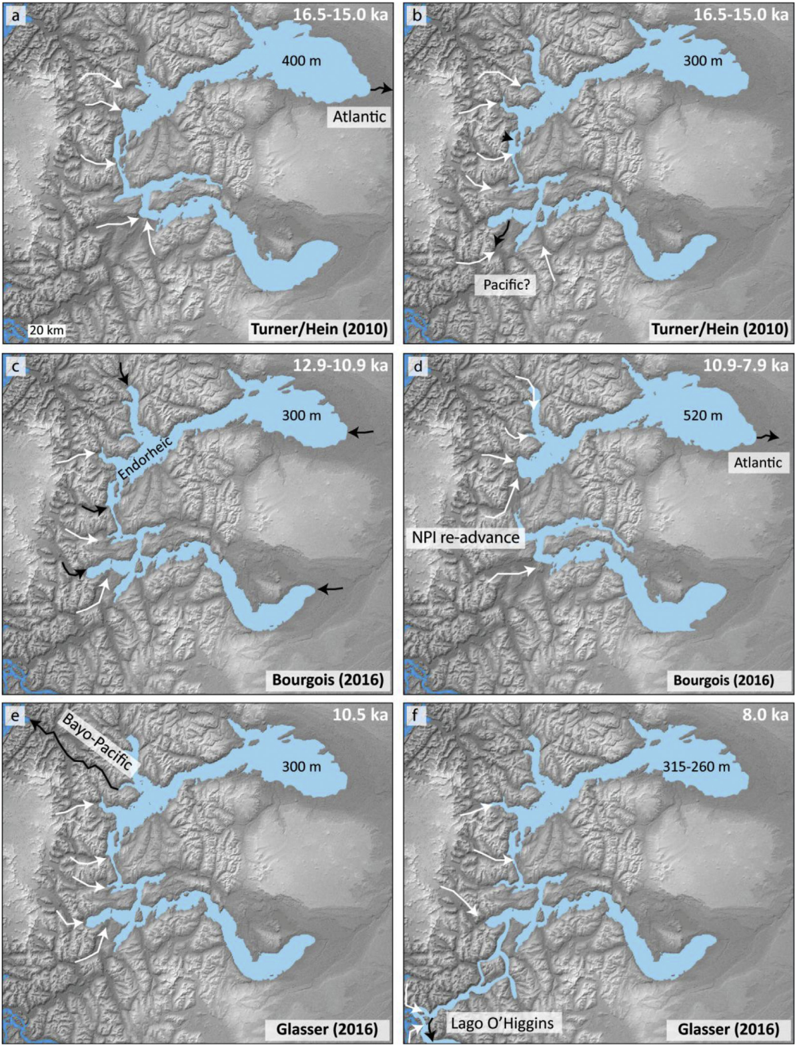
Fig. 2 Summary maps illustrating the main stages of published palaeolake evolution models demonstrating a range of interpretations for the formation and drainage of Lago Chalenko. White arrows indicate major glacier fl ow pathways, black arrows indicate lake drainage routes. (a) The upper uni fi ed lake at the ~400 masl level (Hein et al., 2010, cf. Turner et al., 2005). (b) The lower uni fi ed lake at the~ 300 masl level, with a hypothesised but unidenti fi ed drainage pathway to the Paci fi c (Hein et al., 2010). (c) An endhoreic drainage stage proposed by Bourgois et al. (2016). (d) Holocene transgression of LGC/BA to ~520 masl (Bourgois et al., 2016). (e) The lower uni fi ed lake level at ~300 masl, with Paci fi c drainage to the north of the Northern Patagonian Ice fi eld via the Bayo Valley (Glasser et al., 2016). (f) A uni fi ed lower lake at ~260 masl dammed with a drainage pathway via Lago O'Higgins/San Martin (Glasser et al., 2016), a lake of the Southern Patagonian Ice fi eld region (shown on Fig. 16).
Fig. 2 Summary maps illustrating the main stages of published palaeolake evolution models demonstrating a range of interpretations for the formation and drainage of Lago Chalenko. White arrows indicate major glacier fl ow pathways, black arrows indicate lake drainage routes. (a) The upper uni fi ed lake at the ~400 masl level (Hein et al., 2010, cf. Turner et al., 2005). (b) The lower uni fi ed lake at the~ 300 masl level, with a hypothesised but unidenti fi ed drainage pathway to the Paci fi c (Hein et al., 2010). (c) An endhoreic drainage stage proposed by Bourgois et al. (2016). (d) Holocene transgression of LGC/BA to ~520 masl (Bourgois et al., 2016). (e) The lower uni fi ed lake level at ~300 masl, with Paci fi c drainage to the north of the Northern Patagonian Ice fi eld via the Bayo Valley (Glasser et al., 2016). (f) A uni fi ed lower lake at ~260 masl dammed with a drainage pathway via Lago O'Higgins/San Martin (Glasser et al., 2016), a lake of the Southern Patagonian Ice fi eld region (shown on Fig. 16).CC BY 4.0 · From the PDF
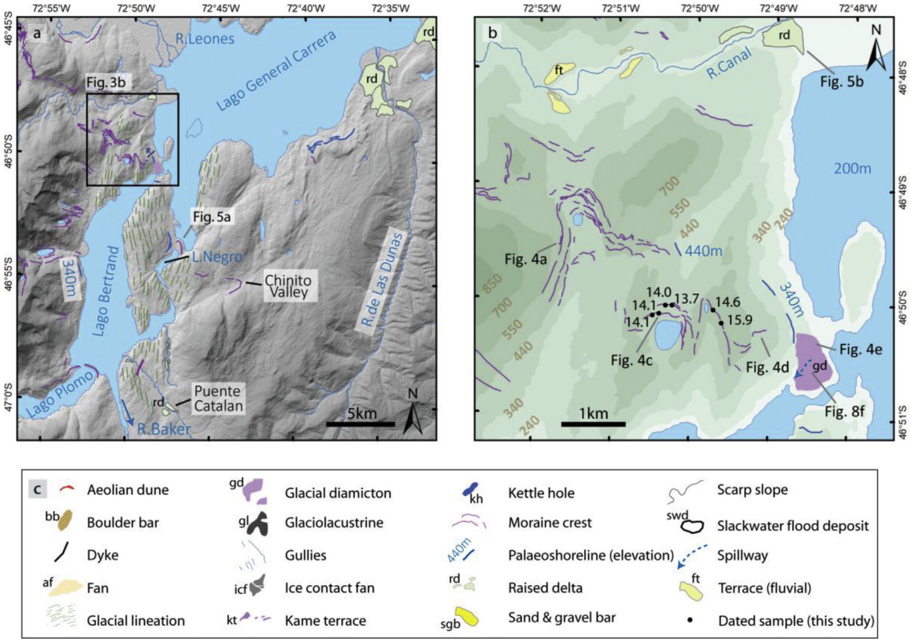
Fig. 3 (a). Geomorphological map of the Lago Bertrand sector illustrating moraine crests at the col between the Bertrand and Canal Valleys and in the Chinito valley. Raised deltas are also illustrated (cf. Bendle et al., 2017a). (b). Map of the moraine complex adjacent to the LGC/BA out fl ow into Lago Bertrand, with CND ages of sampled boulders illustrated. Photo locations for Figs. 4 and 8f are shown. (c). Legend for the geomorphological maps presented in Figs. 3, 6 and 9.
Fig. 3 (a). Geomorphological map of the Lago Bertrand sector illustrating moraine crests at the col between the Bertrand and Canal Valleys and in the Chinito valley. Raised deltas are also illustrated (cf. Bendle et al., 2017a). (b). Map of the moraine complex adjacent to the LGC/BA out fl ow into Lago Bertrand, with CND ages of sampled boulders illustrated. Photo locations for Figs. 4 and 8f are shown. (c). Legend for the geomorphological maps presented in Figs. 3, 6 and 9.CC BY 4.0 · From the PDF
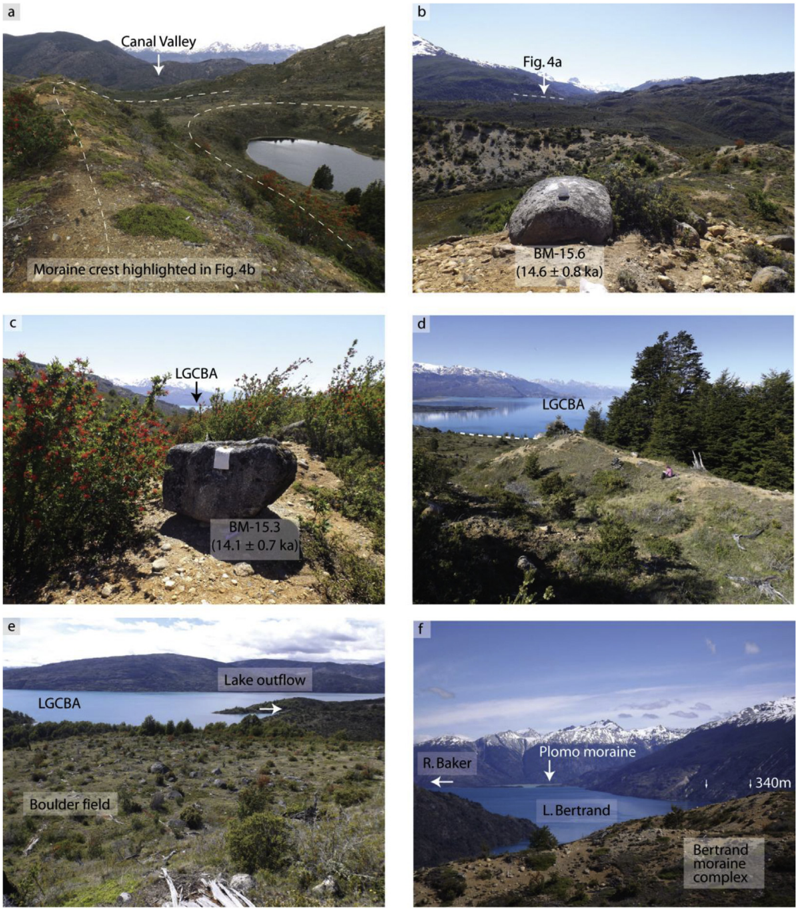
Fig. 4 Photographs from the Bertrand moraine complex. (a) View to the north from a lateral moraine at ~ 600 m asl dipping down to the ice margin sat on the col separating the Bertrand and Canal valleys. (b) Granite boulder (BM-15.6) sampled for CND, with the lateral moraine in Fig. 4a highlighted. (c) Granite boulder (BM-15.3) sampled for CND, with LGC-BA in the background. (d) Lateral moraine dipping towards LGC-BA, with the dashed line showing the top of a cliff edge that marks the limit of the moraine. (e) View of the northerly margin of glacial diamicton capped by a boulder fi eld at the contemporary out fl ow of LGC-BA. The photo is taken from a palaeoshoreline at ~340 m asl. (f) View from the Bertrand moraine complex towards the Plomo moraine, dated to 10.6 ka (Glasser et al., 2012), representing an ice limit of the Soler Glacier following opening of the Baker valley. Ice fl ow was towards the camera showing how ice at the Bertrand moraines would have blocked the Baker valley. Photos by V.R. Thorndycraft.
Fig. 4 Photographs from the Bertrand moraine complex. (a) View to the north from a lateral moraine at ~ 600 m asl dipping down to the ice margin sat on the col separating the Bertrand and Canal valleys. (b) Granite boulder (BM-15.6) sampled for CND, with the lateral moraine in Fig. 4a highlighted. (c) Granite boulder (BM-15.3) sampled for CND, with LGC-BA in the background. (d) Lateral moraine dipping towards LGC-BA, with the dashed line showing the top of a cliff edge that marks the limit of the moraine. (e) View of the northerly margin of glacial diamicton capped by a boulder fi eld at the contemporary out fl ow of LGC-BA. The photo is taken from a palaeoshoreline at ~340 m asl. (f) View from the Bertrand moraine complex towards the Plomo moraine, dated to 10.6 ka (Glasser et al., 2012), representing an ice limit of the Soler Glacier following opening of the Baker valley. Ice fl ow was towards the camera showing how ice at the Bertrand moraines would have blocked the Baker valley. Photos by V.R. Thorndycraft.CC BY 4.0 · From the PDF
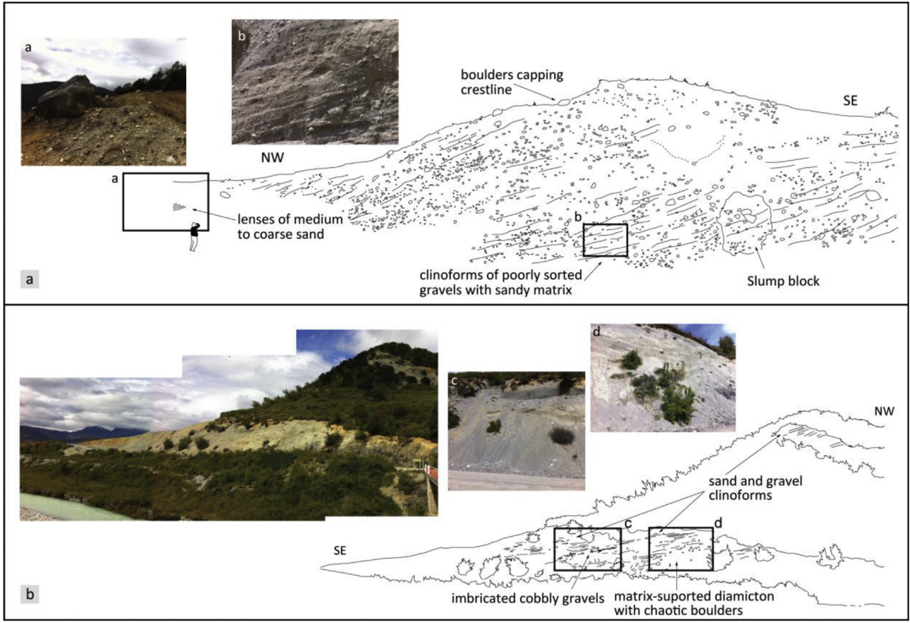
Fig. 5 (a). Sedimentology and fi eld photographs of the Lago Negro moraine (see Fig. 3a for location) showing clinoforms dipping towards LGC-BA. (b). Sedimentology and fi eld photographs of a moraine overlain by a raised delta at the mouth of the Río Canal (see Fig. 3b for location). Photos and sketches by J.M. Bendle.
Fig. 5 (a). Sedimentology and fi eld photographs of the Lago Negro moraine (see Fig. 3a for location) showing clinoforms dipping towards LGC-BA. (b). Sedimentology and fi eld photographs of a moraine overlain by a raised delta at the mouth of the Río Canal (see Fig. 3b for location). Photos and sketches by J.M. Bendle.CC BY 4.0 · From the PDF
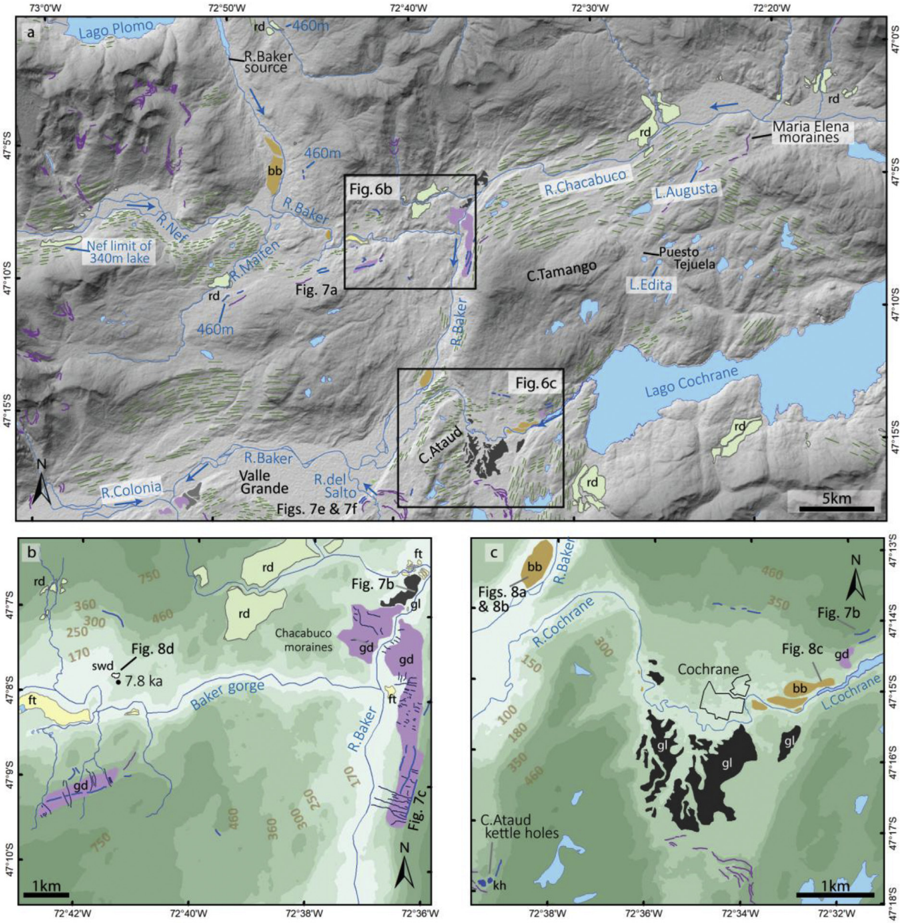
Fig. 6 (a) Geomorphological map of the Chacabuco-Cochrane sector of the Baker valley showing extent of the 460 m asl palaeoshoreline in the Maiten and upper Baker valleys. Blue arrows show river fl ow directions. (b) Geomorphology of the Baker-Chacabuco con fl uence sector showing the Chacabuco moraine complex and morph-stratigraphic relationship to palaeoshorelines. Note the 460 m asl palaeoshoreline is located at the top of moraine deposits on the eastern side of the Baker Valley to the south of the con fl uence. Also shown are slackwater deposits (swd) located upstream of the Baker gorge where GLOF fl ow hydraulics were controlled by valley narrowing. (c) Geomorphological map of the Cochrane sector showing glaciolacustrine sediments, palaeoshorelines and GLOF bars in the Cochrane and Baker valleys demonstrating two GLOF fl ow pathways. Note the size of the GLOF bars in relation to Cochrane town. Photo locations for Figs. 7 and 8 are shown. See Fig. 3c for legend.
Fig. 6 (a) Geomorphological map of the Chacabuco-Cochrane sector of the Baker valley showing extent of the 460 m asl palaeoshoreline in the Maiten and upper Baker valleys. Blue arrows show river fl ow directions. (b) Geomorphology of the Baker-Chacabuco con fl uence sector showing the Chacabuco moraine complex and morph-stratigraphic relationship to palaeoshorelines. Note the 460 m asl palaeoshoreline is located at the top of moraine deposits on the eastern side of the Baker Valley to the south of the con fl uence. Also shown are slackwater deposits (swd) located upstream of the Baker gorge where GLOF fl ow hydraulics were controlled by valley narrowing. (c) Geomorphological map of the Cochrane sector showing glaciolacustrine sediments, palaeoshorelines and GLOF bars in the Cochrane and Baker valleys demonstrating two GLOF fl ow pathways. Note the size of the GLOF bars in relation to Cochrane town. Photo locations for Figs. 7 and 8 are shown. See Fig. 3c for legend.CC BY 4.0 · From the PDF
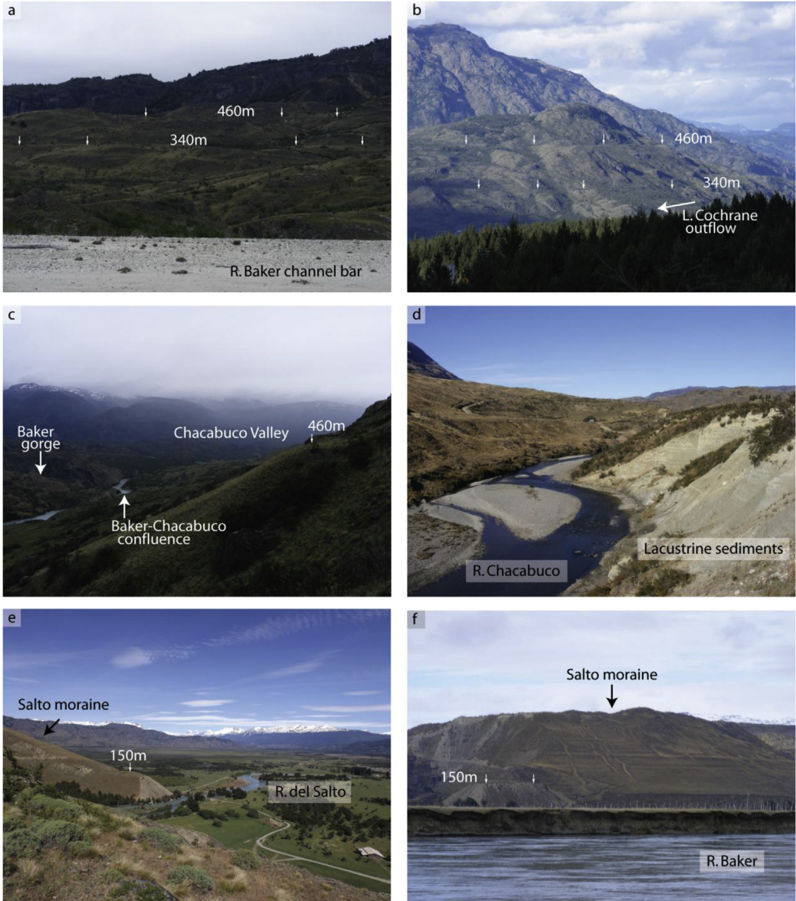
Fig. 7 Photographs of palaeolake landforms. (a) The 460 and 340 m asl shorlines, taken from a channel bar of the Río Baker, downstream of the Maiten valley (Fig. 6a). (b) The 460 and 340 asl shorelines above the Lago Cochrane out fl ow (Fig. 6c). (c) View upstream towards the Baker-Chacabuco con fl uence showing the 460 masl shoreline cut into the top of glacial diamicton blanketing the valley side (Fig. 6b). (d) Laminated glaciolacustirne sediments in the lower Chacabuco valley (Fig. 6a). (e) View westwards of a raised delta at ~150 m asl at the exit of Río del Salto in to Valle Grande (Fig. 6a). (f) View of the ~150 m asl raised delta in Valle Grande from the Río Baker. Note the shorelines cut into the ice distal side of the Salto moraine. Photos by V.R. Thorndycraft.
Fig. 7 Photographs of palaeolake landforms. (a) The 460 and 340 m asl shorlines, taken from a channel bar of the Río Baker, downstream of the Maiten valley (Fig. 6a). (b) The 460 and 340 asl shorelines above the Lago Cochrane out fl ow (Fig. 6c). (c) View upstream towards the Baker-Chacabuco con fl uence showing the 460 masl shoreline cut into the top of glacial diamicton blanketing the valley side (Fig. 6b). (d) Laminated glaciolacustirne sediments in the lower Chacabuco valley (Fig. 6a). (e) View westwards of a raised delta at ~150 m asl at the exit of Río del Salto in to Valle Grande (Fig. 6a). (f) View of the ~150 m asl raised delta in Valle Grande from the Río Baker. Note the shorelines cut into the ice distal side of the Salto moraine. Photos by V.R. Thorndycraft.CC BY 4.0 · From the PDF
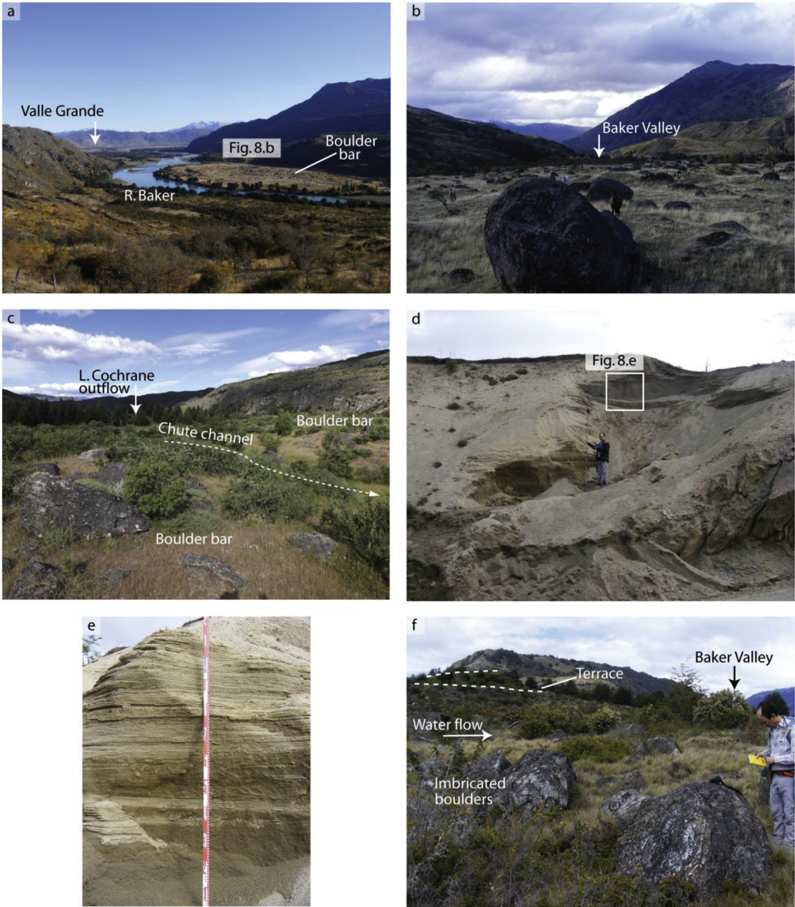
Fig. 8 Photographs of GLOF landforms and sediments. (a) view downstream of a GLOF boulder bar at the zone of valley expansion as the Rio Baker enters Valle Grande (Fig. 6c)). It is likely the boulders are lag-moraine boulders and this could be the site of a former ice margin of the Colonia Glacier. (b) Photo, looking upstream, of fl ow aligned boulders on top of the boulder bar surface shown in Fig. 8a. Note the horses for scale. (c) View of GLOF boulder bars looking upstream to the Lago Cochrane out fl ow (Fig. 6c). (d) Slackwater fl ood deposits exposed in a road cutting ~50 m above the valley fl oor (Fig. 6a). (e) Cross-strati fi cation in fi ne gravels and coarse sands at the top of the slackwater fl ood deposits shown in Fig. 8d. (f) Imbricated boulders at an abandoned spillway on top of the diamicton deposit at the LGC-BA out fl ow (Fig. 3b). Dipping terrace-like surfaces (one highlighted), also with imbricated boulders, demonstrate incision of the deposit. View is looking to the SW towards the Baker valley. Photos by V.R. Thorndycraft.
Fig. 8 Photographs of GLOF landforms and sediments. (a) view downstream of a GLOF boulder bar at the zone of valley expansion as the Rio Baker enters Valle Grande (Fig. 6c)). It is likely the boulders are lag-moraine boulders and this could be the site of a former ice margin of the Colonia Glacier. (b) Photo, looking upstream, of fl ow aligned boulders on top of the boulder bar surface shown in Fig. 8a. Note the horses for scale. (c) View of GLOF boulder bars looking upstream to the Lago Cochrane out fl ow (Fig. 6c). (d) Slackwater fl ood deposits exposed in a road cutting ~50 m above the valley fl oor (Fig. 6a). (e) Cross-strati fi cation in fi ne gravels and coarse sands at the top of the slackwater fl ood deposits shown in Fig. 8d. (f) Imbricated boulders at an abandoned spillway on top of the diamicton deposit at the LGC-BA out fl ow (Fig. 3b). Dipping terrace-like surfaces (one highlighted), also with imbricated boulders, demonstrate incision of the deposit. View is looking to the SW towards the Baker valley. Photos by V.R. Thorndycraft.CC BY 4.0 · From the PDF
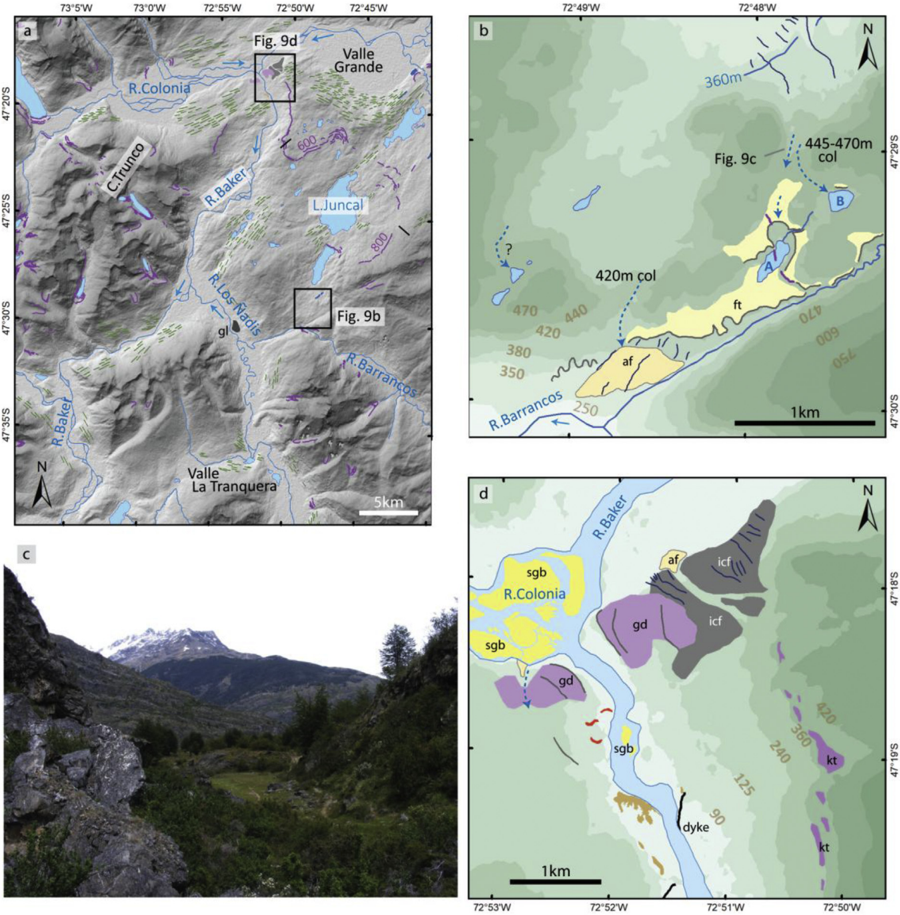
Fig. 9 (a) Geomorphological map of the Colonia-Barrancos sector. (b) Geomorphological map of the watershed zone between the Juncal and Barrancos valleys showing the evidence for water drainage over two col levels into the Barrancos Valley. We identify this locality as the missing drainage pathway of Hein et al. (2010) e see Fig. 2b. (c) Photo from the inner bedrock cut channel (~445 e 460 m asl) looking towards the Barrancos Valley. (d) Geomorphological map of the Colonia sector of the Baker Valley showing ice marginal landforms and evidence for high magnitude GLOF fl ows. Note the boulder bars are located upstream of a cross-valley dyke that controlled GLOF fl ow hydraulics through the reach. See Fig. 3c for legend.
Fig. 9 (a) Geomorphological map of the Colonia-Barrancos sector. (b) Geomorphological map of the watershed zone between the Juncal and Barrancos valleys showing the evidence for water drainage over two col levels into the Barrancos Valley. We identify this locality as the missing drainage pathway of Hein et al. (2010) e see Fig. 2b. (c) Photo from the inner bedrock cut channel (~445 e 460 m asl) looking towards the Barrancos Valley. (d) Geomorphological map of the Colonia sector of the Baker Valley showing ice marginal landforms and evidence for high magnitude GLOF fl ows. Note the boulder bars are located upstream of a cross-valley dyke that controlled GLOF fl ow hydraulics through the reach. See Fig. 3c for legend.CC BY 4.0 · From the PDF
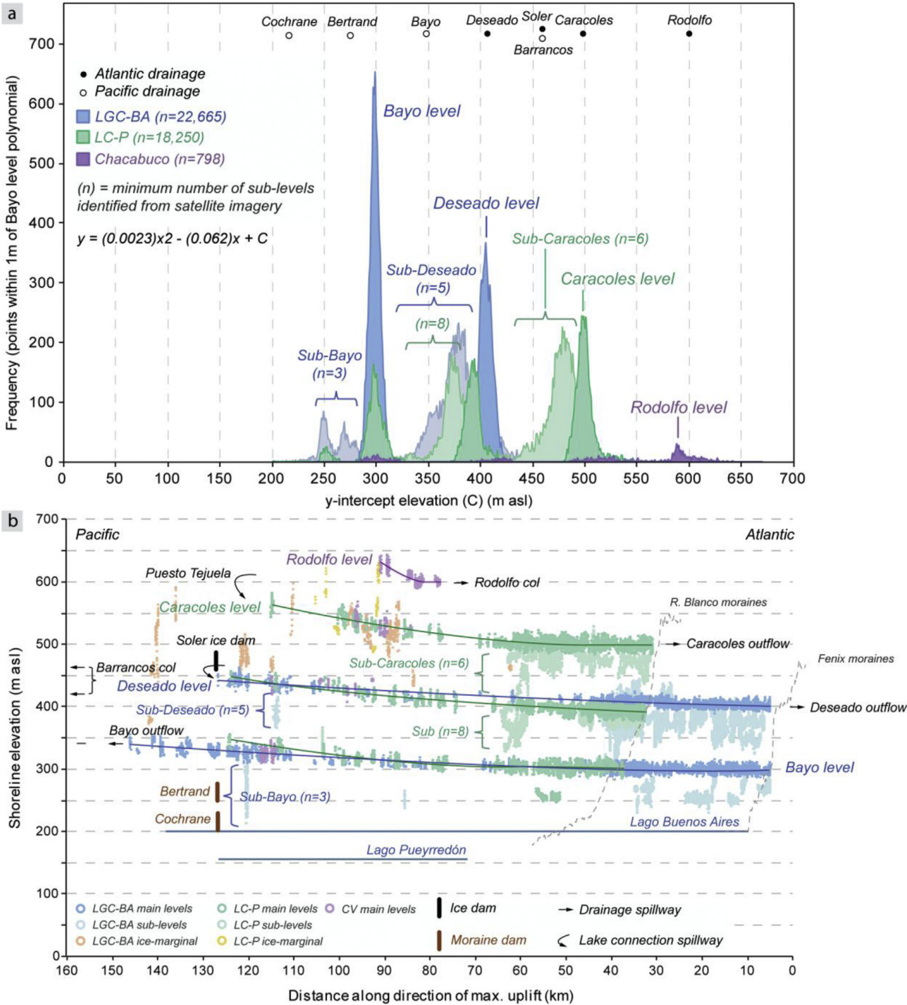
Fig. 10 (a) Shoreline histogram analysis showing multiple lake levels in the study area. A second order polynomial regression was fi tted to Bayo level shoreline point data. The histogram peaks show the number of points that fi t within 0.5 m of the polynomial regression line (equation shown on plot). Peaks indicate the number of points that fi t the polynomial, with higher peaks indicating better constrained lake levels. Also shown are the elevations of key cols and inferred ice dam spillways. (b) Shoreline point elevations plotted against distance perpendicular to the maximum inferred uplift. Cols, inferred ice dam spillways and drainage pathways are annotated. For data see Bendle (2018).
Fig. 10 (a) Shoreline histogram analysis showing multiple lake levels in the study area. A second order polynomial regression was fi tted to Bayo level shoreline point data. The histogram peaks show the number of points that fi t within 0.5 m of the polynomial regression line (equation shown on plot). Peaks indicate the number of points that fi t the polynomial, with higher peaks indicating better constrained lake levels. Also shown are the elevations of key cols and inferred ice dam spillways. (b) Shoreline point elevations plotted against distance perpendicular to the maximum inferred uplift. Cols, inferred ice dam spillways and drainage pathways are annotated. For data see Bendle (2018).CC BY 4.0 · From the PDF
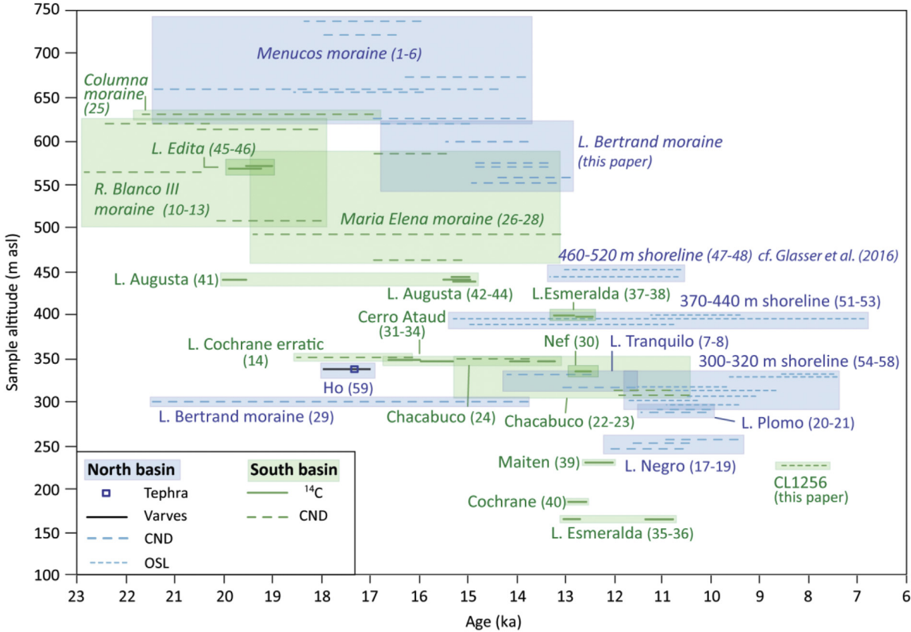
Fig. 11 Age versus sample altitude for the compiled geochronology database (see Supplementary Materials Table SM1). Numbers in brackets indicate sample numbers listed in Table SM1, and boxes are drawn around multiple samples from the same landform. The CND and OSL ages from this study are presented in Table 1. Samples are plotted according to dating method and whether they are from the northern or southern basins (see Fig. 1b). The length of the symbols are the calculated errors (Table 1 and SM1). Note the position of the dated Ho tephra, which anchors a varve chronology from Lago General Carrera/Buenos Aires (Bendle et al., 2017b) improving age precision for the onset of deglaciation.
Fig. 11 Age versus sample altitude for the compiled geochronology database (see Supplementary Materials Table SM1). Numbers in brackets indicate sample numbers listed in Table SM1, and boxes are drawn around multiple samples from the same landform. The CND and OSL ages from this study are presented in Table 1. Samples are plotted according to dating method and whether they are from the northern or southern basins (see Fig. 1b). The length of the symbols are the calculated errors (Table 1 and SM1). Note the position of the dated Ho tephra, which anchors a varve chronology from Lago General Carrera/Buenos Aires (Bendle et al., 2017b) improving age precision for the onset of deglaciation.CC BY 4.0 · From the PDF
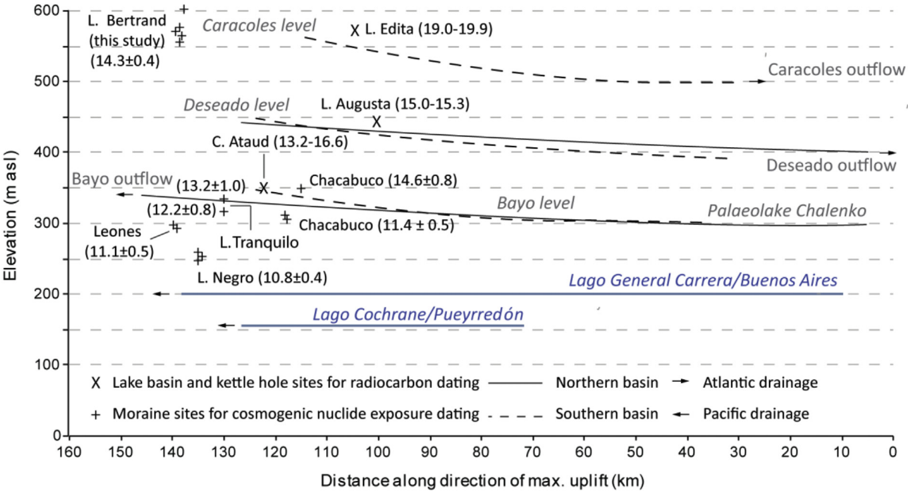
Fig. 12 Selected geochronology sample elevations plotted against the isostatic shorelines presented in Fig. 10. Weighted mean ages and errors for CND ages, the modelled ages for Lago Augusta (SM.2.1) and the calibrated age ranges for the other radiocarbon dated sites are shown in brackets. Note that CND ages from various moraine sites are located beneath the Bayo lake level. The two lower elevation Chacabuco boulders (11.3 ka) are younger than the higher elevation boulder (14.6 ka) that was exposed above the Bayo lake level. The Lago Bertrand weighted mean (this study) is calculated by using the fi ve dates selected for the Bayesian age model (see SM 2.2).
Fig. 12 Selected geochronology sample elevations plotted against the isostatic shorelines presented in Fig. 10. Weighted mean ages and errors for CND ages, the modelled ages for Lago Augusta (SM.2.1) and the calibrated age ranges for the other radiocarbon dated sites are shown in brackets. Note that CND ages from various moraine sites are located beneath the Bayo lake level. The two lower elevation Chacabuco boulders (11.3 ka) are younger than the higher elevation boulder (14.6 ka) that was exposed above the Bayo lake level. The Lago Bertrand weighted mean (this study) is calculated by using the fi ve dates selected for the Bayesian age model (see SM 2.2).CC BY 4.0 · From the PDF
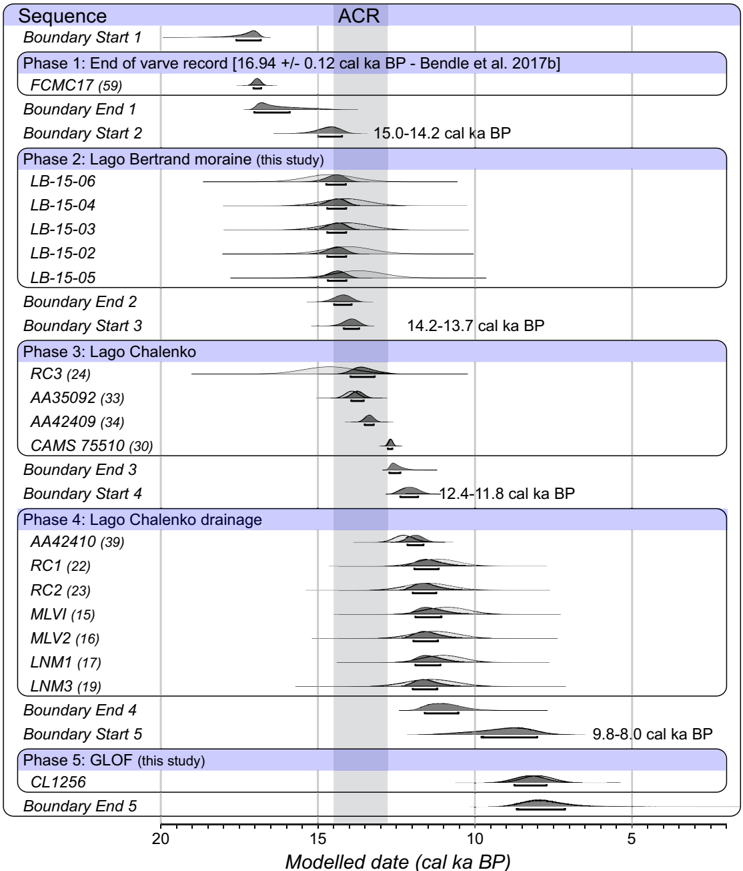
Fig. 13 Bayesian age Sequence model for key palaeolake evolution events through the main Baker valley. Phase (1): end of varve sedimentation at Fenix Chico. Phase (2): formation of the Bertrand moraine complex (this study). Phase (3) Formation of Lago Chalenko following retreat of the Soler Glacier from the Bertrand moraines and the opening of the Baker valley. Phase (4) Lago Chalenko drainage. Phase (5) GLOF events. The timing of the Antarctic Cold Reversal is shown. Numbers in parentheses refer to sample numbers in Table SM 1.
Fig. 13 Bayesian age Sequence model for key palaeolake evolution events through the main Baker valley. Phase (1): end of varve sedimentation at Fenix Chico. Phase (2): formation of the Bertrand moraine complex (this study). Phase (3) Formation of Lago Chalenko following retreat of the Soler Glacier from the Bertrand moraines and the opening of the Baker valley. Phase (4) Lago Chalenko drainage. Phase (5) GLOF events. The timing of the Antarctic Cold Reversal is shown. Numbers in parentheses refer to sample numbers in Table SM 1.CC BY 4.0 · From the PDF
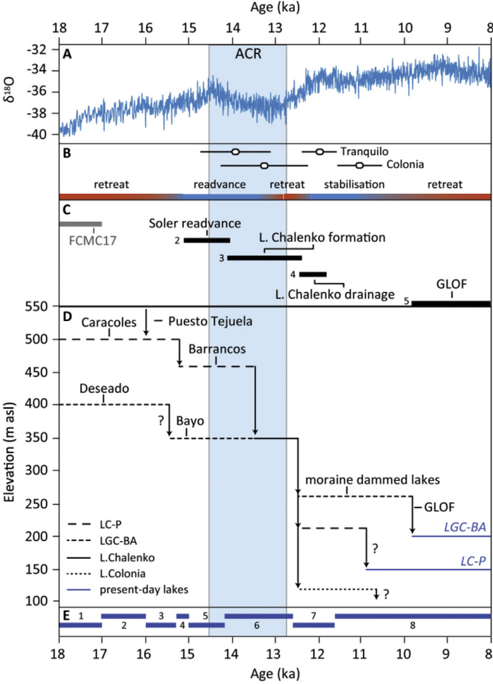
Fig. 14 Summary of palaeolake evolution during the Last Glacial-Interglacial Transition. a) WDC d 18 O (palaeotemperature) record demonstrating the Antarctic Cold Reversal (WAIS Members, 2013); b) Inferred glacier dynamics with CND ages from selected moraines of the Tranquilo (Sagredo et al., 2018) and Colonia (Nimick et al., 2016) glaciers shown; c) Bayesian age model phases (2 e 5) from Fig. 13 (this paper) and the FCMC-17 varve record duration from the onset of deglaciation (Bendle et al., 2017b); d) inferred lake levels and drainage events; and e) Stages of the palaeolake evolution model presented in Section 5.4 (this paper).
Fig. 14 Summary of palaeolake evolution during the Last Glacial-Interglacial Transition. a) WDC d 18 O (palaeotemperature) record demonstrating the Antarctic Cold Reversal (WAIS Members, 2013); b) Inferred glacier dynamics with CND ages from selected moraines of the Tranquilo (Sagredo et al., 2018) and Colonia (Nimick et al., 2016) glaciers shown; c) Bayesian age model phases (2 e 5) from Fig. 13 (this paper) and the FCMC-17 varve record duration from the onset of deglaciation (Bendle et al., 2017b); d) inferred lake levels and drainage events; and e) Stages of the palaeolake evolution model presented in Section 5.4 (this paper).CC BY 4.0 · From the PDF
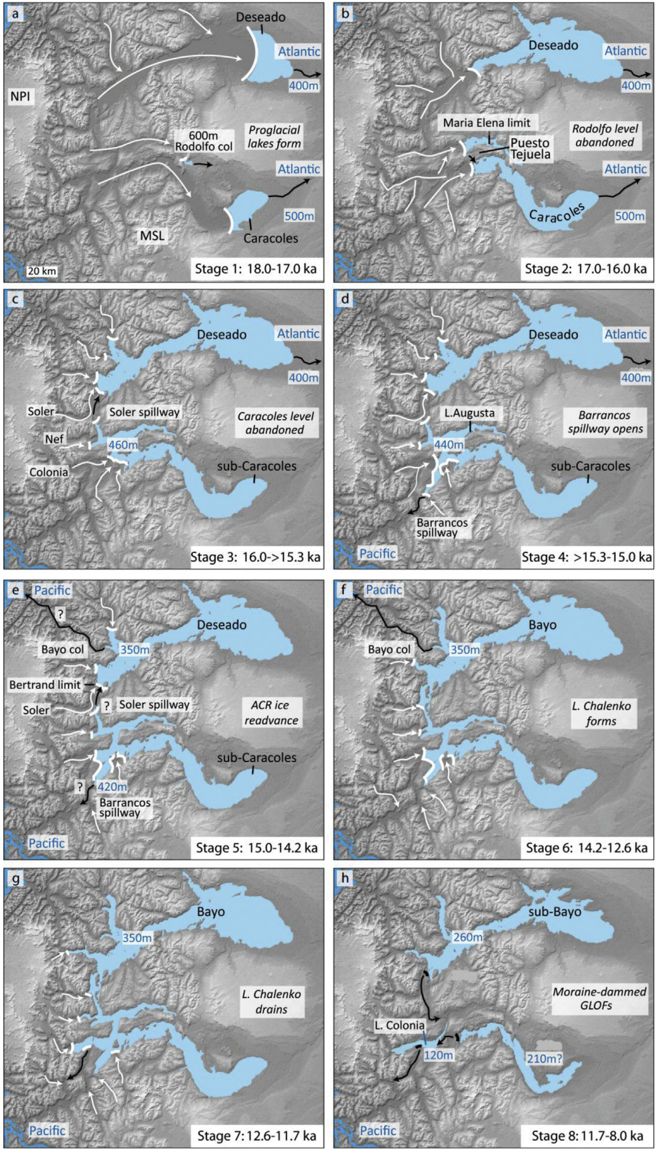
Fig. 15 Palaeolake evolution model during Patagonian Ice-Sheet deglaciation at 46 e 48  S. White arrows show main ice fl ow pathways and black arrows meltwater drainage routes. White lines indicate glacier-lake margins, black lines mark moraine dam positions.
Fig. 15 Palaeolake evolution model during Patagonian Ice-Sheet deglaciation at 46 e 48  S. White arrows show main ice fl ow pathways and black arrows meltwater drainage routes. White lines indicate glacier-lake margins, black lines mark moraine dam positions.CC BY 4.0 · From the PDF
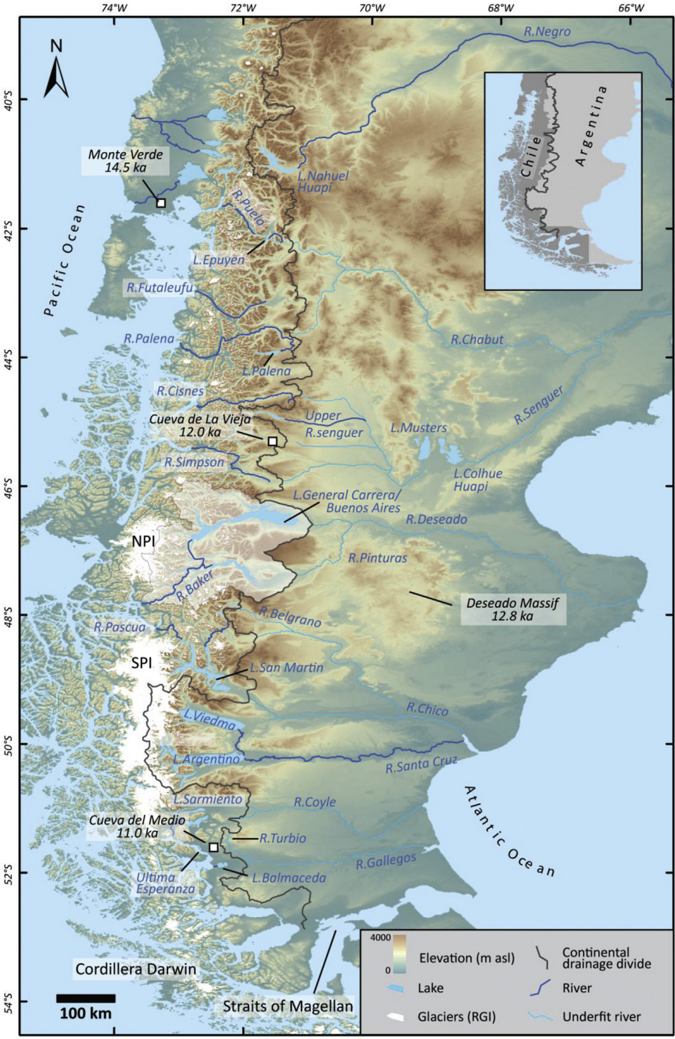
Fig. 16 Map of continental-scale drainage reversals across Patagonia and selected archaeological sites. The main drainage pathways, which experienced Atlantic-Paci fi c drainage reversals during PIS deglaciation, are shown by the under fi t river valleys. Only ríos Negro, Santa Cruz and the upper Senguer maintained an Atlantic drainage pathway. The continental drainage divide is based on the USGS hydrosheds database (30 s South America drainage basin shape fi les). The location of the Río Baker catchment (this study) is shown. North of 46  S, ríos Simpson, Cisnes and Futaleufu drain valleys with now disappeared palaeolakes. A major river capture event also took place at ~50  S where Lago Viedma drained to Lago Argentino and Río Santa Cruz, abandoning its Río Chico pathway to the Atlantic. Contemporary glacier extent is from the Randolph Glacier Inventory. Inset: Map of Chile, Argentina and the continental drainage divide.
Fig. 16 Map of continental-scale drainage reversals across Patagonia and selected archaeological sites. The main drainage pathways, which experienced Atlantic-Paci fi c drainage reversals during PIS deglaciation, are shown by the under fi t river valleys. Only ríos Negro, Santa Cruz and the upper Senguer maintained an Atlantic drainage pathway. The continental drainage divide is based on the USGS hydrosheds database (30 s South America drainage basin shape fi les). The location of the Río Baker catchment (this study) is shown. North of 46  S, ríos Simpson, Cisnes and Futaleufu drain valleys with now disappeared palaeolakes. A major river capture event also took place at ~50  S where Lago Viedma drained to Lago Argentino and Río Santa Cruz, abandoning its Río Chico pathway to the Atlantic. Contemporary glacier extent is from the Randolph Glacier Inventory. Inset: Map of Chile, Argentina and the continental drainage divide.CC BY 4.0 · From the PDF

Verification

Claims the paper makes

The claims and statistics of this paper haven’t been checked yet.

Run the check — free, no account needed. It reads the open-access text and checks the sources it cites.

A few free checks a day · papers already verified open instantly · results are public

Claims other papers make about this one

Each is checked against this paper’s own text: does it say what the citing paper says it does?

Self-check

Percentages, sums and reported differences re-computed from the paper’s own numbers.

The self-check needs the paper’s full text.

Citations

Cites

Show all 2 references

Research works printed but not linked: 75

  1. Baker, 2009, The channelled scabland: a retrospective, Annu. Rev. Earth Planet Sci., 37, 393, 10.1146/annurev.earth.061008.134726 · DOI
  2. Balco, 2011, Contributions and unrealized potential contributions of cosmogenic-nuclide exposure dating to glacier chronology, 1990 - 2010, Quat. Sci. Rev., 30, 3, 10.1016/j.quascirev.2010.11.003 · DOI
  3. Balco, 2014, Simple computer code for estimating cosmic-ray shielding by oddly shaped objects, Quat. Geochronol., 22, 175, 10.1016/j.quageo.2013.12.002 · DOI
  4. Balco, 2008, A complete and easily accessible means of calculating surface exposure ages or erosion rates from 10Be and 26Al measurements, Quat. Geochronol., 3, 174, 10.1016/j.quageo.2007.12.001 · DOI
  5. Barr, 2014, A review of topographic controls on moraine distribution, Geomorphology, 226, 44, 10.1016/j.geomorph.2014.07.030 · DOI
  6. Bell, 2008, Punctuated drainage of an ice-dammed quaternary lake in southern South America, Geogr. Ann.: Ser A Phys Geogr., 90, 1, 10.1111/j.1468-0459.2008.00330.x · DOI
  7. Bell, 2009, Quaternary lacustrine braid deltas on Lake General Carrera in southern Chile, Andean Geol., 36, 51
  8. Bendle, 2017, The glacial geomorphology of the lago Buenos Aires and lago pueyrredón ice lobes of central Patagonia, J. Maps, 13, 654, 10.1080/17445647.2017.1351908 · DOI
  9. Bendle, 2017, High-resolution chronology for deglaciation of the patagonian ice sheet at lago Buenos Aires (46.5°S) revealed through varve chronology and Bayesian age modelling, Quat. Sci. Rev., 177, 314, 10.1016/j.quascirev.2017.10.013 · DOI
  10. Benn, 1996, Subglacial and subaqueous processes near a glacier grounding line: sedimentological evidence from a former ice-dammed lake, Achnasheen Scotland, Boreas, 25, 23, 10.1111/j.1502-3885.1996.tb00832.x · DOI
  11. Boex, 2013, Rapid thinning of the late pleistocene patagonian ice sheet followed migration of the southern westerlies, Sci. Rep., 3, 2118, 10.1038/srep02118 · DOI
  12. Borrero, 2015, The process of human colonization of southern South America: migration, peopling and “the archaeology of place”, J. Anthropol. Archaeol., 38, 45, 10.1016/j.jaa.2014.09.006 · DOI
  13. Bourgois, 2016, Geomorphic records along the General Carrera (Chile)–Buenos Aires (Argentina) glacial lake (46°–48°S), climate inferences, and glacial rebound for the past 7–9 ka, J. Geol., 124, 27—53
  14. Breckenridge, 2013, An analysis of the late glacial lake levels within the western Lake Superior basin based on digital elevation models, Quat. Res., 80, 383, 10.1016/j.yqres.2013.09.001 · DOI
  15. Breckenridge, 2015, The Tintah-Campbell gap and implications for glacial Lake Agassiz drainage during the Younger Dryas cold interval, Quat. Sci. Rev., 117, 124, 10.1016/j.quascirev.2015.04.009 · DOI
  16. Bronk Ramsey, 2008, Deposition models for chronological records, Quat. Sci. Rev., 27, 42, 10.1016/j.quascirev.2007.01.019 · DOI
  17. Bronk Ramsey, 2009, Bayesian analysis of radiocarbon dates, Radiocarbon, 51, 337, 10.1017/S0033822200033865 · DOI · Paper page
  18. Brook, 2015, Evidence of the earliest humans in the southern Deseado massif (Patagonia, Argentina), mylodontidae, and changes in water availability, Quat. Int., 363, 107, 10.1016/j.quaint.2014.04.022 · DOI
  19. Caldenius, 1932, Las glaciaciones cuaternarios en la Patagonia y Tierra del Fuego, Geogr. Ann., 14, 1
  20. Carling, 2013, Freshwater megaflood sedimentation: what can we learn about generic processes?, Earth Sci. Rev., 125, 87, 10.1016/j.earscirev.2013.06.002 · DOI
  21. Carrivick, 2013, Proglacial lakes: character, behaviour and geological importance, Quat. Sci. Rev., 78, 34, 10.1016/j.quascirev.2013.07.028 · DOI · Paper page
  22. Cockburn, 2004, Geomorphological applications of cosmogenic isotope analysis, Prog. Phys. Geogr., 28, 1, 10.1191/0309133304pp395oa · DOI
  23. Condron, 2012, Meltwater routing and the younger Dryas, Proc. Natl. Acad. Sci. Unit. States Am., 909, 19928, 10.1073/pnas.1207381109 · DOI
  24. Dietrich, 2017, Reconstructing ic-margin retreat using delta morphostratigraphy, Sci. Rep., 7, 16936, 10.1038/s41598-017-16763-x · DOI
  25. Douglass, 2006, Cosmogenic nuclide surface exposure dating of boulders on last-glacial and late-glacial moraines, Lago Buenos Aires, Argentina: interpretive strategies and paleoclimate implications, Quat. Geochronol., 1, 43, 10.1016/j.quageo.2006.06.001 · DOI
  26. Dussaillant, 2012, Hydrological regime of remote catchments with extreme gradients under accelerated change: the Baker basin in Patagonia, Hydrol. Sci. J., 57, 530, 10.1080/02626667.2012.726993 · DOI
  27. Durcan, 2015, DRAC: dose rate and age calculator for trapped charge dating, Quat. Geochronol., 28, 54, 10.1016/j.quageo.2015.03.012 · DOI
  28. Evans, 2012, Stratigraphic architecture and sedimentology of a Late Pleistocene subaqueous moraine complex, southwest Ireland, J. Quat. Sci., 27, 51, 10.1002/jqs.1513 · DOI
  29. Fabel, 2010, Cosmogenic nuclide exposure ages from the ‘parallel roads’ of glen roy, scotland, J. Quat. Sci., 25, 597, 10.1002/jqs.1318 · DOI
  30. Gaiero, 2003, Iron and other transition metals in Patagonian riverborne and windborne materials: geochemical control and transport to the southern South Atlantic Ocean, Geochem. Cosmochim. Acta, 67, 3603, 10.1016/S0016-7037(03)00211-4 · DOI
  31. Galbraith, 1999, Optical dating of single and multiple grains of quartz from jinmium rock shelter, northern Australia: Part I, experimental design and statistical models, Archaeometry, 41, 339, 10.1111/j.1475-4754.1999.tb00987.x · DOI
  32. García, 2012, Glacier expansion in southern Patagonia throughout the antarctic cold reversal, Geology, 40, 859, 10.1130/G33164.1 · DOI
  33. García, 2014, Glacial geomorphology of the Torres del Paine region (southern Patagonia): implications for glaciation, deglaciation and paleolake history, Geomorphology, 204, 599, 10.1016/j.geomorph.2013.08.036 · DOI
  34. García, 2018, The MIS 3 maximum of the Torres del Paine and Última Esperanza ice lobes in Patagonia and the pacing of southern mountain glaciation, Quat. Sci. Rev., 185, 9, 10.1016/j.quascirev.2018.01.013 · DOI
  35. Glasser, 2005, Fast-flowing outlet glaciers of the last glacial maximum Patagonian Icefield, Quat. Res., 63, 206, 10.1016/j.yqres.2004.11.002 · DOI
  36. Glasser, 2008, The glacial map of southern South America, J. Maps, 4, 175, 10.4113/jom.2008.1020 · DOI
  37. Glasser, 2008, The glacial geomorphology and Pleistocene history of South America between 38°S and 56°S, Quat. Sci. Rev., 27, 365, 10.1016/j.quascirev.2007.11.011 · DOI
  38. Glasser, 2006, Evidence from the Rio Bayo Valley on the extent of the north patagonian icefield during the late pleistocene-holocene transition, Quat. Res., 65, 70, 10.1016/j.yqres.2005.09.002 · DOI
  39. Glasser, 2012, Younger Dryas and early Holocene age glacier advances in Patagonia, Quat. Sci. Rev., 58, 7, 10.1016/j.quascirev.2012.10.011 · DOI
  40. Glasser, 2016, Glacial lake drainage in Patagonia (13-8 kyr) and response of the adjacent Pacific Ocean, Sci. Rep., 6, 21064, 10.1038/srep21064 · DOI
  41. Gosse, 2001, Terrestrial in situ cosmogenic nuclides: theory and application, Quat. Sci. Rev., 20, 1475, 10.1016/S0277-3791(00)00171-2 · DOI
  42. Gu, 2017, Long-term vegetation, climate and ocean dynamics inferred from a 73,500 years old marine sediment core (GeoB2107-3) off southern Brazil, Quat. Sci. Rev., 172, 55, 10.1016/j.quascirev.2017.06.028 · DOI
  43. Hall, 2013, Extensive recession of Cordillera Darwin glaciers in southernmost South America during heinrich stadial 1, Quat. Sci. Rev., 62, 49, 10.1016/j.quascirev.2012.11.026 · DOI
  44. Henríquez, 2017, The last glacial termination on the eastern flank of the central Patagonian Andes (47°S), Clim. Past, 13, 879, 10.5194/cp-13-879-2017 · DOI
  45. Heyman, 2016, Boulder height – exposure age relationships from a global glacial 10Be compilation, Quat. Geochronol., 34, 1, 10.1016/j.quageo.2016.03.002 · DOI
  46. Hogg, 2013, SHCal13 Southern Hemisphere calibration, 0–50,000 years cal BP, Radiocarbon, 55, 1, 10.2458/azu_js_rc.55.16783 · DOI
  47. Hubbard, 2005, A modelling reconstruction of the last glacial maximum ice sheet and its deglaciation in the vicinity of the Northern Patagonian Icefield, South America, Geogr. Ann.: Ser A Phys Geogr., 87, 375, 10.1111/j.0435-3676.2005.00264.x · DOI
  48. Hudson, 2008, Flood management along the Lower Mississippi and Rhine Rivers (The Netherlands) and the continuum of geomorphic adjustment, Geomorphology, 101, 209, 10.1016/j.geomorph.2008.07.001 · DOI · Paper page
  49. Kaplan, 2011, In-situ cosmogenic 10Be production rate at Lago Argentino, Patagonia: implications for late-glacial climate chronology, Earth Planet Sci. Lett., 309, 21, 10.1016/j.epsl.2011.06.018 · DOI
  50. Lal, 1991, Cosmic ray labeling of erosion surfaces: in situ nuclide production rates and erosion models, Earth Planet Sci. Lett., 104, 424, 10.1016/0012-821X(91)90220-C · DOI
  51. Martin, 2017, Climate change, availability of territory, and late pleistocene human exploration of Ultima Esperanza, south Chile, Quat. Int., 428, 86, 10.1016/j.quaint.2015.06.023 · DOI
  52. Martinod, 2016, Geomorphic records along the general Carrera (Chile)–Buenos Aires (Argentina) glacial Lake (46°–48°S), climate inferences, and glacial rebound for the past 7–9 ka: a discussion, J. Geol., 124, 631
  53. Méndez, 2018, The initial peopling of Central Western Patagonia (southernmost South America): late Pleistocene through Holocene site context and archaeological assesmblages from Cueva de la Vieja site, Quat. Int., 473, 261, 10.1016/j.quaint.2017.07.014 · DOI · Paper page
  54. Mercer, 1976, Glacial history of southernmost South America, Quat. Res., 6, 125, 10.1016/0033-5894(76)90047-8 · DOI
  55. Moreno, 2009, Renewed glacial activity during the Antarctic Cold Reversal and persistence of cold conditions until 11.5 ka in southwestern Patagonia, Geology, 37, 375, 10.1130/G25399A.1 · DOI
  56. Moreno, 2015, Radiocarbon chronology of the last glacial maximum and its termination in northwestern Patagonia, Quat. Sci. Rev., 122, 233, 10.1016/j.quascirev.2015.05.027 · DOI
  57. Nimick, 2016, Latest pleistocene and Holocene glacial events in the Colonia valley, northern Patagonia icefield, southern Chile, J. Quat. Sci., 31, 551, 10.1002/jqs.2847 · DOI
  58. Nishiizumi, 2007, Absolute calibration of 10Be AMS standards, Nucl. Instrum. Methods Phys. Res. Sect. B Beam Interact. Mater. Atoms, 258, 403, 10.1016/j.nimb.2007.01.297 · DOI
  59. Palmer, 2017, Dynamic landscape changes in glen roy and vicinity, west highland scotland, during the younger Dryas and earyl Holocene: a synthesis, PGA (Proc. Geol. Assoc.), 128, 2, 10.1016/j.pgeola.2017.01.003 · DOI
  60. Pedro, 2016, Southern Ocean deep convection as a driver of Antarctic warming events, Geophys. Res. Lett., 43, 2192, 10.1002/2016GL067861 · DOI · Paper page
  61. Putkonen, 2003, Accuracy of cosmogenic ages for moraines, Quat. Res., 59, 255, 10.1016/S0033-5894(03)00006-1 · DOI
  62. Putnam, 2010, Glacier advance in southern middle-latitudes during the antarctic cold reversal, Nat. Geosci., 3, 700, 10.1038/ngeo962 · DOI
  63. Rebassa, 2011, Late Cenozoic glaciations in Patagonia and Tierra del Fuego: an updated review, Biol. J. Linn. Soc., 103, 316, 10.1111/j.1095-8312.2011.01681.x · DOI
  64. Sagredo, 2011, Fluctuations of the Última Esperanza ice lobe (52°S), Chilean Patagonia, during the last glacial maximum and termination 1, Geomorphology, 125, 92, 10.1016/j.geomorph.2010.09.007 · DOI
  65. Sagredo, 2018, Trans-pacific glacial response to the Antarctic Cold Reversal in the southern mid-latitudes, Quat. Sci. Rev., 189, 57
  66. Schaller, 2002, A 30 000 yr record of erosion rates from cosmogenic 10Be in Middle European river terraces, Earth Planet Sci. Lett., 204, 307, 10.1016/S0012-821X(02)00951-2 · DOI
  67. Smedley, 2016, Luminescence dating of glacial advances at lago Buenos Aires (∼46°S), Patagonia, Quat. Sci. Rev., 134, 59—73, 10.1016/j.quascirev.2015.12.010 · DOI
  68. Solari, 2012, Evolution of the Great Tehuleche Palaeolake in the Torres del Paine National Park of Chilean Patagonia during the Last Glacial Maximum and Holocene, Andean Geol., 39, 1
  69. Stern, 2011, Evolution of ice-dammed proglacial lakes in Última Esperanza, Chile: implications from the late-glacial RI eruption of Reclús volcano, Andean Austral Volcanic Zone, Andean Geol., 38, 82
  70. Stone, 2000, Air pressure and cosmogenic isotope production, J. Geophys. Res.: Solid Earth, 105, 23753, 10.1029/2000JB900181 · DOI · Paper page
  71. Turner, 2005, Deglaciation of the eastern flank of the north patagonian icefield and associated continental-scale lake diversions, Geogr. Ann.: Ser A Phys Geogr., 87, 363, 10.1111/j.0435-3676.2005.00263.x · DOI
  72. Vargas, 2011, Allochthonous subsidies of organic matter across a lake-river-fjord landcape in the Chilean Patagonia: implications for marine zooplankton in inner fjord áreas, Continent. Shelf Res., 31, 187, 10.1016/j.csr.2010.06.016 · DOI
  73. Villa-Martínez, 2012, Deglacial and postglacial vegetation changes on the eastern slopes of the central Patagonian Andes (47°S), Quat. Sci. Rev., 32, 86, 10.1016/j.quascirev.2011.11.008 · DOI
  74. WAIS Divide Project Members, 2013, Onset of deglacial warming in West Antarctica driven by local orbital forcing, Nature, 500, 440, 10.1038/nature12376 · DOI
  75. Weller, 2014, The large late-glacial Ho eruption of the Hudson volcano, southern Chile, Bull. Volcanol., 76, 831, 10.1007/s00445-014-0831-9 · DOI

Metadata

Authors
Thorndycraft, V. R., Bendle, J. M., Benito, G., Davies, B. J., Sancho, C., Palmer, A. P., Fabel, D., Medialdea, A., & Martin, J. R. V.
Venue
Quaternary Science Reviews
Publisher
Elsevier BV
Published
2019-01
Volume
203
Pages
102-127
ISSN
0277-3791
Cited by
70
References
2
Language
en
Funders
  • Natural Resources Defence Council
  • Royal Holloway University of London Research Strategy Fund (RHUL-RSF)
  • NERC (NE/L501803/1, NE/L002485/1)
  • RHUL-RSF
  • British Society for Geomorphology

About these checks

Registry, retraction, Cites and statistics results are computed, not judged, with one exception: a printed reference that no index lists is read once by a model before it counts as a citation error. Claims are extracted by a model and kept only when their quote appears verbatim in the text; each cited source is then checked, with a model’s help, for whether it says what the claim relies on. Those verdicts can be wrong — read the claim’s quote and the cited source before relying on one.

Statistics and arithmetic are recomputed, not judged.

Confidence bands are shown only for fields calibrated on our annotated test set. None is calibrated yet, so no band is shown.

What counts as a claim ›How we measure confidence ›How we check this ›

Are you an author, or do you see a problem with this page? Request a review

How to cite

Cite CoChat for the checks on this page, and the paper for its own findings.

This page
CoChat. (2026). Citation check: Glacial lake evolution and Atlantic-Pacific drainage reversals during deglaciation of the Patagonian Ice Sheet. https://app.cochat.ai/papers/10.1016/j.quascirev.2018.10.036
The paper
Thorndycraft, V. R., Bendle, J. M., Benito, G., Davies, B. J., Sancho, C., Palmer, A. P., Fabel, D., Medialdea, A., & Martin, J. R. V. (2019). Glacial lake evolution and Atlantic-Pacific drainage reversals during deglaciation of the Patagonian Ice Sheet. Quaternary Science Reviews. https://doi.org/10.1016/j.quascirev.2018.10.036