

The DOI matches its Crossref record; 37 of the 37 references it cites were found in a registry or an index.
Acellular Lung Scaffolds Direct Differentiation of Endoderm to Functional Airway Epithelial Cells: Requirement of Matrix-Bound HS Proteoglycans
Open accessAbstract
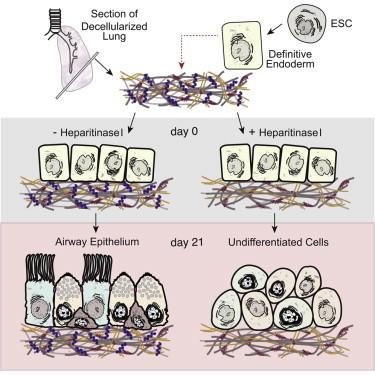
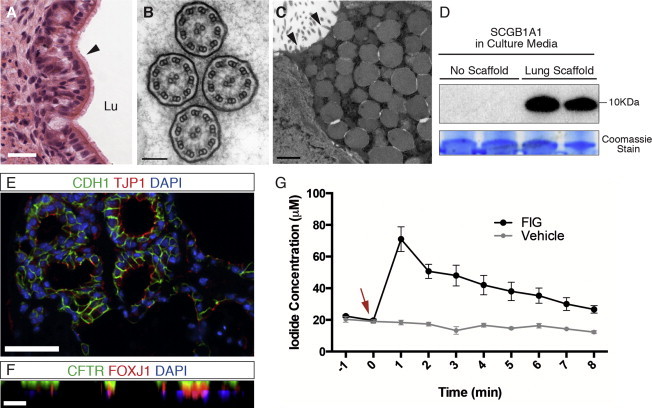
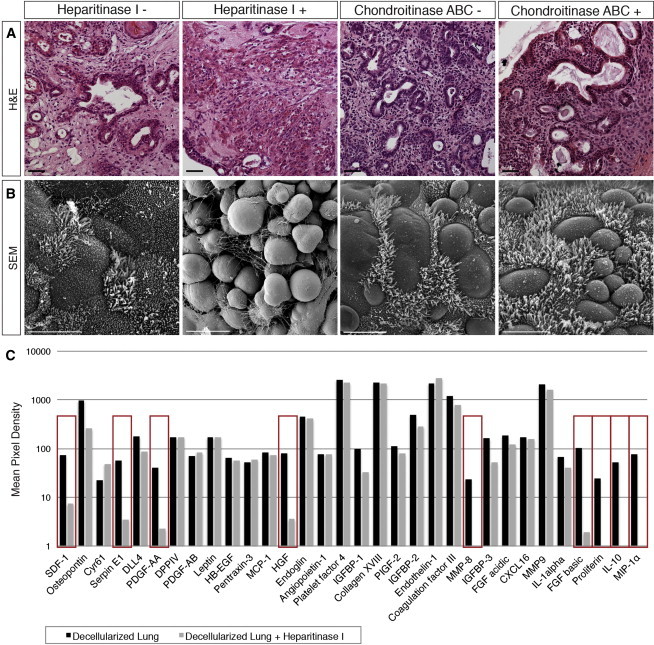
Efficient differentiation of pluripotent cells to proximal and distal lung epithelial cell populations remains a challenging task. The 3D extracellular matrix (ECM) scaffold is a key component that regulates the interaction of secreted factors with cells during development by often binding to and limiting their diffusion within local gradients. Here we examined the role of the lung ECM in differentiation of pluripotent cells in vitro and demonstrate the robust inductive capacity of the native lung matrix alone. Extended culture of stem cell-derived definitive endoderm on decellularized lung scaffolds in defined, serum-free medium resulted in differentiation into mature airway epithelia, complete with ciliated cells, club cells, and basal cells with morphological and functional similarities to native airways. Heparitinase I, but not chondroitinase ABC, treatment of scaffolds revealed that the differentiation achieved is dependent on heparan sulfate proteoglycans and its bound factors remaining on decellularized scaffolds.
Overview
The claims and statistics of this paper haven’t been checked yet.
Run the check — free, no account needed. It reads the open-access text and checks the sources it cites.
Integrity signals
Registry
Cites
Statistics
Figures
Verification
Claims the paper makes
The claims and statistics of this paper haven’t been checked yet.
Run the check — free, no account needed. It reads the open-access text and checks the sources it cites.
Claims other papers make about this one
Each is checked against this paper’s own text: does it say what the citing paper says it does?
In the citing paper
“Surface proteoglycans that are necessary for successful organoid formation may be removed by harsh decellularization121.”
From Towards organoid culture without Matrigel (2021) · cites this paper as [121]
Self-check
Percentages, sums and reported differences re-computed from the paper’s own numbers.
The self-check needs the paper’s full text.
Citations
Cites
The ground state of embryonic stem cell self-renewal
Ying, Q.-L., Wray, J., Nichols, J., Batlle-Morera, L., Doble, B., Woodgett, J., Cohen, P., & Smith, A. (2008) · Nature · doi:10.1038/nature06968 · Cited by 3,442
Growth Factors, Matrices, and Forces Combine and Control Stem Cells
Discher, D. E., Mooney, D. J., & Zandstra, P. W. (2009) · Science · doi:10.1126/science.1171643 · Cited by 2,666
Murry, C. E., & Keller, G. M. (2008) · Cell · doi:10.1016/j.cell.2008.02.008 · Cited by 1,760
Basal cells as stem cells of the mouse trachea and human airway epithelium
Rock, J. R., Onaitis, M. W., Rawlins, E. L., Lu, Y., Clark, C. P., Xue, Y., Randell, S. H., & Hogan, B. L. M. (2009) · Proceedings of the National Academy of Sciences · doi:10.1073/pnas.0906850106 · Cited by 1,591
Kimura, S., Hara, Y., Pineau, T., Fernández‐Salguero, P. M., Fox, C. H., Ward, J. M., & Gonzalez, F. J. (1996) · Genes & Development · doi:10.1101/gad.10.1.60 · Cited by 1,221
Tissue-Engineered Lungs for in Vivo Implantation
Petersen, T. H., Calle, E. A., Zhao, L., Lee, E. J., Gui, L., Raredon, M. S. B., Gavrilov, K., Yi, T., Zhuang, Z. W., Breuer, C. K., et al. (2010) · Science · doi:10.1126/science.1189345 · Cited by 1,189
Regeneration and orthotopic transplantation of a bioartificial lung
Ott, H. C., Clippinger, B., Conrad, C., Schuetz, C., Pomerantseva, I., Ikonomou, L., Kotton, D., & Vacanti, J. P. (2010) · Nature Medicine · doi:10.1038/nm.2193 · Cited by 1,090
Extracellular matrix dynamics in development and regenerative medicine
Daley, W. P., Peters, S. B., & Larsen, M. (2008) · Journal of Cell Science · doi:10.1242/jcs.006064 · Cited by 1,006
Development of definitive endoderm from embryonic stem cells in culture
Kubo, A., Shinozaki, K., Shannon, J. M., Kouskoff, V., Kennedy, M., Woo, S. L. C., Fehling, H. J., & Keller, G. M. (2004) · Development · doi:10.1242/dev.01044 · Cited by 830
Vertebrate Endoderm Development and Organ Formation
Zorn, A. M., & Wells, J. M. (2009) · Annual Review of Cell and Developmental Biology · doi:10.1146/annurev.cellbio.042308.113344 · Cited by 812
Cited by
Sorted by citations
Extracellular matrix-based materials for regenerative medicine
Hussey, G. S., Dziki, J. L., & Badylak, S. F. (2018) · Nature Reviews Materials · doi:10.1038/s41578-018-0023-x · Cited by 844
Bioprinting for vascular and vascularized tissue biofabrication
Datta, P., Ayan, B., & Ozbolat, I. T. (2017) · Acta Biomaterialia · doi:10.1016/j.actbio.2017.01.035 · Cited by 431
Towards organoid culture without Matrigel
Kozlowski, M. T., Crook, C. J., & Ku, H. T. (2021) · Communications Biology · doi:10.1038/s42003-021-02910-8 · Cited by 409
Konishi, S., Gotoh, S., Tateishi, K., Yamamoto, Y., Korogi, Y., Nagasaki, T., Matsumoto, H., Muro, S., Hirai, T., Ito, I., et al. (2015) · Stem Cell Reports · doi:10.1016/j.stemcr.2015.11.010 · Cited by 248
Extracellular Matrix-Based Biomaterials and Their Influence Upon Cell Behavior
Cramer, M. C., & Badylak, S. F. (2020) · Annals of Biomedical Engineering · doi:10.1007/s10439-019-02408-9 · Cited by 196
Dye, B. R., Dedhia, P. H., Miller, A. J., Nagy, M. S., White, E. S., Shea, L. D., & Spence, J. R. (2016) · eLife · doi:10.7554/elife.19732 · Cited by 197
Controlling stem cell behavior with decellularized extracellular matrix scaffolds
Roth, G. A., & Christman, K. L. (2016) · Current Opinion in Solid State and Materials Science · doi:10.1016/j.cossms.2016.02.001 · Cited by 191
Decellularization for the retention of tissue niches
Moffat, D., Ye, K., & Jin, S. (2022) · Journal of Tissue Engineering · doi:10.1177/20417314221101151 · Cited by 152
Functional role of glycosaminoglycans in decellularized lung extracellular matrix
Uhl, F. E., Zhang, F., Pouliot, R. A., Uriarte, J. J., Enes, S. R., Han, X., Ouyang, Y., Xia, K., Westergren‐Thorsson, G., Malmström, A., et al. (2019) · Acta Biomaterialia · doi:10.1016/j.actbio.2019.11.029 · Cited by 118
The Extracellular Matrix in Bronchopulmonary Dysplasia: Target and Source
Mižíková, I., & Morty, R. E. (2015) · Frontiers in Medicine · doi:10.3389/fmed.2015.00091 · Cited by 96
Tissue Engineering and Regenerative Medicine 2015: A Year in Review
Wobma, H., & Vunjak‐Novakovic, G. (2015) · Tissue Engineering Part B Reviews · doi:10.1089/ten.teb.2015.0535 · Cited by 92
The extracellular matrix of the gastrointestinal tract: a regenerative medicine platform
Hussey, G. S., Keane, T. J., & Badylak, S. F. (2017) · Nature Reviews Gastroenterology & Hepatology · doi:10.1038/nrgastro.2017.76 · Cited by 88
Zvarova, B., Uhl, F. E., Uriarte, J. J., Borg, Z. D., Coffey, A. L., Bonenfant, N. R., Weiss, D. J., & Wagner, D. E. (2016) · Tissue Engineering Part C Methods · doi:10.1089/ten.tec.2015.0439 · Cited by 92
Nano-Therapeutics for the Lung: State-of-the-Art and Future Perspectives
Iyer, R., Hsia, C. C. W., & Nguyen, K. T. (2015) · Current Pharmaceutical Design · doi:10.2174/1381612821666150923095742 · Cited by 78
Long-term cryopreservation of decellularised oesophagi for tissue engineering clinical application
Urbani, L., Maghsoudlou, P., Milan, À., Menikou, M., Hagen, C. K., Totonelli, G., Camilli, C., Eaton, S. D., Burns, A. J., Olivo, A., et al. (2017) · PLoS ONE · doi:10.1371/journal.pone.0179341 · Cited by 66
How to build a lung: latest advances and emerging themes in lung bioengineering
Santis, M. M. D., Bölükbas, D. A., Lindstedt, S., & Wagner, D. E. (2018) · European Respiratory Journal · doi:10.1183/13993003.01355-2016 · Cited by 62
Reproducible extracellular matrices for tumor organoid culture: challenges and opportunities
Li, K., He, Y., Jin, X., Jin, K., & Qian, J. (2025) · Journal of Translational Medicine · doi:10.1186/s12967-025-06349-x · Cited by 76
Novel detergent for whole organ tissue engineering
Kawasaki, T., Kirita, Y., Kami, D., Kitani, T., Ozaki, C., Itakura, Y., Toyoda, M., & Gojo, S. (2015) · Journal of Biomedical Materials Research Part A · doi:10.1002/jbm.a.35474 · Cited by 61
Revascularization of decellularized lung scaffolds: principles and progress
Stabler, C. T., Lecht, S., Mondrinos, M. J., Goulart, E., Lazarovici, P., & Lelkes, P. I. (2015) · American Journal of Physiology-Lung Cellular and Molecular Physiology · doi:10.1152/ajplung.00237.2015 · Cited by 61
Autophagy is required for lung development and morphogenesis
Yeganeh, B. Y., Lee, J., Ermini, L., Lok, I., Ackerley, C. A., & Post, M. (2019) · Journal of Clinical Investigation · doi:10.1172/jci127307 · Cited by 55
Self-citationUllah, I., Busch, J. F., Rabien, A., Ergün, B., Stamm, C., Knosalla, C., Hippenstiel, S., Reinke, P., & Kurtz, A. (2020) · Advanced Science · doi:10.1002/advs.201901198 · Cited by 51
Ullah, I., Abu‐Dawud, R., Busch, J. F., Rabien, A., Erguen, B., Fischer, I., Reinke, P., & Kurtz, A. (2019) · Biomaterials · doi:10.1016/j.biomaterials.2019.119283 · Cited by 50
Alveolar-like Stem Cell–derived Myb − Macrophages Promote Recovery and Survival in Airway Disease
Litvack, M. L., Wigle, T. J., Lee, J., Wang, J., Ackerley, C. A., Grunebaum, E., & Post, M. (2016) · American Journal of Respiratory and Critical Care Medicine · doi:10.1164/rccm.201509-1838oc · Cited by 46
Self-citationPlatz, J. J., Bonenfant, N. R., Uhl, F. E., Coffey, A. L., McKnight, T., Parsons, C. S., Sokocevic, D., Borg, Z. D., Lam, Y., Deng, B., et al. (2016) · Tissue Engineering Part C Methods · doi:10.1089/ten.tec.2016.0109 · Cited by 45
Prieto, C., López‐Millán, B., Roca-Ho, H., Stam, R. W., Romero–Moya, D., Rodríguez‐Baena, F. J., Sanjuán-Pla, A., Ayllón, V., Ramírez, M. R., Bardini, M., et al. (2017) · Leukemia · doi:10.1038/leu.2017.294 · Cited by 43
Bioprinting of artificial blood vessels
Ng, H. Y., Lee, K.-X. A., Kuo, C. N., & Shen, Y. (2018) · International Journal of Bioprinting · doi:10.18063/ijb.v4i2.140 · Cited by 46
Lung bioengineering: advances and challenges in lung decellularization and recellularization
Uriarte, J. J., Uhl, F. E., Enes, S. R., Pouliot, R. A., & Weiss, D. J. (2018) · Current Opinion in Organ Transplantation · doi:10.1097/mot.0000000000000584 · Cited by 43
Trevisan, C., Maghin, E., Dedja, A., Caccin, P., de Cesare, N., Franzin, C., Boso, D., Pesce, P., Caicci, F., Boldrin, F., et al. (2019) · Acta Biomaterialia · doi:10.1016/j.actbio.2019.03.007 · Cited by 40
Júnior, C., Ulldemolins, A., Narciso, M., Almendros, I., Farré, R., Navajas, D., Alonso, J. L., Eroles, M., Rico, F., & Gavara, N. (2023) · International Journal of Molecular Sciences · doi:10.3390/ijms24021708 · Cited by 40
Bilodeau, C., Shojaie, S., Goltsis, O., Wang, J., Luo, D., Ackerley, C. A., Rogers, I. M., Cox, B., & Post, M. (2021) · npj Regenerative Medicine · doi:10.1038/s41536-021-00124-4 · Cited by 37
Self-citationTan, C. L., Chan, Y., Candasamy, M., Chellian, J., Madheswaran, T., Sakthivel, L. P., Patel, V. K., Chakraborty, A., MacLoughlin, R. J., Kumar, D., et al. (2022) · European Journal of Pharmacology · doi:10.1016/j.ejphar.2022.174821 · Cited by 38
Limitations of recellularized biological scaffolds for human transplantation
Bilodeau, C., Goltsis, O., Rogers, I. M., & Post, M. (2019) · Journal of Tissue Engineering and Regenerative Medicine · doi:10.1002/term.3004 · Cited by 35
Self-citationUltrasonic cavitation to prepare ECM hydrogels
Hussey, G. S., Nascari, D. G., Saldin, L. T., Kolich, B., Lee, Y. C., Crum, R. J., El-Mossier, S. O., D’Angelo, W., Dziki, J. L., & Badylak, S. F. (2020) · Acta Biomaterialia · doi:10.1016/j.actbio.2020.03.036 · Cited by 35
Ultrasound in cellulose-based hydrogel for biomedical use: From extraction to preparation
Liu, Y., Li, S., Wang, Z., & Wang, L. (2022) · Colloids and Surfaces B Biointerfaces · doi:10.1016/j.colsurfb.2022.112368 · Cited by 36
A novel decellularization method to produce brain scaffolds
Granato, A. E. C., da Cruz, E. F., Rodrigues‐Junior, D. M., Mosini, A. C., Ulrich, H., Rodrigues, B. V. M., Cheffer, A., & Porcionatto, M. A. (2020) · Tissue and Cell · doi:10.1016/j.tice.2020.101412 · Cited by 33
Sambi, M., Chow, T., Whiteley, J., Li, M., Chua, S. J., Raileanu, V., & Rogers, I. M. (2017) · Stem Cell Reviews and Reports · doi:10.1007/s12015-016-9712-2 · Cited by 33
Self-citationLaminin-driven Epac/Rap1 regulation of epithelial barriers on decellularized matrix
Young, B. M., Shankar, K., Tho, C. K., Pellegrino, A. R., & Heise, R. L. (2019) · Acta Biomaterialia · doi:10.1016/j.actbio.2019.10.009 · Cited by 33
Chiu, Y., Shen, Y., Lee, A. K.-X., Lin, S.-H., Wu, Y.-C., & Chen, Y. (2019) · Polymers · doi:10.3390/polym11091394 · Cited by 30
Signaling involved in stem cell reprogramming and differentiation.
Tanabe, S. (2015) · PubMed Central · doi:10.4252/wjsc.v7.i7.992 · Cited by 29
Bongolan, T., Whiteley, J., Castillo-Prado, J., Fantin, A., Larsen, B. G., Wong, C. J., Mazilescu, L., Kawamura, M., Urbanellis, P., Jonebring, A., et al. (2022) · Biomaterials Science · doi:10.1039/d1bm01017d · Cited by 28
Self-citationUtilization of Natural Detergent Potassium Laurate for Decellularization in Lung Bioengineering
Obata, T., Tsuchiya, T., Akita, S., Kawahara, T., Matsumoto, K., Miyazaki, T., Masumoto, H., Kobayashi, E., Niklason, L. E., & Nagayasu, T. (2019) · Tissue Engineering Part C Methods · doi:10.1089/ten.tec.2019.0016 · Cited by 27
Cardiac organoids: a new tool for disease modeling and drug screening applications
Yaqinuddin, A., Jabri, A., Mhannayeh, A., Taftafa, B., Alsharif, M., Abbad, T., Khan, J. A., Elsalti, A., Chinnappan, R., Alshehri, E. A., et al. (2025) · Frontiers in Cardiovascular Medicine · doi:10.3389/fcvm.2025.1537730 · Cited by 29
Okuyama, H., Ohnishi, H., Nakamura, R., Yamashita, M., Kishimoto, Y., Tateya, I., Suehiro, A., Gotoh, S., Takezawa, T., Nakamura, T., et al. (2019) · Journal of Tissue Engineering and Regenerative Medicine · doi:10.1002/term.2849 · Cited by 25
Leibel, S. L., & Post, M. (2016) · Frontiers in Pediatrics · doi:10.3389/fped.2016.00036 · Cited by 24
Self-citationInduced pluripotent stem cells for treating cystic fibrosis: State of the science
Pollard, B. S., & Pollard, H. B. (2018) · Pediatric Pulmonology · doi:10.1002/ppul.24118 · Cited by 23
Reconstituting Mouse Lungs with Conditionally Reprogrammed Human Bronchial Epithelial Cells
LaRanger, R., Peters‐Hall, J. R., Coquelin, M. L., Alabi, B. R., Chen, C. T., Wright, W. E., & Shay, J. W. (2017) · Tissue Engineering Part A · doi:10.1089/ten.tea.2017.0114 · Cited by 23
Shakir, S., Hackett, T., & Mostaço-Guidolin, L. B. (2022) · Frontiers in Bioengineering and Biotechnology · doi:10.3389/fbioe.2022.1011800 · Cited by 24
Hoffman, E. T., Song, Y., Zhang, F., Asarian, L., Downs, I., Young, B., Han, X., Ouyang, Y., Xia, K., Linhardt, R. J., et al. (2023) · Acta Biomaterialia · doi:10.1016/j.actbio.2023.06.043 · Cited by 26
State of the art on lung organoids in mammals
Archer, F., Erny, A., & Gomes, M. (2021) · Veterinary Research · doi:10.1186/s13567-021-00946-6 · Cited by 21
Chan, W. S., Mo, X.-T., Ip, P. P. C., & Tse, K. Y. (2023) · Cancer Medicine · doi:10.1002/cam4.6521 · Cited by 20
Ngan, S. Y., Quach, H. T., Laselva, O., Huang, E. N., Mangos, M., Xia, S., Bear, C. E., & Wong, A. P. (2022) · Current Protocols · doi:10.1002/cpz1.341 · Cited by 17
Self-citationThe long and winding road: stem cells for cystic fibrosis
Conese, M., Beccia, E., Castellani, S., Di Gioia, S., Colombo, C., Angiolillo, A., & Carbone, A. (2018) · Expert Opinion on Biological Therapy · doi:10.1080/14712598.2018.1413087 · Cited by 15
Lack of immunogenicity of xenogeneic DNA from porcine biomaterials
Record Ritchie, R. D., Salmon, S. L., Hiles, M. C., & Metzger, D. W. (2022) · Surgery Open Science · doi:10.1016/j.sopen.2022.07.005 · Cited by 16
Image-Based Method to Quantify Decellularization of Tissue Sections
Narciso, M., Otero, J., Navajas, D., Farré, R., Almendros, I., & Gavara, N. (2021) · International Journal of Molecular Sciences · doi:10.3390/ijms22168399 · Cited by 16
Explant Culture for Studying Lung Development
Yeganeh, B., Bilodeau, C., & Post, M. (2018) · Methods in molecular biology · doi:10.1007/978-1-0716-5126-1_6 · Cited by 15
Self-citationAdvanced single-cell technologies to guide the development of bioengineered lungs
Wanczyk, H., Jensen, T., Weiss, D. J., & Finck, C. M. (2021) · American Journal of Physiology-Lung Cellular and Molecular Physiology · doi:10.1152/ajplung.00089.2021 · Cited by 16
Singh, G., Senapati, S., Satpathi, S., Behera, P. K., Das, B., & Nayak, B. (2022) · The FASEB Journal · doi:10.1096/fj.202200807r · Cited by 15
Bölükbas, D. A., Santis, M. M. D., Alsafadi, H. N., Doryab, A., & Wagner, D. E. (2019) · Methods in molecular biology · doi:10.1007/978-1-4939-9086-3_20 · Cited by 15
Options for modeling the respiratory system: inserts, scaffolds and microfluidic chips
Sedláková, V., Kloučková, M., Garlíková, Z., Vašíčková, K., Jaroš, J., Kandra, M., Kotasová, H., & Hampl, A. (2019) · Drug Discovery Today · doi:10.1016/j.drudis.2019.03.006 · Cited by 17
Hedström, U., Öberg, L., Vaarala, O., Dellgren, G., Silverborn, M., Bjermer, L. H., Westergren‐Thorsson, G., Hällgren, O., & Zhou, X. (2021) · American Journal of Respiratory Cell and Molecular Biology · doi:10.1165/rcmb.2019-0395oc · Cited by 18
Organ-specific ECM arrays for investigating cell-ECM interactions during stem cell differentiation
Goh, S.-K., Halfter, W. M., Richardson, T., Bertera, S., Vaidya, V., Candiello, J. E., Bradford, M., & Banerjee, I. (2020) · Biofabrication · doi:10.1088/1758-5090/abc05f · Cited by 13
Calle, E. A., Leiby, K. L., Raredon, M. S. B., & Niklason, L. E. (2016) · Current Opinion in Anaesthesiology · doi:10.1097/aco.0000000000000425 · Cited by 13
Goh, S.-K., Bertera, S., Vaidya, V., Dumpe, S., Barner, S., Mathew, S., & Banerjee, I. (2018) · TECHNOLOGY · doi:10.1142/s2339547818500085 · Cited by 13
Ozcebe, S. G., Tristan, M., & Zorlutuna, P. (2025) · Stem Cells · doi:10.1093/stmcls/sxaf005 · Cited by 16
Conversion of human and mouse fibroblasts into lung-like epithelial cells
Wong, A. P., Shojaie, S., Liang, Q., Xia, S., Paola, M. D., Ahmadi, S., Bilodeau, C., Garner, J., Post, M., Duchesneau, P., et al. (2019) · Scientific Reports · doi:10.1038/s41598-019-45195-y · Cited by 12
Self-citationSzulc, D. A., Ahmadipour, M., Aoki, F. G., Waddell, T. K., Karoubi, G., & Cheng, H. M. (2019) · Magnetic Resonance in Medicine · doi:10.1002/mrm.28072 · Cited by 13
Noori, A., Dezfouli, M. R. M., Rajabi, S., Ganji, F., Ghezelayagh, Z., Agha, E. E., Baharvand, H., Chaleshtori, S. S., & Tahamtani, Y. (2023) · PubMed Central · doi:10.22074/cellj.2023.563370.1148 · Cited by 12
Goh, S.-K., Bertera, S., Richardson, T., & Banerjee, I. (2023) · Biomedical Materials · doi:10.1088/1748-605x/acb7bf · Cited by 11
Decellularizing and Recellularizing Adult Mouse Kidneys
Chow, T., Whiteley, J., & Rogers, I. M. (2019) · Methods in molecular biology · doi:10.1007/978-1-4939-9021-4_15 · Cited by 9
Self-citationGharenaz, N. M., Movahedin, M., & Mazaheri, Z. (2021) · International Journal of Reproductive BioMedicine (IJRM) · doi:10.18502/ijrm.v19i4.9058 · Cited by 9
Emerging Paradigms in Bioengineering the Lungs
Mohgan, R., Candasamy, M., Mayuren, J., Singh, S. K., Gupta, G., Dua, K., & Chellappan, D. K. (2022) · Bioengineering · doi:10.3390/bioengineering9050195 · Cited by 9
Influence of mesenchymal and biophysical components on distal lung organoid differentiation
Goltsis, O., Bilodeau, C., Wang, J., Luo, D., Asgari, M., Bozec, L., Pettersson, A. B. V., Leibel, S. L., & Post, M. (2024) · Stem Cell Research & Therapy · doi:10.1186/s13287-024-03890-2 · Cited by 8
Self-citationGeneration of ESC-derived Mouse Airway Epithelial Cells Using Decellularized Lung Scaffolds
Shojaie, S., Lee, J., Wang, J., Ackerley, C. A., & Post, M. (2016) · Journal of Visualized Experiments · doi:10.3791/54019 · Cited by 8
Self-citationCurrent Status of Bioprinting Using Polymer Hydrogels for the Production of Vascular Grafts
Matějková, J., Kaňoková, D., & Matějka, R. (2024) · Gels · doi:10.3390/gels11010004 · Cited by 7
Decellularized diseased tissues: current state‐of‐the‐art and future directions
Li, X., Shan, J., Chen, X., Cui, H., Wen, G., & Yu, Y. (2023) · MedComm · doi:10.1002/mco2.399 · Cited by 8
Tissue Engineering of the Trachea: What is the Hold-up?
Siddiqi, S. (2017) · MOJ Cell Science & Report · doi:10.15406/mojcsr.2017.04.00076 · Cited by 7
Granath, C., Noren, H., Björck, H. M., Simon, N. L., Olesen, K., Rodin, S., Grinnemo, K., & Österholm, C. (2020) · BioResearch open access · doi:10.1089/biores.2020.0018 · Cited by 7
Yang, X., Zhao, Y., Liu, W., Gao, Z., Wang, C., Wang, C., Li, S., & Zhang, X. (2024) · Biophysics Reports · doi:10.52601/bpr.2024.240011 · Cited by 6
Santis, M. M. D., Michielin, F., Shibuya, S., Coppi, P. D., & Wagner, D. E. (2021) · European Respiratory Society eBooks · doi:10.1183/2312508x.10011020 · Cited by 5
Adult Human Heart ECM Improves Human iPSC-CM Function via Mitochondrial and Metabolic MaturationPreprint
Ozcebe, S. G., Tristan, M., & Zorlutuna, P. (2023) · bioRxiv (Cold Spring Harbor Laboratory) · doi:10.1101/2023.10.31.565062 · Cited by 5
Sabetkish, S., & Kajbafzadeh, A. M. (2021) · Advances in experimental medicine and biology · doi:10.1007/978-3-030-82735-9_4 · Cited by 3
The Extracellular Matrix in Development
Shojaie, S., Leibel, S. L., & Post, M. (2016) · Elsevier eBooks · doi:10.1016/b978-0-323-35214-7.00005-6 · Cited by 3
Self-citationEngineering Bioartificial Lungs for Transplantation
Wu, T., Economopoulos, K. P., & Ott, H. C. (2017) · Current Stem Cell Reports · doi:10.1007/s40778-017-0082-8 · Cited by 4
Regenerative Medicine of the Respiratory Tract
Gilpin, S. E., Moser, P. T., & Ott, H. C. (2018) · Elsevier eBooks · doi:10.1016/b978-0-12-809880-6.00060-6 · Cited by 2
Spatiotemporal Extracellular Matrix Modeling forin SituCell Niche Studies
Olesen, K., Rodin, S., Mak, W. C., Felldin, U., Österholm, C., Tilevik, A., & Grinnemo, K.-H. (2021) · Stem Cells · doi:10.1002/stem.3448 · Cited by 1
Méthodes alternatives in vitro pour l’étude des interactions hôte-pathogène du poumon
Rémot, A., Descamps, D., Erny, A., Chottin, C., Drajac, C., Carreras, F., Ferret, C., & Archer, F. (2023) · INRAE Productions Animales · doi:10.20870/productions-animales.2023.36.2.7574 · Cited by 1
Development and Bioengineering of Lung Regeneration
Wilson, A. A., & Ikonomou, L. (2017) · Springer eBooks · doi:10.1007/978-981-10-3768-9_13 · Cited by 1
Bioprinting of vascularized tissues
Wu, Y. B., Fuh, J. Y. H., & Ozbolat, I. T. (2023) · Elsevier eBooks · doi:10.1016/b978-0-12-824291-9.00005-1 · Cited by 1
Chemical approaches to stem cell and signaling pathways for therapeutics
Paul, S., & Majhi, A. (2023) · Elsevier eBooks · doi:10.1016/b978-0-443-13212-4.00030-1 · Cited by 1
Mesenchymal Stromal Cell Therapy for Thoracic Surgeons: An Update
Petrella, F., Cassina, E. M., Libretti, L., Pirondini, E., Raveglia, F., & Tuoro, A. (2023) · Journal of Personalized Medicine · doi:10.3390/jpm13121632 · Cited by 1
Design and development of miRNA and stem cell based micro/nano systems as lung disease therapy
Alhasan, L. (2016) · RMIT Research Repository (RMIT University Library) · doi:10.25439/rmt.27582078
Regenerating the Respiratory Tract
Lim, M. L., Firsova, A. B., Feliu, N., Kuevda, E. V., Jungebluth, P., & Macchiarini, P. (2015) · Stem cell biology and regenerative medicine · doi:10.1007/978-3-319-21082-7_17
Tissue Engineering Architectural Cues for in vitro Models of Respiratory Epithelium
Poon, J. C. H. (2018) · TSpace (University of Toronto)
Stem cell-driven tissue engineering in lung engineering, regeneration, and diseases
El-Hashash, A. H. K. (2021) · Elsevier eBooks · doi:10.1016/b978-0-12-821206-6.00008-4
Fantin, A. (2020) · TSpace (University of Toronto)
A Maverick Review of Common Stem/Progenitor Markers in Lung Development
Lin, Y., Wang, D., & Zeng, Y. (2022) · Stem Cell Reviews and Reports · doi:10.1007/s12015-022-10422-z
Modeling Lung Development and Diseases with Lung OrganoidsPreprint
Zhou, L., Liu, D., Wei, J., Zhu, X., & Jiang, L. (2023) · SSRN Electronic Journal · doi:10.2139/ssrn.4581586
Ahmadipour, M., Castillo-Prado, J., Hakak‐Zargar, B., Mahmood, M. Q., & Rogers, I. M. (2024) · Biotechnology and Bioengineering · doi:10.1002/bit.28754
Self-citationAdult stem cells in regenerative medicine of respiratory system
Yaghoubi, A., Nazarnezhad, S., Asgharzadeh, F., Saeinasab, M., & Sefat, F. (2025) · Elsevier eBooks · doi:10.1016/b978-0-443-34152-6.00008-1
Metadata
- Authors
- Shojaie, S., Ermini, L., Ackerley, C., Wang, J., Chin, S., Yeganeh, B., Bilodeau, M., Sambi, M., Rogers, I., Rossant, J., Bear, C. E., & Post, M.
- Affiliations
- University of Toronto (CA)
- Hospital for Sick Children (CA)
- Mount Sinai Hospital (CA)
- Corresponding author
- Post, Martin
- ORCID
- Venue
- Stem Cell Reports
- Publisher
- Elsevier BV
- Published
- 2015-03
- Volume
- 4
- Issue
- 3
- Pages
- 419-430
- ISSN
- 2213-6711 (ISSN-L)
- PMC
- PMC4375883
- OpenAlex
- W2012377092
- Cited by
- 102
- References
- 37
- Citations by year
- 2026: 1 · 2025: 4 · 2024: 4 · 2023: 12 · 2022: 10 · 2021: 11 · 2020: 7 · 2019: 15 · 2018: 9 · 2017: 10 · 2016: 11 · 2015: 8
- FWCI
- 12.75
- Type
- journal article
- Language
- en
- Open access
- gold
- doi.org
- Licence
- Locations
- Stem Cell Reports (publishedVersion, cc-by-nc-nd)
- Europe PMC (PubMed Central) (publishedVersion, cc-by-nc-nd)
- PubMed Central (publishedVersion, cc-by-nc-nd)
- PubMed (publishedVersion)
- DOAJ (DOAJ: Directory of Open Access Journals) (submittedVersion, cc-by-sa)
- Use Siena air (University of Siena) (submittedVersion, other-oa)
- Topics
- Health Sciences › Medicine › Surgery › Tissue Engineering and Regenerative Medicine
- Life Sciences › Biochemistry, Genetics and Molecular Biology › Molecular Biology › Pluripotent Stem Cells Research
- Physical Sciences › Engineering › Biomedical Engineering › 3D Printing in Biomedical Research
- Keywords
- decellularized lung scaffolds, airway epithelial differentiation, definitive endoderm, heparan sulfate proteoglycans, extracellular matrix, ciliated cells, Clara cells, basal cells, stem cell differentiation, lung development, serum-free medium
- MeSH terms
- Thyroid Nuclear Factor 1, Animals, Cell Differentiation, Cells, Cultured, Endoderm, Epithelial Cells, Extracellular Matrix, Lung, Mice, Transgenic, Nuclear Proteins, Protein Binding, Stem Cells, Transcription Factors, Cystic Fibrosis Transmembrane Conductance Regulator, Cell Lineage, Heparan Sulfate Proteoglycans, Respiratory Mucosa, Mice, SOXB1 Transcription Factors, Alveolar Epithelial Cells
About these checks
Registry, retraction, Cites and statistics results are computed, not judged, with one exception: a printed reference that no index lists is read once by a model before it counts as a citation error. Claims are extracted by a model and kept only when their quote appears verbatim in the text; each cited source is then checked, with a model’s help, for whether it says what the claim relies on. Those verdicts can be wrong — read the claim’s quote and the cited source before relying on one.
Statistics and arithmetic are recomputed, not judged.
Confidence bands are shown only for fields calibrated on our annotated test set. None is calibrated yet, so no band is shown.
What counts as a claim ›How we measure confidence ›How we check this ›
Are you an author, or do you see a problem with this page? Request a review
