

The DOI matches its Crossref record; 27 of the 27 references it cites were found in a registry or an index.
Isogenic FUS-eGFP iPSC Reporter Lines Enable Quantification of FUS Stress Granule Pathology that Is Rescued by Drugs Inducing Autophagy
Open accessAbstract
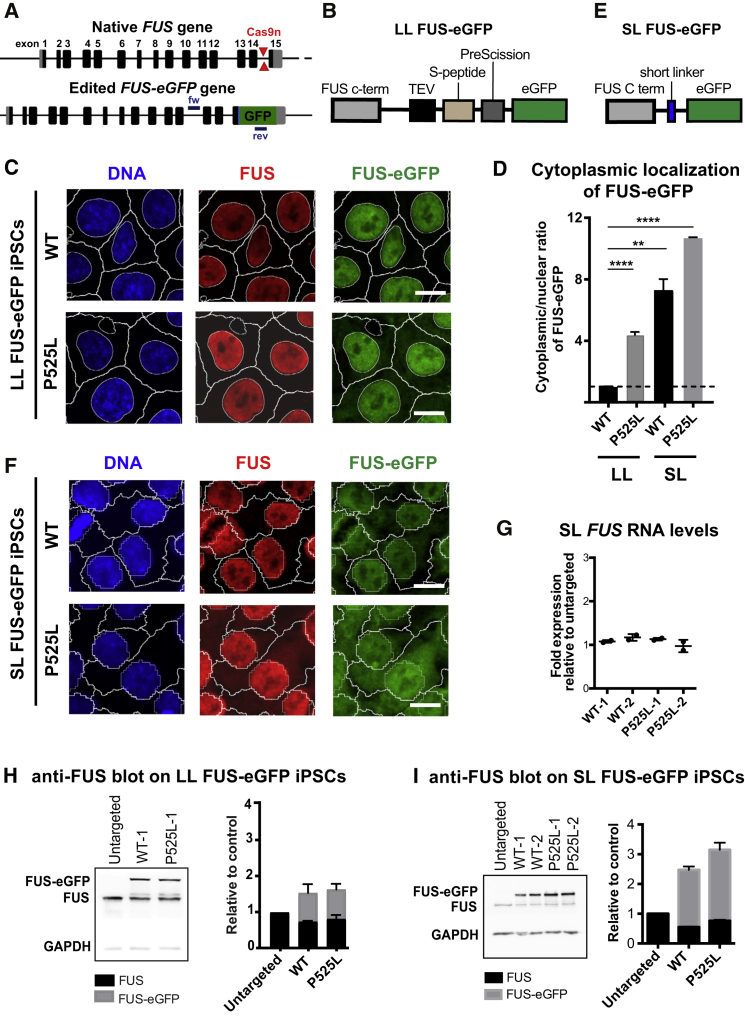
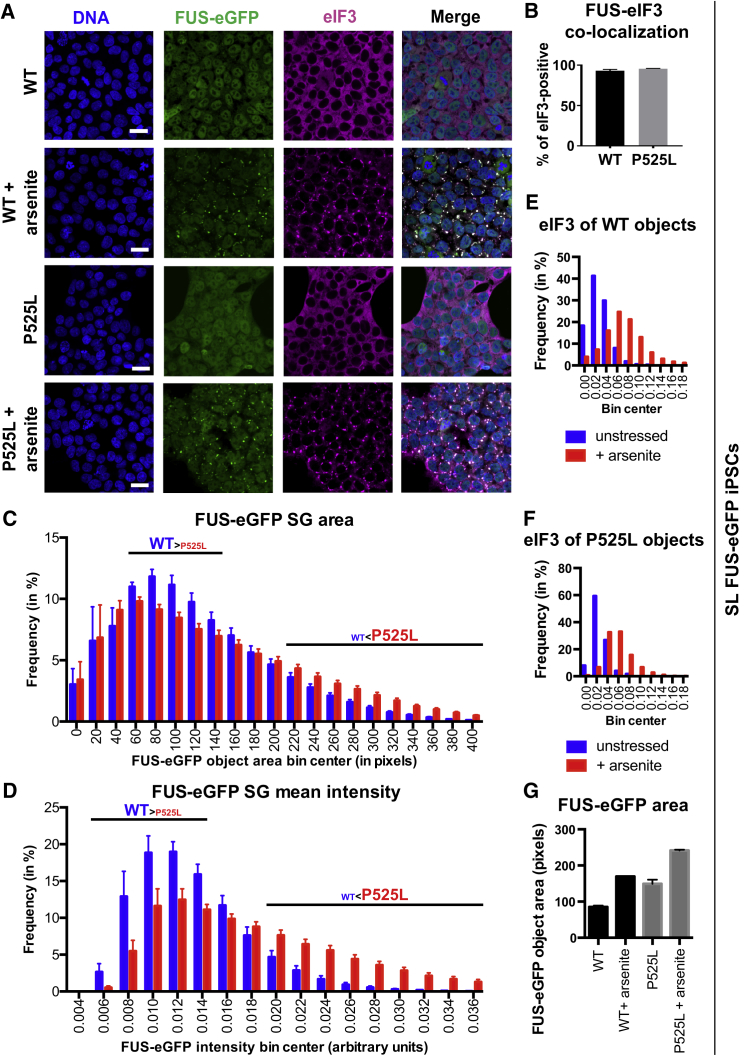
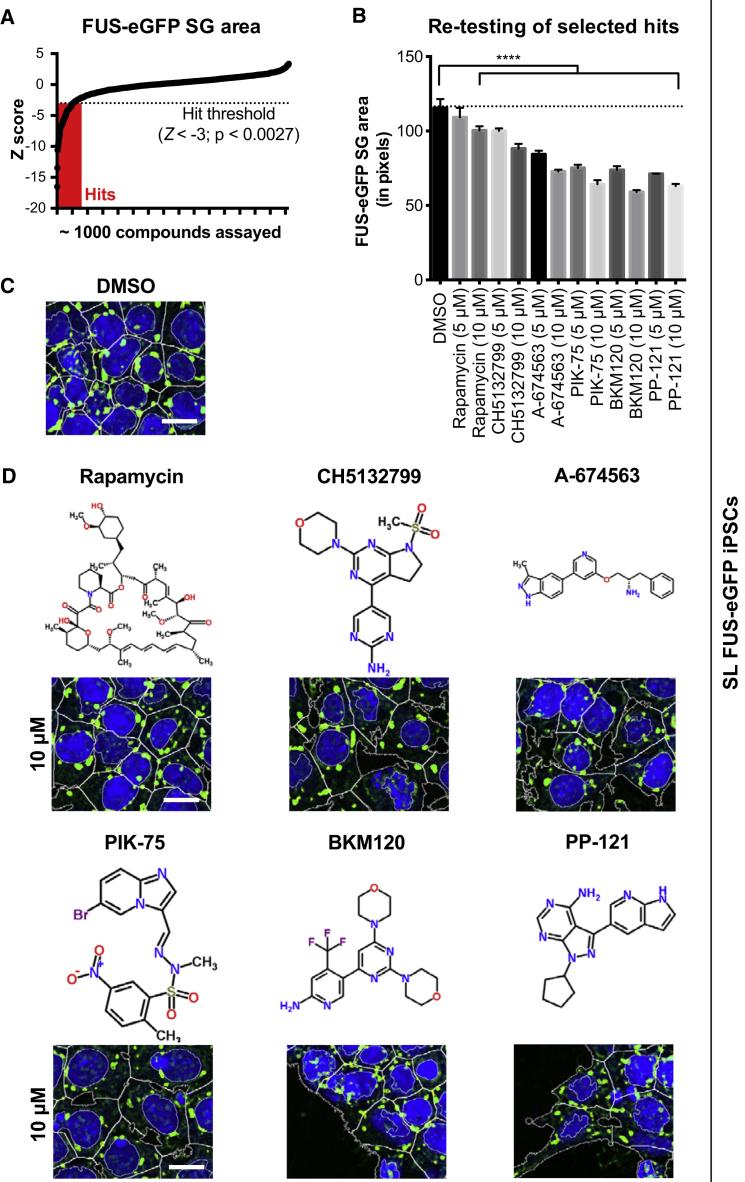
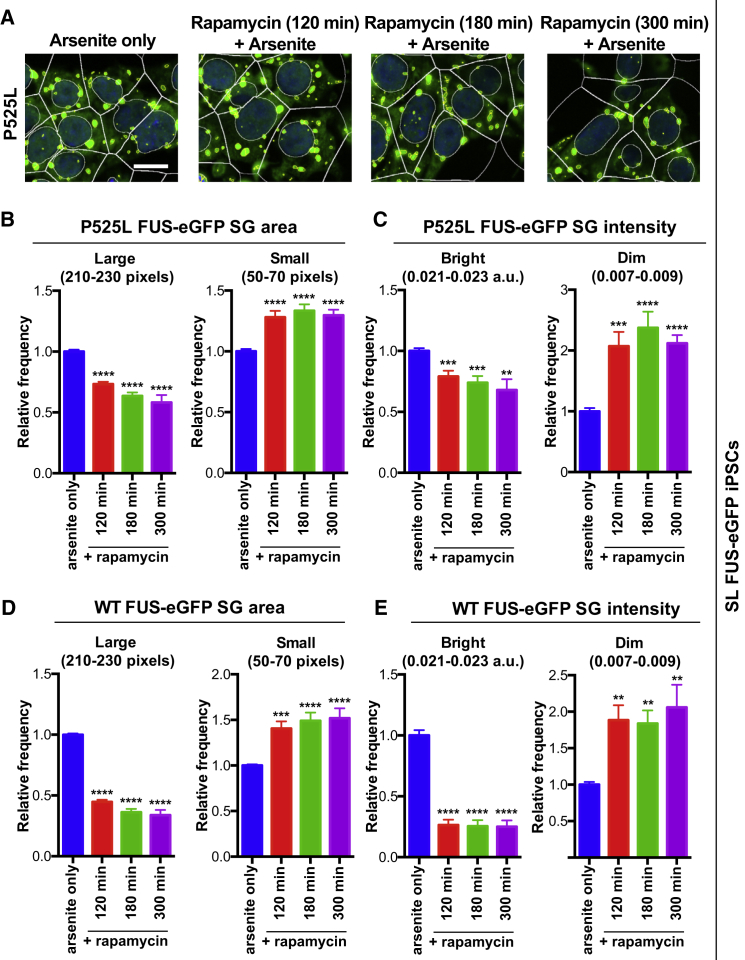
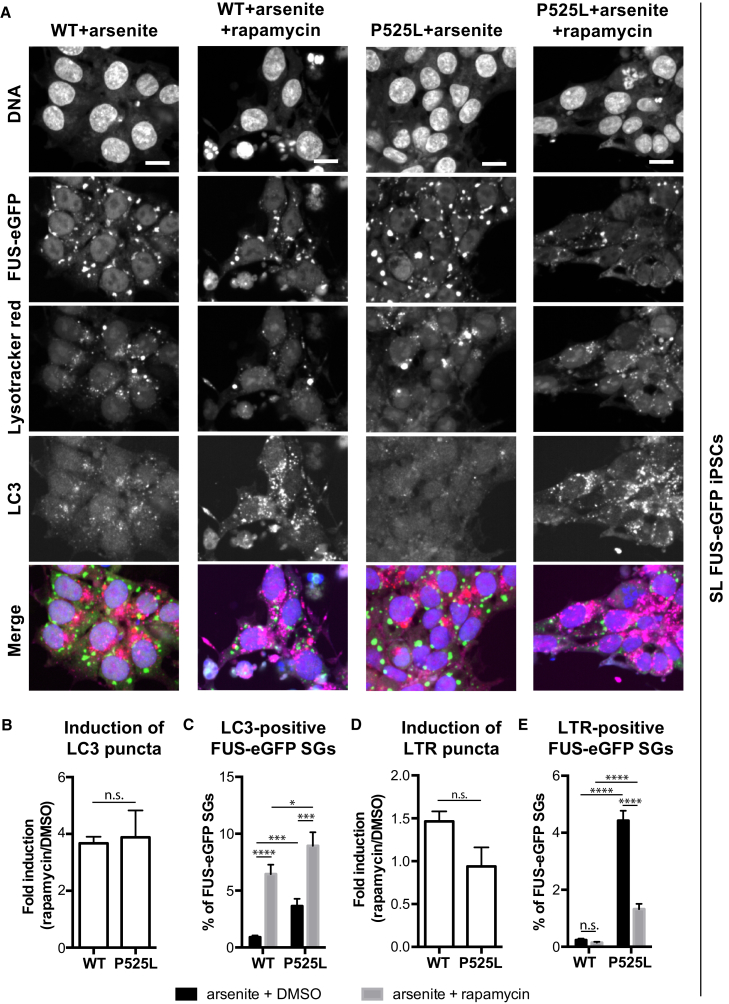
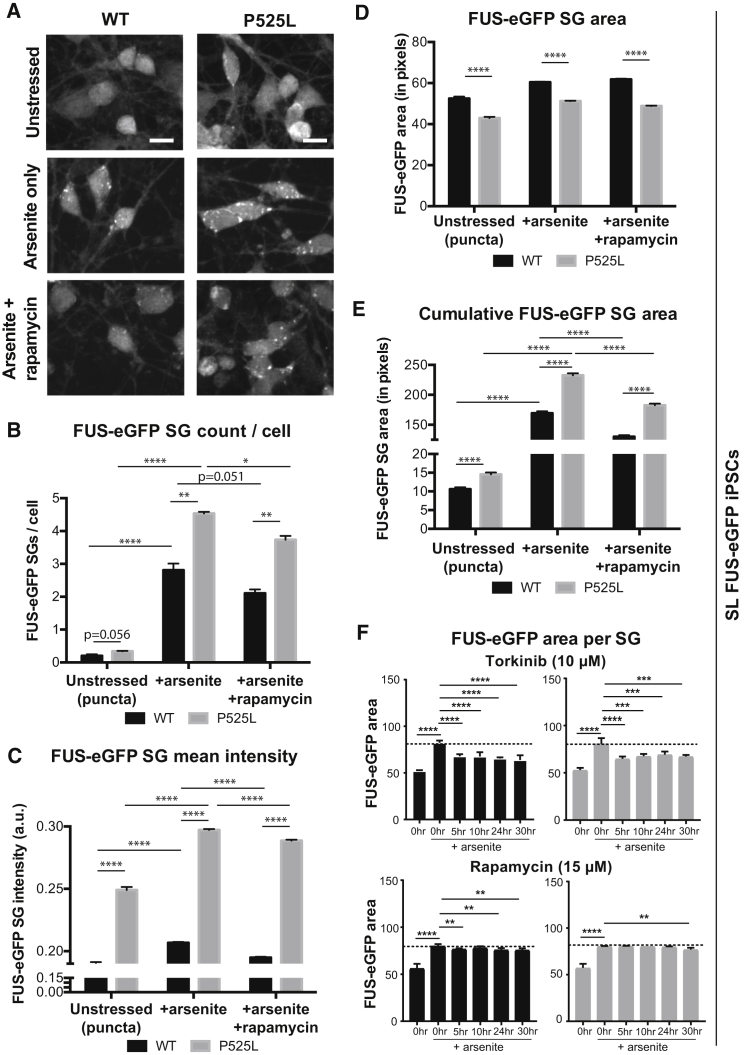
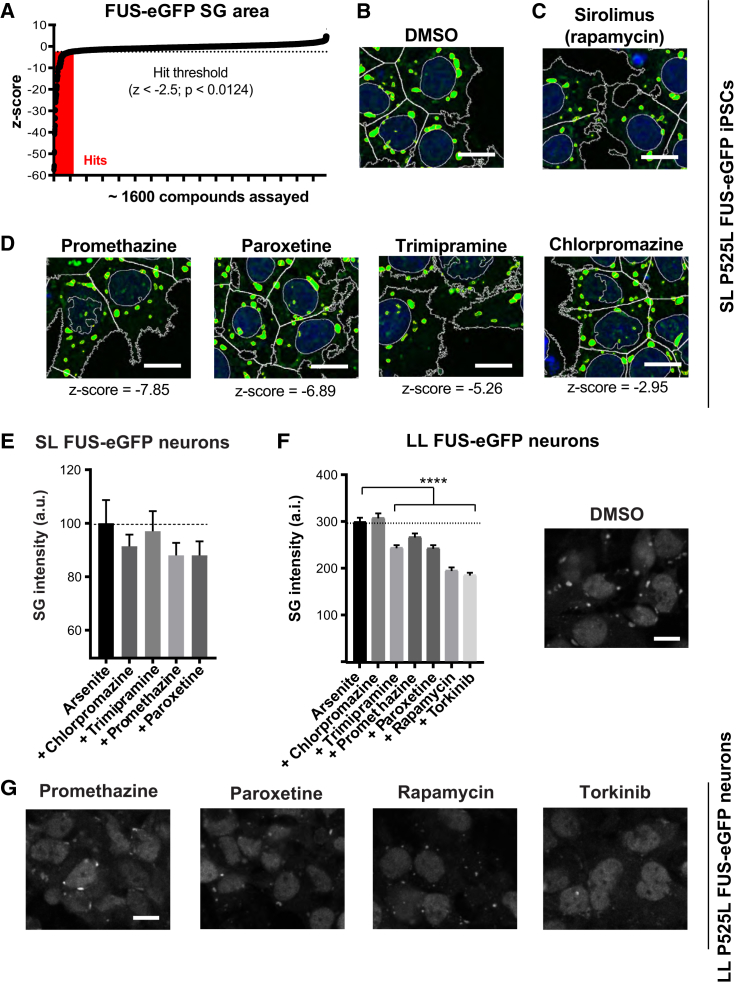
Perturbations in stress granule (SG) dynamics may be at the core of amyotrophic lateral sclerosis (ALS). Since SGs are membraneless compartments, modeling their dynamics in human motor neurons has been challenging, thus hindering the identification of effective therapeutics. Here, we report the generation of isogenic induced pluripotent stem cells carrying wild-type and P525L FUS-eGFP. We demonstrate that FUS-eGFP is recruited into SGs and that P525L profoundly alters their dynamics. With a screening campaign, we demonstrate that PI3K/AKT/mTOR pathway inhibition increases autophagy and ameliorates SG phenotypes linked to P525L FUS by reducing FUS-eGFP recruitment into SGs. Using a Drosophila model of FUS-ALS, we corroborate that induction of autophagy significantly increases survival. Finally, by screening clinically approved drugs for their ability to ameliorate FUS SG phenotypes, we identify a number of brain-penetrant anti-depressants and anti-psychotics that also induce autophagy. These drugs could be repurposed as potential ALS treatments.
Overview
The claims and statistics of this paper haven’t been checked yet.
Run the check — free, no account needed. It reads the open-access text and checks the sources it cites.
Integrity signals
Registry
Cites
Statistics
Figures
Verification
Claims the paper makes
The claims and statistics of this paper haven’t been checked yet.
Run the check — free, no account needed. It reads the open-access text and checks the sources it cites.
Claims other papers make about this one
Each is checked against this paper’s own text: does it say what the citing paper says it does?
In the citing paper
“autophagy induction extends survival in a Drosophila model of FUS-ALS [236].”
From Autophagy and ALS: mechanistic insights and therapeutic implications (2022) · cites this paper as [236]
In the citing paper
“autophagy activation via PI3K, AKT or MTOR inhibition reverses stress granule accumulation caused by ALS-linked mutant FUS [236]”
From Autophagy and ALS: mechanistic insights and therapeutic implications (2022) · cites this paper as [236]
Self-check
Percentages, sums and reported differences re-computed from the paper’s own numbers.
The self-check needs the paper’s full text.
Citations
Cites
A Liquid-to-Solid Phase Transition of the ALS Protein FUS Accelerated by Disease Mutation
Patel, A., Lee, H. O., Jawerth, L. M., Maharana, S., Jahnel, M., Hein, M. Y., Stoynov, S., Mahamid, J., Saha, S., Franzmann, T. M., et al. (2015) · Cell · doi:10.1016/j.cell.2015.07.047 · Cited by 2,927
Self-citationDynamics and diversity in autophagy mechanisms: lessons from yeast
Nakatogawa, H., Suzuki, K., Kamada, Y., & Ohsumi, Y. (2009) · Nature Reviews Molecular Cell Biology · doi:10.1038/nrm2708 · Cited by 1,761
Principles and Properties of Stress Granules
Protter, D. S. W., & Parker, R. (2016) · Trends in Cell Biology · doi:10.1016/j.tcb.2016.05.004 · Cited by 1,738
TDP-43 and FUS in amyotrophic lateral sclerosis and frontotemporal dementia
Mackenzie, I. R., Rademakers, R., & Neumann, M. (2010) · The Lancet Neurology · doi:10.1016/s1474-4422(10)70195-2 · Cited by 1,012
Abe, K., Aoki, M., Tsuji, S., Itoyama, Y., Sobue, G., Togo, M., Hamada, C., Tanaka, M., Akimoto, M., Nakamura, K., et al. (2017) · The Lancet Neurology · doi:10.1016/s1474-4422(17)30115-1 · Cited by 987
Stress granules as crucibles of ALS pathogenesis
Li, Y. R., King, O. D., Shorter, J., & Gitler, A. D. (2013) · The Journal of Cell Biology · doi:10.1083/jcb.201302044 · Cited by 948
ALS‐associated fused in sarcoma (FUS) mutations disrupt Transportin‐mediated nuclear import
Dormann, D., Rodde, R., Edbauer, D., Bentmann, E., Fischer, I., Hruscha, A., Than, M. E., Mackenzie, I. R. A., Capell, A., Schmid, B., et al. (2010) · The EMBO Journal · doi:10.1038/emboj.2010.143 · Cited by 836
Eukaryotic Stress Granules Are Cleared by Autophagy and Cdc48/VCP Function
Buchan, J. R., Kolaitis, R.-M., Taylor, J. P., & Parker, R. (2013) · Cell · doi:10.1016/j.cell.2013.05.037 · Cited by 737
A new subtype of frontotemporal lobar degeneration with FUS pathology
Neumann, M., Rademakers, R., Roeber, S., Baker, M., Kretzschmar, H. A., & Mackenzie, I. R. A. (2009) · Brain · doi:10.1093/brain/awp214 · Cited by 722
Green Fluorescent Protein as a Noninvasive Intracellular pH Indicator
Kneen, M. M., Farinas, J., Li, Y., & Verkman, A. S. (1998) · Biophysical Journal · doi:10.1016/s0006-3495(98)77870-1 · Cited by 712
Reinhardt, P., Glatza, M., Hemmer, K., Tsytsyura, Y., Thiel, C. S., Höing, S., Moritz, S., Parga, J. A., Wagner, L., Bruder, J. M., et al. (2013) · PLoS ONE · doi:10.1371/journal.pone.0059252 · Cited by 461
Self-citationAutophagy induction enhances TDP43 turnover and survival in neuronal ALS models
Barmada, S. J., Serio, A., Arjun, A., Bilican, B., Daub, A., Ando, D. M., Tsvetkov, A., Pleiss, M., Li, X., Peisach, D., et al. (2014) · Nature Chemical Biology · doi:10.1038/nchembio.1563 · Cited by 431
Point mutations of the p150 subunit of dynactin ( DCTN1 ) gene in ALS
Münch, C., Sedlmeier, R., Meyer, T., Homberg, V., Sperfeld, A. D., Kurt, A., Prudlo, J., Peraus, G., Hanemann, C. O., Stumm, G., et al. (2004) · Neurology · doi:10.1212/01.wnl.0000134608.83927.b1 · Cited by 422
Motor neurons and the generation of spinal motor neuron diversity
Stifani, N. (2014) · Frontiers in Cellular Neuroscience · doi:10.3389/fncel.2014.00293 · Cited by 389
Ganassi, M., Matějů, D., Bigi, I., Mediani, L., Poser, I., Lee, H. O., Seguin, S. J., Morelli, F. F., Vinet, J., Leo, G., et al. (2016) · Molecular Cell · doi:10.1016/j.molcel.2016.07.021 · Cited by 315
Self-citationNeumann, M., Bentmann, E., Dormann, D., Jawaid, A., DeJesus‐Hernandez, M., Ansorge, O., Roeber, S., Kretzschmar, H. A., Muñoz, D. G., Kusaka, H., et al. (2011) · Brain · doi:10.1093/brain/awr201 · Cited by 314
Tsvetkov, A. S., Miller, J., Arrasate, M., Wong, J. S., Pleiss, M. A., & Finkbeiner, S. (2010) · Proceedings of the National Academy of Sciences · doi:10.1073/pnas.1004498107 · Cited by 266
Lanson, N. A., Maltare, A., King, H., Smith, R. B., Kim, J. H., Taylor, J. P., Lloyd, T. E., & Pandey, U. B. (2011) · Human Molecular Genetics · doi:10.1093/hmg/ddr150 · Cited by 209
Self-citationDaigle, J. G., Lanson, N. A., Smith, R. B., Casci, I., Maltare, A., Monaghan, J., Nichols, C. D., Kryndushkin, D. S., Shewmaker, F. P., & Pandey, U. B. (2012) · Human Molecular Genetics · doi:10.1093/hmg/dds526 · Cited by 205
Self-citationLenzi, J., Santis, R. D., de Turris, V., Morlando, M., Laneve, P., Calvo, A., Caliendo, V., Chiò, A., Rosa, A., & Bozzoni, I. (2015) · Disease Models & Mechanisms · doi:10.1242/dmm.020099 · Cited by 140
Clinical efficacy of edaravone for the treatment of amyotrophic lateral sclerosis
Sawada, H. (2017) · Expert Opinion on Pharmacotherapy · doi:10.1080/14656566.2017.1319937 · Cited by 139
Conte, A., Lattante, S., Zollino, M., Marangi, G., Luigetti, M., Grande, A. D., Servidei, S., Trombetta, F., & Sabatelli, M. (2011) · Neuromuscular Disorders · doi:10.1016/j.nmd.2011.08.003 · Cited by 137
Ryu, H.-H., Jun, M.-H., Min, K.-J., Jang, D.-J., Lee, Y.-S., Kim, H. K., & Lee, J.-A. (2014) · Neurobiology of Aging · doi:10.1016/j.neurobiolaging.2014.07.026 · Cited by 125
Differential effects of antidepressant drugs on mTOR signalling in rat hippocampal neurons
Park, S. W., Lee, J. G., Seo, M. K., Lee, C. H., Cho, H. Y., Lee, B. J., Seol, W., & Kim, Y. H. (2014) · The International Journal of Neuropsychopharmacology · doi:10.1017/s1461145714000534 · Cited by 113
Schoen, M., Reichel, J. M., Demestre, M., Putz, S., Deshpande, D., Proepper, C., Liebau, S., Schmeißer, M. J., Ludolph, A. C., Michaelis, J., et al. (2016) · Frontiers in Cellular Neuroscience · doi:10.3389/fncel.2015.00496 · Cited by 80
Rapamycin increases survival in ALS mice lacking mature lymphocytes
Staats, K. A., Hernández, S., Schönefeldt, S., Bento‐Abreu, A., Dooley, J., Damme, P. V., Liston, A., Robberecht, W., & Bosch, L. V. D. (2013) · Molecular Neurodegeneration · doi:10.1186/1750-1326-8-31 · Cited by 74
Japtok, J., Lojewski, X., Naumann, M., Klingenstein, M., Reinhardt, P., Sterneckert, J. L., Putz, S., Demestre, M., Boeckers, T. M., Ludolph, A. C., et al. (2015) · Neurobiology of Disease · doi:10.1016/j.nbd.2015.07.017 · Cited by 68
Self-citation
Cited by
Sorted by citations
RNA buffers the phase separation behavior of prion-like RNA binding proteins
Maharana, S., Wang, J., Papadopoulos, D. K., Richter, D., Pozniakovsky, A., Poser, I., Bickle, M., Rizk, S., Guillén‐Boixet, J., Franzmann, T. M., et al. (2018) · Science · doi:10.1126/science.aar7366 · Cited by 1,111
Self-citationGasset-Rosa, F., Lu, S., Yu, H., Chen, C., Melamed, Z., Guo, L. E., Shorter, J., Cruz, S. D., & Cleveland, D. W. (2019) · Neuron · doi:10.1016/j.neuron.2019.02.038 · Cited by 526
Ubiquitination of G3BP1 mediates stress granule disassembly in a context-specific manner
Gwon, Y., Maxwell, B. A., Kolaitis, R., Zhang, P., Kim, H. J., & Taylor, J. P. (2021) · Science · doi:10.1126/science.abf6548 · Cited by 341
The Autophagy Lysosomal Pathway and Neurodegeneration
Finkbeiner, S. (2020) · Cold Spring Harbor Perspectives in Biology · doi:10.1101/cshperspect.a033993 · Cited by 196
Autophagy and ALS: mechanistic insights and therapeutic implications
Chua, J. P., De Calbiac, H., Kabashi, E., & Barmada, S. J. (2022) · Autophagy · doi:10.1080/15548627.2021.1926656 · Cited by 189
“Intriguingly, FUS may exert a direct influence on autophagy initiation and autophagosome elongation by maintaining expression of factors including RB1CC1 and ATG16L1, which are diminished after CRISPR-mediated knockout of Fus but restored with re-introduction of wild-type FUS in N2A cells [237].”
BackgroundInfluential
Metadata
- Authors
- Marrone, L., Poser, I., Casci, I., Japtok, J., Reinhardt, P., Janosch, A., Andree, C., Lee, H. O., Moebius, C., Koerner, E., Reinhardt, L., Cicardi, M. E., Hackmann, K., Klink, B., Poletti, A., Alberti, S., Bickle, M., Hermann, A., Pandey, U. B., Hyman, A. A., & Sterneckert, J. L.
- Affiliations
- Center for Regenerative Therapies Dresden (DE)
- Max Planck Institute of Molecular Cell Biology and Genetics (DE)
- University of Pittsburgh (US)
- Technische Universität Dresden (DE)
- AbbVie (Germany) (DE)
- University of Milan (IT)
- German Center for Neurodegenerative Diseases (DE)
- Corresponding author
- Sterneckert, Jared L.
- ORCID
- Venue
- Stem Cell Reports
- Publisher
- Elsevier BV
- Published
- 2018-02
- Volume
- 10
- Issue
- 2
- Pages
- 375-389
- ISSN
- 2213-6711 (ISSN-L)
- PMC
- PMC5857889
- OpenAlex
- W2784040894
- Cited by
- 104
- References
- 27
- Citations by year
- 2026: 5 · 2025: 4 · 2024: 8 · 2023: 11 · 2022: 14 · 2021: 20 · 2020: 21 · 2019: 15 · 2018: 6
- FWCI
- 10.53
- Type
- journal article
- Language
- en
- Open access
- gold
- doi.org
- Licence
- Locations
- Stem Cell Reports (publishedVersion, cc-by-nc-nd)
- Europe PMC (PubMed Central) (publishedVersion, cc-by-nc-nd)
- PubMed Central (publishedVersion, cc-by-nc-nd)
- PubMed (publishedVersion)
- Archivio Istituzionale della Ricerca (Universita Degli Studi Di Milano) (submittedVersion, other-oa)
- DOAJ (DOAJ: Directory of Open Access Journals) (submittedVersion, cc-by-sa)
- DZNE Pub (submittedVersion, other-oa)
- MPG.PuRe (Max Planck Society) (submittedVersion)
- Funders
- Ministry of Health
- Deutsche Gesellschaft für Muskelkranke (He2/2)
- EU Joint Programme – Neurodegenerative Disease Research
- Exzellenzcluster Ozean der Zukunft (EXC 168)
- Deutsche Forschungsgemeinschaft (FZ 111)
- Schweizerischer Nationalfonds zur Förderung der Wissenschaftlichen Forschung
- Horizon 2020 (643417)
- Muscular Dystrophy Association
- NOMIS Stiftung
- Ministero dell’Istruzione, dell’Università e della Ricerca
- Vetenskapsrådet
- Zentrum für Regenerative Therapien Dresden
- National Institutes of Health (R01NS081303, R21NS094921, R21NS098379, R21NS100055)
- Bundesministerium für Bildung und Forschung (01ED1601B)
- Technische Universität Dresden
- Topics
- Health Sciences › Medicine › Clinical Neurology › Amyotrophic Lateral Sclerosis Research
- Life Sciences › Biochemistry, Genetics and Molecular Biology › Molecular Biology › Pluripotent Stem Cells Research
- Life Sciences › Neuroscience › Cellular and Molecular Neuroscience › Alzheimer's disease research and treatments
- Keywords
- stress granules, amyotrophic lateral sclerosis, autophagy, drug repurposing, antidepressants, antipsychotic drugs, motor neurons, biomolecular condensates
- MeSH terms
- Amyotrophic Lateral Sclerosis, Animals, Antidepressive Agents, Autophagy, Drosophila, Drug Evaluation, Preclinical, Humans, Motor Neurons, Mutation, Signal Transduction, Phosphatidylinositol 3-Kinases, Drosophila Proteins, Heterogeneous-Nuclear Ribonucleoprotein Group F-H, RNA-Binding Protein FUS, Green Fluorescent Proteins, Proto-Oncogene Proteins c-akt, Induced Pluripotent Stem Cells, TOR Serine-Threonine Kinases, Antipyretics, CRISPR-Cas Systems
About these checks
Registry, retraction, Cites and statistics results are computed, not judged, with one exception: a printed reference that no index lists is read once by a model before it counts as a citation error. Claims are extracted by a model and kept only when their quote appears verbatim in the text; each cited source is then checked, with a model’s help, for whether it says what the claim relies on. Those verdicts can be wrong — read the claim’s quote and the cited source before relying on one.
Statistics and arithmetic are recomputed, not judged.
Confidence bands are shown only for fields calibrated on our annotated test set. None is calibrated yet, so no band is shown.
What counts as a claim ›How we measure confidence ›How we check this ›
Are you an author, or do you see a problem with this page? Request a review
