

The DOI matches its Crossref record; 46 of the 47 references it cites were found in a registry or an index.
Modeling Down Syndrome with Patient iPSCs Reveals Cellular and Migration Deficits of GABAergic Neurons
Open accessAbstract
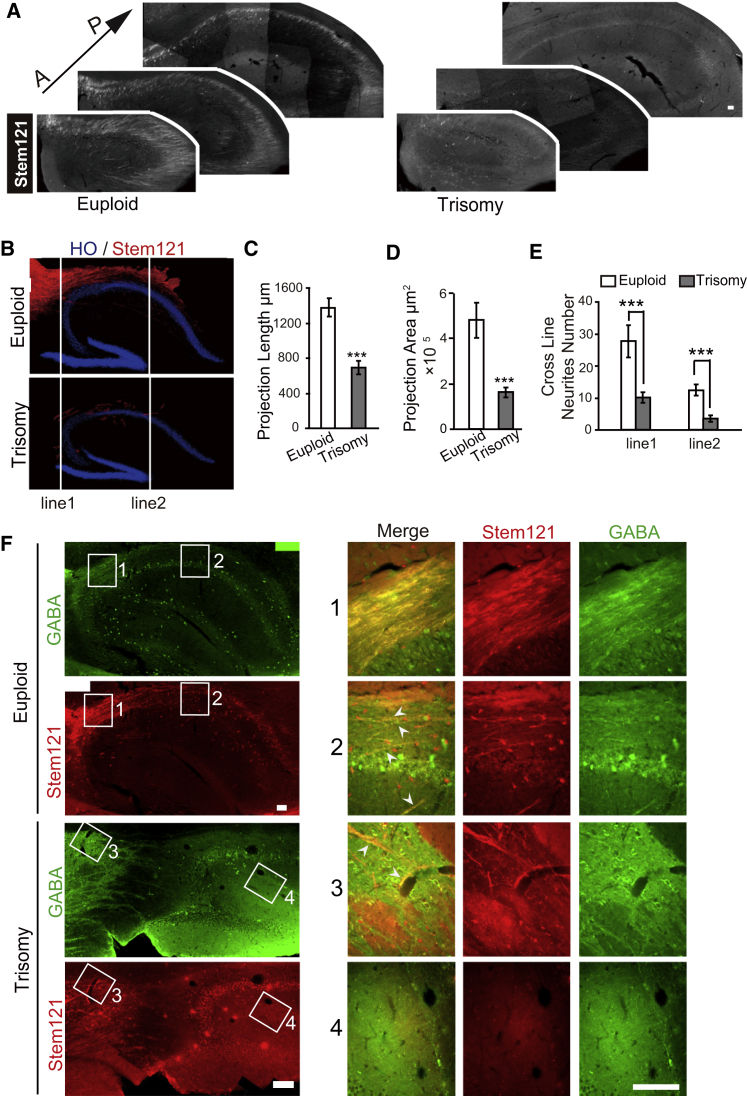
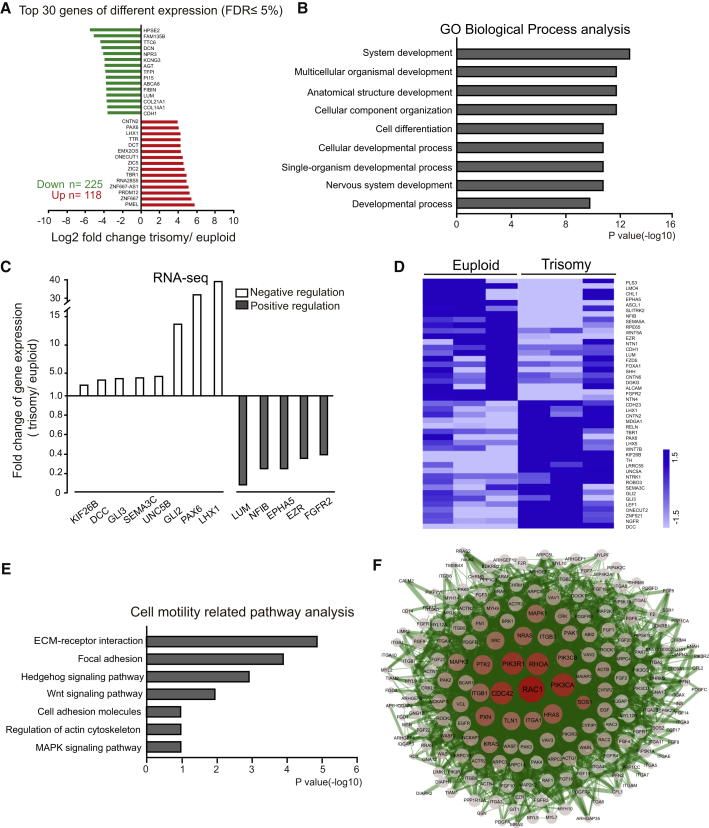
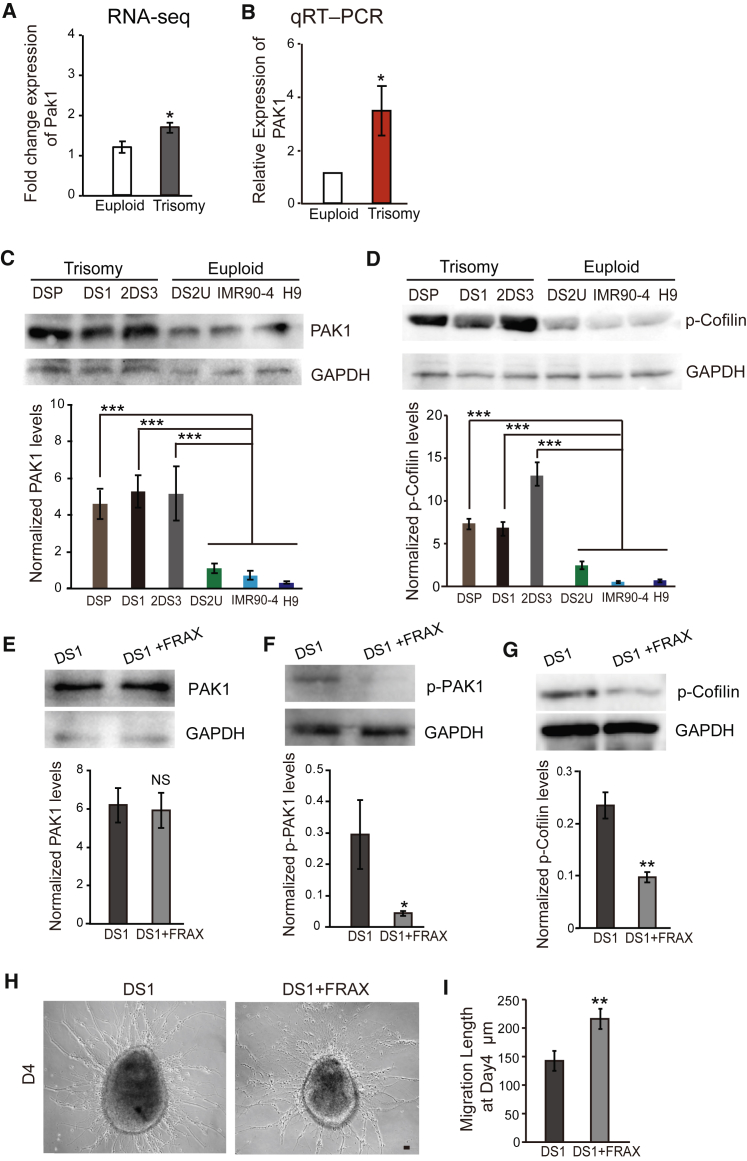
The brain of Down syndrome (DS) patients exhibits fewer interneurons in the cerebral cortex, but its underlying mechanism remains unknown. By morphometric analysis of cortical interneurons generated from DS and euploid induced pluripotent stem cells (iPSCs), we found that DS GABA neurons are smaller and with fewer neuronal processes. The proportion of calretinin over calbindin GABA neurons is reduced, and the neuronal migration capacity is decreased. Such phenotypes were replicated following transplantation of the DS GABAergic progenitors into the mouse medial septum. Gene expression profiling revealed altered cell migratory pathways, and correction of the PAK1 pathway mitigated the cell migration deficit in vitro. These results suggest that impaired migration of DS GABAergic neurons may contribute to the reduced number of interneurons in the cerebral cortex and hippocampus in DS patients.
Overview
The claims and statistics of this paper haven’t been checked yet.
Run the check — free, no account needed. It reads the open-access text and checks the sources it cites.
Integrity signals
Registry
Cites
Statistics
Figures
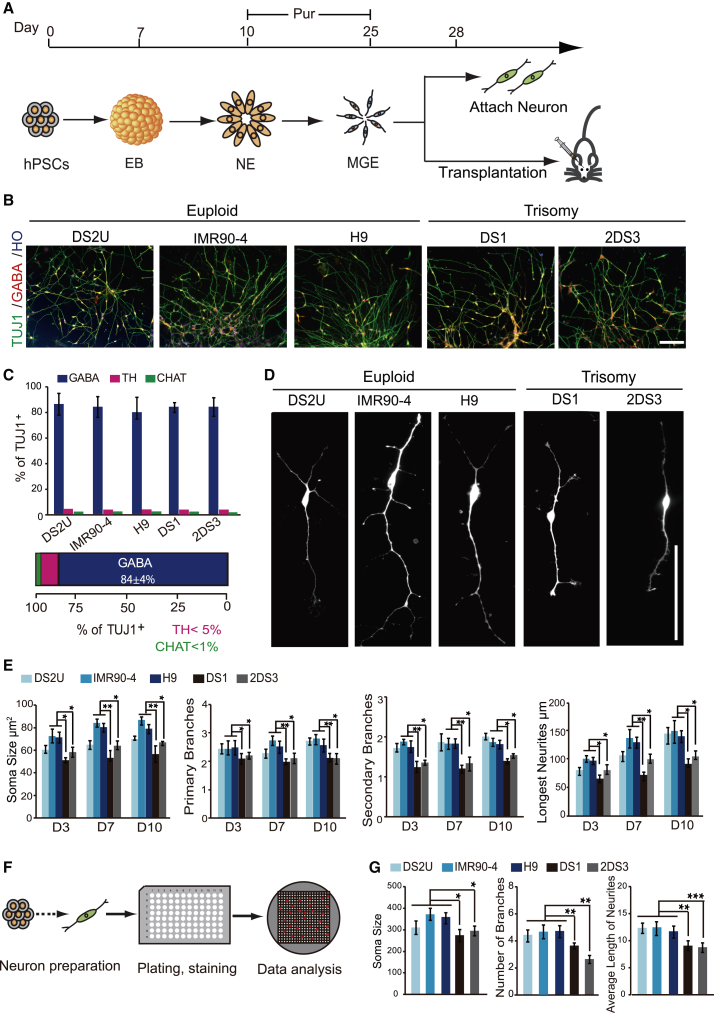
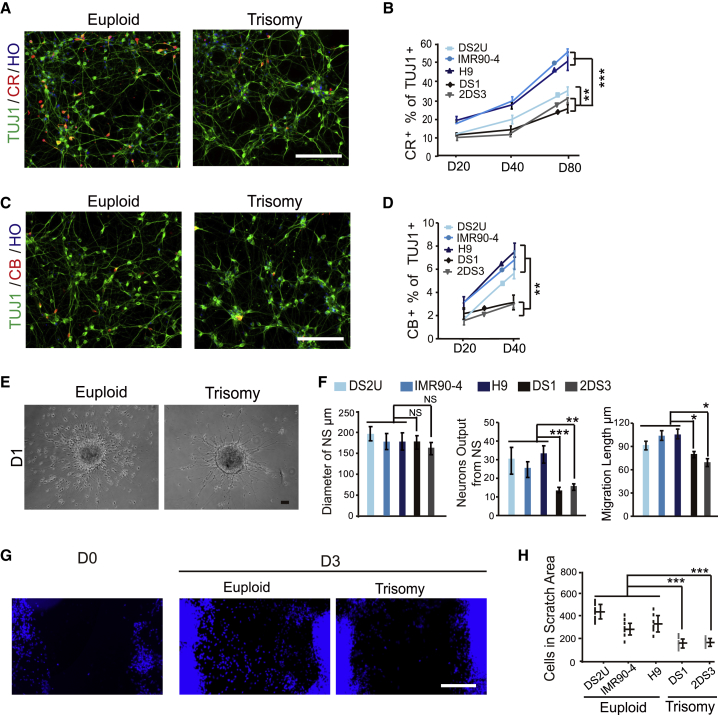
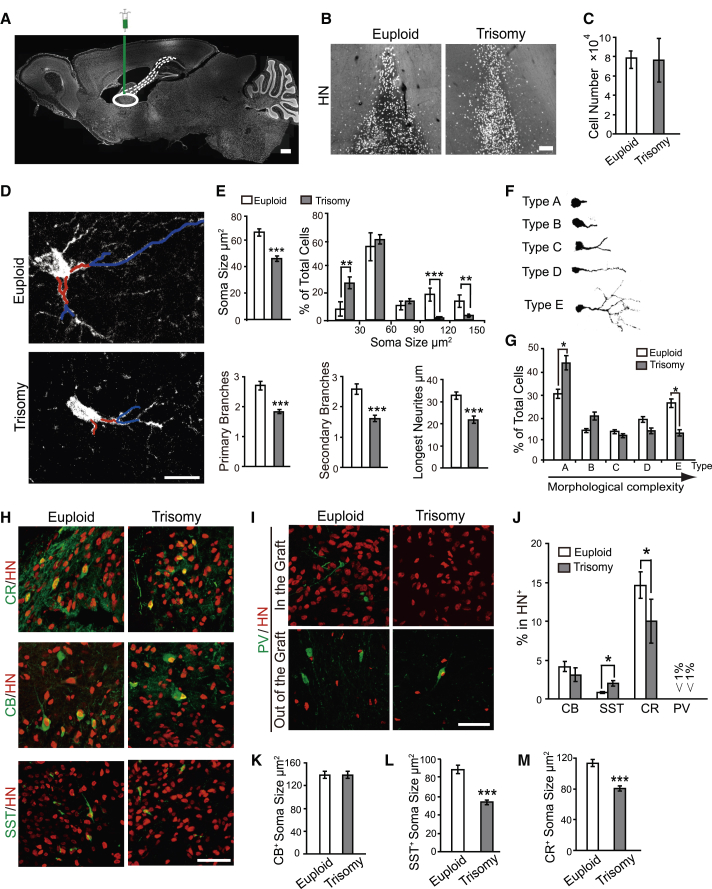
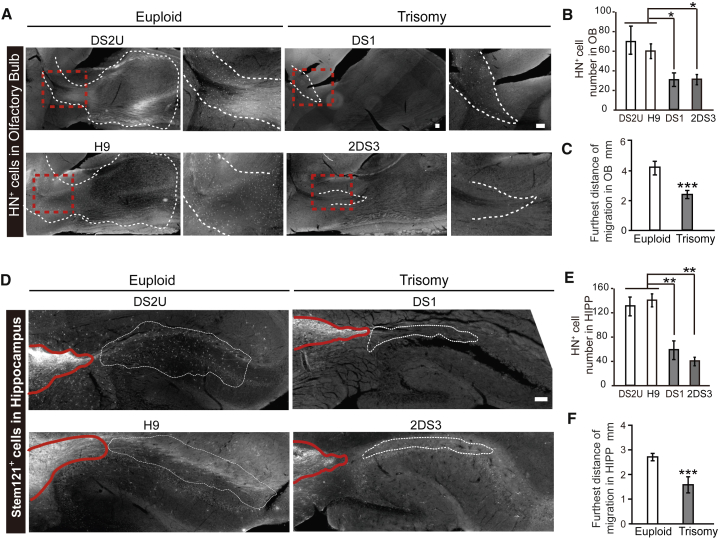
Verification
Claims the paper makes
The claims and statistics of this paper haven’t been checked yet.
Run the check — free, no account needed. It reads the open-access text and checks the sources it cites.
Claims other papers make about this one
Each is checked against this paper’s own text: does it say what the citing paper says it does?
The cited source doesn’t support the claim as written.
In the citing paper
“Evidence from iPSCs differentiated to ventral forebrain-like interneuron progenitors indicates that the number of progenitors that are produced is different in the presence of T21 (84,90,91).”
From Consequences of trisomy 21 for brain development in Down syndrome (2024) · cites this paper as [90]
Checked by a reasoning model — may be wrong.
Experimental — accuracy not yet measuredThe source backs part of the claim, not all of it — or backs it for a different population, condition or comparison.
In the citing paper
“Human cortical interneurons have been shown to integrate extensively into the host mouse brain thanks to the remarkable migratory properties of this class of neurons”
From Xenotransplanted human cortical neurons reveal species-specific development and functional integration into mouse visual circuits (2019) · cites this paper as Huo et al., 2018
Experimental — accuracy not yet measuredThe cited source says what the claim attributes to it.
In the citing paper
“Furthermore, interneuron progenitors from T21 iPSCs show reduced migratory ability90 compared to controls, raising the likelihood that defects in specification, proliferation and/or migration together result in deficiency of interneurons in DS.”
From Consequences of trisomy 21 for brain development in Down syndrome (2024) · cites this paper as [90]
The cited source says what the claim attributes to it.
In the citing paper
“Furthermore, interneuron progenitors from T21 iPSCs show reduced migratory ability90 compared to controls, raising the likelihood that defects in specification, proliferation and/or migration together result in deficiency of interneurons in DS.”
From Consequences of trisomy 21 for brain development in Down syndrome (2024) · cites this paper as [90]
The cited source says what the claim attributes to it.
In the citing paper
“However, another study using a 2D culture method identified a significant decrease in calretinin positive interneurons along with a significant decrease in calbindin positive interneurons (Huo et al., 2018).”
From Neurodevelopment in Down syndrome: Concordance in humans and models (2022) · cites this paper as Huo et al., 2018
Self-check
Percentages, sums and reported differences re-computed from the paper’s own numbers.
The self-check needs the paper’s full text.
Citations
Cites
GABAergic cell subtypes and their synaptic connections in rat frontal cortex
Kawaguchi, Y. (1997) · Cerebral Cortex · doi:10.1093/cercor/7.6.476 · Cited by 1,416
Modelling schizophrenia using human induced pluripotent stem cells
Brennand, K. J., Simone, A., Jou, J., Gelboin-Burkhart, C., Tran, N., Sangar, S., Li, Y., Mu, Y., Chen, G., Yu, D., et al. (2011) · Nature · doi:10.1038/nature09915 · Cited by 1,375
The origin and specification of cortical interneurons
Wonders, C. P., & Anderson, S. A. (2006) · Nature Reviews Neuroscience · doi:10.1038/nrn1954 · Cited by 980 · cited 1×
“They may be subdivided into multiple subtypes according to the expression of calbindin (CB), SST, CR, and parvalbumin (PV) (Kawaguchi and Kubota, 1997; Wonders and Anderson, 2006).”
BackgroundMosaic Organization of Neural Stem Cells in the Adult Brain
Merkle, F. T., Mirzadeh, Z., & Álvarez-Buylla, A. (2007) · Science · doi:10.1126/science.1144914 · Cited by 821
Kondo, T., Asai, M., Tsukita, K., Kutoku, Y., Ohsawa, Y., Sunada, Y., Imamura, K., Egawa, N., Yahata, N., Okita, K., et al. (2013) · Cell Stem Cell · doi:10.1016/j.stem.2013.01.009 · Cited by 741
Synaptic dysregulation in a human iPS cell model of mental disorders
Wen, Z., Nguyen, H. N., Guo, Z., Lalli, M. A., Wang, X., Su, Y., Kim, N.-S., Yoon, K.-J., Shin, J., Zhang, C., et al. (2014) · Nature · doi:10.1038/nature13716 · Cited by 549
Subcortical origins of human and monkey neocortical interneurons
Ma, T., Wang, C., Wang, L., Zhou, X., Tian, M., Zhang, Q., Zhang, Y., Li, J., Liu, Z., Cai, Y., et al. (2013) · Nature Neuroscience · doi:10.1038/nn.3536 · Cited by 322
Self-citationModeling ALS with iPSCs reveals that mutant SOD1 misregulates neurofilament balance in motor neurons
Chen, H., Qian, K., Du, Z., Cao, J., Petersen, A., Liu, H., Blackbourn, L. W., Huang, C.-L., Errigo, A., Yin, Y., et al. (2014) · Cell stem cell · doi:10.1016/j.stem.2014.02.004 · Cited by 318
Self-citationA Human Stem Cell Model of Early Alzheimer’s Disease Pathology in Down Syndrome
Shi, Y., Kirwan, P., Smith, J., MacLean, G., Orkin, S. H., & Livesey, F. J. (2012) · Science Translational Medicine · doi:10.1126/scitranslmed.3003771 · Cited by 310
Directed differentiation of forebrain GABA interneurons from human pluripotent stem cells
Liu, Y., Liu, H., Sauvey, C., Yao, L., Żarnowska, E. D., & Zhang, S. (2013) · Nature Protocols · doi:10.1038/nprot.2013.106 · Cited by 308
Self-citation
Cited by
Sorted by citations
Items 101–121 of 121
Liu, Y.-N., Cai, Q., Li, K., Li, W., He, G., Zeng, F., & Yan, J. (2025) · Mitochondrion · doi:10.1016/j.mito.2025.102108
Self-citationFoliaki, S. T., Schwarz, B. H., Groveman, B. R., Walters, R. O., Ferreira, N. C., Orru, C. D., Smith, A., Wood, A. R., Schmit, O. M., Freitag, P., et al. (2021) · Figshare · doi:10.6084/m9.figshare.16786657
Foliaki, S. T., Schwarz, B. H., Groveman, B. R., Walters, R. O., Ferreira, N. C., Orru, C. D., Smith, A., Wood, A. R., Schmit, O. M., Freitag, P., et al. (2021) · Figshare · doi:10.6084/m9.figshare.16786681
Foliaki, S. T., Schwarz, B. H., Groveman, B. R., Walters, R. O., Ferreira, N. C., Orru, C. D., Smith, A., Wood, A. R., Schmit, O. M., Freitag, P., et al. (2021) · Figshare · doi:10.6084/m9.figshare.16786651
Foliaki, S. T., Schwarz, B. H., Groveman, B. R., Walters, R. O., Ferreira, N. C., Orru, C. D., Smith, A., Wood, A. R., Schmit, O. M., Freitag, P., et al. (2021) · Figshare · doi:10.6084/m9.figshare.16786672
Foliaki, S. T., Schwarz, B. H., Groveman, B. R., Walters, R. O., Ferreira, N. C., Orru, C. D., Smith, A., Wood, A. R., Schmit, O. M., Freitag, P., et al. (2021) · Figshare · doi:10.6084/m9.figshare.16786666
Foliaki, S. T., Schwarz, B. H., Groveman, B. R., Walters, R. O., Ferreira, N. C., Orru, C. D., Smith, A., Wood, A. R., Schmit, O. M., Freitag, P., et al. (2021) · Figshare · doi:10.6084/m9.figshare.16786687
Foliaki, S. T., Schwarz, B. H., Groveman, B. R., Walters, R. O., Ferreira, N. C., Orru, C. D., Smith, A., Wood, A. R., Schmit, O. M., Freitag, P., et al. (2021) · Figshare · doi:10.6084/m9.figshare.16786663
Foliaki, S. T., Schwarz, B. H., Groveman, B. R., Walters, R. O., Ferreira, N. C., Orru, C. D., Smith, A., Wood, A. R., Schmit, O. M., Freitag, P., et al. (2021) · Figshare · doi:10.6084/m9.figshare.16786717
Pecze, L., Randi, E. B., & Szabo, C. (2020) · Figshare · doi:10.6084/m9.figshare.13213015
Foliaki, S. T., Schwarz, B. H., Groveman, B. R., Walters, R. O., Ferreira, N. C., Orru, C. D., Smith, A., Wood, A. R., Schmit, O. M., Freitag, P., et al. (2021) · Figshare · doi:10.6084/m9.figshare.16786669
Foliaki, S. T., Schwarz, B. H., Groveman, B. R., Walters, R. O., Ferreira, N. C., Orru, C. D., Smith, A., Wood, A. R., Schmit, O. M., Freitag, P., et al. (2021) · Figshare · doi:10.6084/m9.figshare.16786675
Foliaki, S. T., Schwarz, B. H., Groveman, B. R., Walters, R. O., Ferreira, N. C., Orru, C. D., Smith, A., Wood, A. R., Schmit, O. M., Freitag, P., et al. (2021) · Figshare · doi:10.6084/m9.figshare.16786714
Foliaki, S. T., Schwarz, B. H., Groveman, B. R., Walters, R. O., Ferreira, N. C., Orru, C. D., Smith, A., Wood, A. R., Schmit, O. M., Freitag, P., et al. (2021) · Figshare · doi:10.6084/m9.figshare.16786678
Foliaki, S. T., Schwarz, B. H., Groveman, B. R., Walters, R. O., Ferreira, N. C., Orru, C. D., Smith, A., Wood, A. R., Schmit, O. M., Freitag, P., et al. (2021) · Figshare · doi:10.6084/m9.figshare.16786660
XIST as a potential chromosome therapy for autosomal trisomy syndromes
Gomes, A. M. T., & Tan, W. (2026) · Translational Science of Rare Diseases · doi:10.1177/22146490261469423
Zhu, X., Haure‐Mirande, J., Bicak, M., Dong, P., Kruglikov, I., Li, A., Al‐subaie, A., Fossati, V., Noggle, S., Gandy, S., et al. (2026) · Alzheimer s & Dementia · doi:10.1002/alz.71684 · Cited by 1
The Role of Hippocampal Interneuron Migration in Neurodevelopmental Disorders: A Systematic Review
Till, M. A. C., Reid, H. M. O., Murphy, I., & Christie, B. R. (2026) · Hippocampus · doi:10.1002/hipo.70121
Plećaš, A., Gough, G., Kunštek, S., Babić, M., Murray, A., Nižetić, D., & Alić, I. (2026) · Frontiers in Cell and Developmental Biology · doi:10.3389/fcell.2026.1963992
Harej, A., Rački, V., Belančić, A., Križ, J., Vitezić, D., Mršić‐Pelčić, J., Acharya, G., Varshney, M., & Pilipović, K. (2026) · Stem Cells International · doi:10.1155/sci/1130043
Human brain cellular xenografts in neuroimmunology and beyond
Fattorelli, N., Martínez‐Muriana, A., Perry, V. H., & Mancuso, R. (2026) · Immunity · doi:10.1016/j.immuni.2026.09.024
Metadata
- Authors
- Huo, H.-Q., Qu, Z.-Y., Yuan, F., Ma, L., Yao, L., Xu, M., Hu, Y., Ji, J., Bhattacharyya, A., Zhang, S.-C., & Liu, Y.
- Affiliations
- State Key Laboratory of Reproductive Medicine (CN)
- Shanghai Medical College of Fudan University (CN)
- University of Wisconsin–Madison (US)
- Nanjing Medical University (CN)
- Jiangsu Province Hospital (CN)
- University of Wisconsin System (US)
- Corresponding author
- Zhang, Su-Chun
- Liu, Yan
- Venue
- Stem Cell Reports
- Publisher
- Elsevier BV
- Published
- 2018-04
- Volume
- 10
- Issue
- 4
- Pages
- 1251-1266
- ISSN
- 2213-6711 (ISSN-L)
- PMC
- PMC5998838
- OpenAlex
- W2789849905
- Cited by
- 122
- References
- 47
- Citations by year
- 2026: 9 · 2025: 13 · 2024: 15 · 2023: 14 · 2022: 20 · 2021: 27 · 2020: 8 · 2019: 13 · 2018: 3
- FWCI
- 12.16
- Type
- journal article
- Language
- en
- Open access
- gold
- doi.org
- Licence
- Locations
- Stem Cell Reports (publishedVersion, cc-by-nc-nd)
- Europe PMC (PubMed Central) (publishedVersion, cc-by-nc-nd)
- PubMed Central (publishedVersion, cc-by-nc-nd)
- PubMed (publishedVersion)
- DOAJ (DOAJ: Directory of Open Access Journals) (submittedVersion)
- Funders
- National Institutes of Health (MH100031, MH099587, R21HD085288)
- National Basic Research Program of China (2016YFC1306703)
- Government of Jiangsu Province
- National Natural Science Foundation of China (BK20160044, BK20160047, 81471301)
- Topics
- Health Sciences › Medicine › Public Health, Environmental and Occupational Health › Down syndrome and intellectual disability research
- Life Sciences › Biochemistry, Genetics and Molecular Biology › Molecular Biology › Pluripotent Stem Cells Research
- Life Sciences › Neuroscience › Developmental Neuroscience › Neurogenesis and neuroplasticity mechanisms
- Keywords
- Down syndrome, GABAergic interneurons, neuronal migration, iPSC-derived neurons, calretinin, calbindin, cerebral cortex, hippocampus, cell morphometry
- MeSH terms
- Animals, Brain, Cell Differentiation, Cell Movement, Cell Survival, Down Syndrome, Gene Expression Regulation, Humans, Interneurons, Models, Biological, Somatostatin, Neurites, Gene Expression Profiling, Cell Shape, Actin Depolymerizing Factors, Mice, p21-Activated Kinases, Induced Pluripotent Stem Cells, Neural Stem Cells, GABAergic Neurons, Calbindin 2
About these checks
Registry, retraction, Cites and statistics results are computed, not judged, with one exception: a printed reference that no index lists is read once by a model before it counts as a citation error. Claims are extracted by a model and kept only when their quote appears verbatim in the text; each cited source is then checked, with a model’s help, for whether it says what the claim relies on. Those verdicts can be wrong — read the claim’s quote and the cited source before relying on one.
Statistics and arithmetic are recomputed, not judged.
Confidence bands are shown only for fields calibrated on our annotated test set. None is calibrated yet, so no band is shown.
What counts as a claim ›How we measure confidence ›How we check this ›
Are you an author, or do you see a problem with this page? Request a review
