

The DOI matches its Crossref record; 65 of the 65 references it cites were found in a registry or an index.
Structure of the Staphylococcus aureus bacteriophage 80α neck shows details of the DNA, tail completion protein, and tape measure protein
Open accessPublished version of a preprint
Abstract
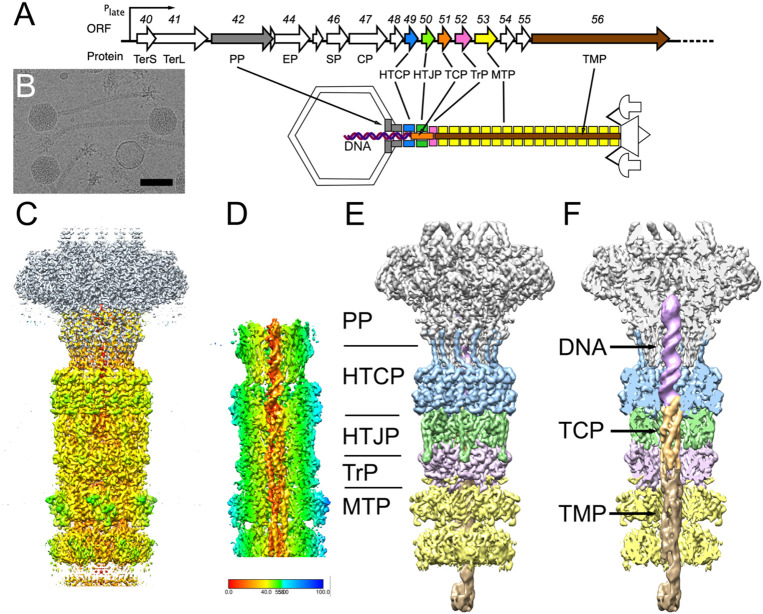
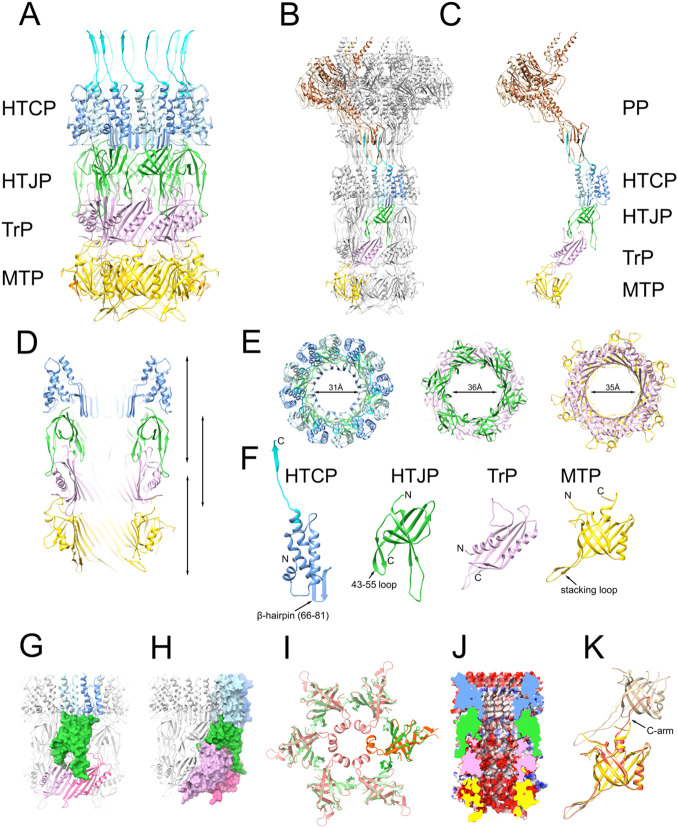
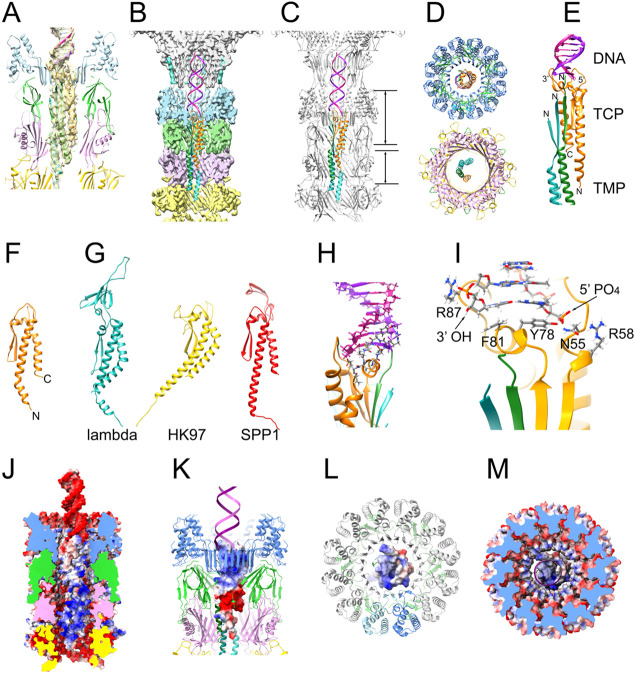
The Staphylococcus aureus pathogenicity islands (SaPIs), including SaPI1, are a type of mobile genetic elements (MGEs) that are mobilized at high frequency by "helper" bacteriophages, such as 80α, leading to packaging of the SaPI genomes into virions made from helper-encoded structural proteins. 80α and SaPI1 virions consist of an icosahedral head connected via a portal vertex to a long, non-contractile tail. A connector or "neck" forms the interface between the tail and the head. Here, we have determined the high-resolution structure of the neck section of SaPI1 virions, including the dodecameric portal and head-tail-connector proteins, and the hexameric head-tail joining, tail terminator and major tail proteins. We also resolved the DNA, the tail completion protein (TCP), and the tape measure protein (TMP) inside the tail, features that have not previously been observed at high resolution. Our study provides insights into the assembly and infection process in this important group of MGEs.
Overview
The claims and statistics of this paper haven’t been checked yet.
Run the check — free, no account needed. It reads the open-access text and checks the sources it cites.
Integrity signals
Registry
Cites
Statistics
Figures
Verification
Claims the paper makes
The claims and statistics of this paper haven’t been checked yet.
Run the check — free, no account needed. It reads the open-access text and checks the sources it cites.
Self-check
Percentages, sums and reported differences re-computed from the paper’s own numbers.
The self-check needs the paper’s full text.
Citations
Cites
Highly accurate protein structure prediction with AlphaFold
Jumper, J., Evans, R., Pritzel, A., Green, T., Figurnov, M., Ronneberger, O., Tunyasuvunakool, K., Bates, R., Žídek, A., Potapenko, A., et al. (2021) · Nature · doi:10.1038/s41586-021-03819-2 · Cited by 43,764
cryoSPARC: algorithms for rapid unsupervised cryo-EM structure determination
Punjani, A., Rubinstein, J. L., Fleet, D. J., & Brubaker, M. A. (2017) · Nature Methods · doi:10.1038/nmeth.4169 · Cited by 11,626
UCSF ChimeraX: Structure visualization for researchers, educators, and developers
Pettersen, E. F., Goddard, T. D., Huang, C. C., Meng, E. C., Couch, G. S., Croll, T. I., Morris, J. H., & Ferrin, T. E. (2021) · Protein Science · doi:10.1002/pro.3943 · Cited by 9,514
Croll, T. I. (2018) · Acta Crystallographica Section D Structural Biology · doi:10.1107/s2059798318002425 · Cited by 1,985
Diep, B. A., Gill, S. R., Chang, R. F., Phan, T. H., Chen, J. H., Davidson, M. G., Lin, F., Lin, J., Carleton, H. A., Mongodin, E. F., et al. (2006) · The Lancet · doi:10.1016/s0140-6736(06)68231-7 · Cited by 1,633
Visualizing density maps with UCSF Chimera
Goddard, T. D., Huang, C. C., & Ferrin, T. E. (2007) · Journal of Structural Biology · doi:10.1016/j.jsb.2006.06.010 · Cited by 867
Kourtis, A. P., Hatfield, K., Baggs, J., Mu, Y., See, I., Epson, E., Nadle, J., Kainer, M. A., Dumyati, G., Petit, S., et al. (2019) · MMWR. Morbidity and Mortality Weekly Report · doi:10.15585/mmwr.mm6809e1 · Cited by 701
Staphylococcus aureus: A Well–Armed Pathogen
Archer, G. L. (1998) · Clinical Infectious Diseases · doi:10.1086/520289 · Cited by 658
Mobile genetic elements of Staphylococcus aureus
Malachowa, N., & DeLeo, F. R. (2010) · Cellular and Molecular Life Sciences · doi:10.1007/s00018-010-0389-4 · Cited by 560
Turner, D., Shkoporov, A. N., Lood, C., Millard, A. D., Dutilh, B. E., Alfenas‐Zerbini, P., van Zyl, L. J., Aziz, R. K., Oksanen, H. M., Poranen, M. M., et al. (2023) · Archives of Virology · doi:10.1007/s00705-022-05694-2 · Cited by 493
Metadata
- Authors
- Kizziah, J. L., Mukherjee, A., Parker, L. K., & Dokland, T.
- Affiliations
- University of Alabama at Birmingham (US)
- Corresponding author
- Dokland, Terje
- Venue
- Structure
- Publisher
- Elsevier BV
- Published
- 2025-06
- Volume
- 33
- Issue
- 6
- Pages
- 1063-1073.e2
- ISSN
- 0969-2126 (ISSN-L)
- PMC
- PMC11661146
- OpenAlex
- W4409139676
- Cited by
- 11
- References
- 65
- Citations by year
- 2026: 9 · 2025: 2
- FWCI
- 2.71
- Type
- journal article
- Language
- en
- Open access
- bronze
- doi.org
- Licence
- www.elsevier.com/tdm/userlicense/1.0/ (tdm)
- www.elsevier.com/legal/tdmrep-license (tdm)
- www.elsevier.com/open-access/userlicense/1.0/ (am, 369 d)
- doi.org/10.15223/policy-017 (stm-asf)
- doi.org/10.15223/policy-037 (stm-asf)
- doi.org/10.15223/policy-012 (stm-asf)
- doi.org/10.15223/policy-029 (stm-asf)
- doi.org/10.15223/policy-004 (stm-asf)
- Locations
- Structure (acceptedVersion)
- bioRxiv (Cold Spring Harbor Laboratory) (acceptedVersion, cc-by)
- PubMed (publishedVersion)
- PubMed Central (publishedVersion)
- PubMed Central (submittedVersion, cc-by)
- Funders
- National Institute of General Medical Sciences (U24 GM116789)
- University of Alabama at Birmingham (SCR_025450)
- Purdue University (U24 GM116789)
- National Institutes of Health Office of the Director
- National Institute of Allergy and Infectious Diseases Division of Microbiology and Infectious Diseases (R01 AI083255)
- National Institutes of Health (SCR_025545)
- Topics
- Life Sciences › Immunology and Microbiology › Virology › Bacteriophages and microbial interactions
- Health Sciences › Medicine › Infectious Diseases › Antimicrobial Resistance in Staphylococcus
- Life Sciences › Biochemistry, Genetics and Molecular Biology › Structural Biology › Enzyme Structure and Function
- Keywords
- pathogenicity islands, mobile genetic elements, portal vertex, tape measure protein, viral assembly
About these checks
Registry, retraction, Cites and statistics results are computed, not judged, with one exception: a printed reference that no index lists is read once by a model before it counts as a citation error. Claims are extracted by a model and kept only when their quote appears verbatim in the text; each cited source is then checked, with a model’s help, for whether it says what the claim relies on. Those verdicts can be wrong — read the claim’s quote and the cited source before relying on one.
Statistics and arithmetic are recomputed, not judged.
Confidence bands are shown only for fields calibrated on our annotated test set. None is calibrated yet, so no band is shown.
What counts as a claim ›How we measure confidence ›How we check this ›
Are you an author, or do you see a problem with this page? Request a review
How to cite
Cite CoChat for the checks on this page, and the paper for its own findings.
- This page
- CoChat. (2026). Citation check: Structure of the Staphylococcus aureus bacteriophage 80α neck shows details of the DNA, tail completion protein, and tape measure protein. https://app.cochat.ai/papers/10.1016/j.str.2025.03.007
- The paper
- Kizziah, J. L., Mukherjee, A., Parker, L. K., & Dokland, T. (2025). Structure of the Staphylococcus aureus bacteriophage 80α neck shows details of the DNA, tail completion protein, and tape measure protein. Structure. https://doi.org/10.1016/j.str.2025.03.007
Data sources
Bibliographic data: Semantic Scholar, OpenAlex, Crossref.
Contains information from the Semantic Scholar Academic Graph Datasets, made available under the ODC Attribution License (ODC-BY 1.0).
Semantic Scholar’s data is described in: Kinney, R., et al. (2023). The Semantic Scholar Open Data Platform. arXiv:2301.10140.
