

The DOI matches its Crossref record; 5 of the 5 references it cites were found in a registry or an index.
Classifying biophysical subpopulations of insulin secretory granules using quantitative whole-cell structure analysis
Open accessPublished version of a preprint
Abstract
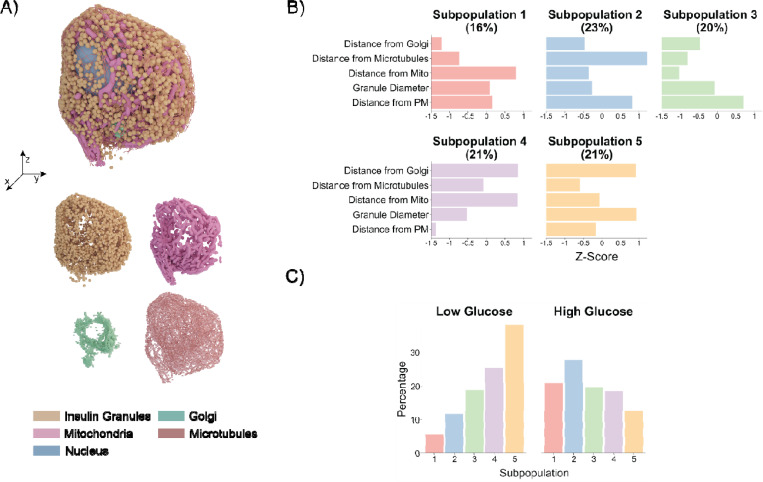
Pancreatic beta cells contain insulin secretory granules (ISGs), organelles where proinsulin is converted into insulin. As ISGs mature, they undergo extensive biophysical remodeling, producing a spectrum of subpopulations with heterogeneous molecular and spatial characteristics. However, systematic methods to define ISG subpopulations remain underdeveloped. To address this gap in knowledge, we employed soft X-ray tomography (SXT), which can quantitatively measure the biochemical density of ISGs within whole beta cells. Using unsupervised clustering, we classified subpopulations based on molecular density, size, and spatial positioning. Across different insulin secretory stimuli, we observed shifts toward mature and releasable subtypes, demonstrating that exogenous signals can dynamically remodel ISG subpopulation distributions. We extended this methodology to primary beta cells characterized using volume electron microscopy (vEM). Integrating subpopulations from SXT and vEM uncovered insights inaccessible by a single method in isolation. This strategy establishes a framework for defining therapeutic approaches aimed at enriching physiologically beneficial ISG subpopulations.
Overview
The claims and statistics of this paper haven’t been checked yet.
Run the check — free, no account needed. It reads the open-access text and checks the sources it cites.
Integrity signals
Registry
Cites
Statistics
Figures
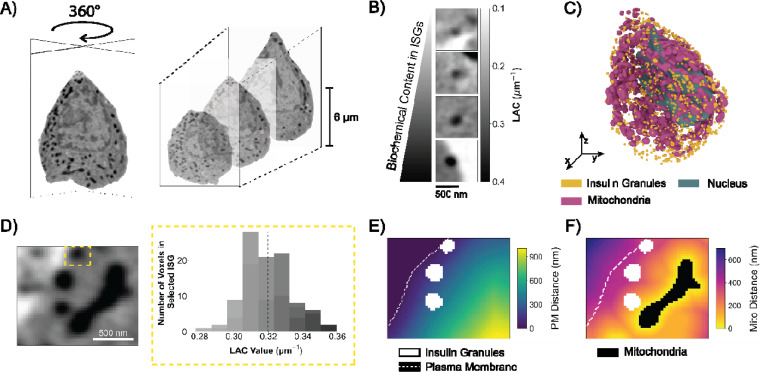
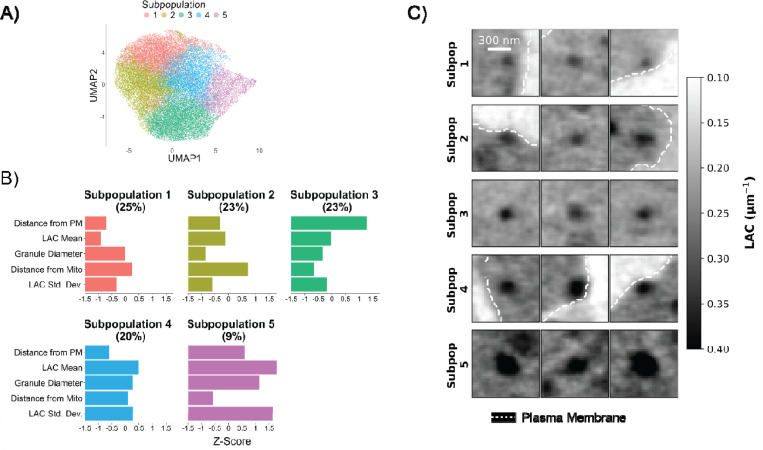
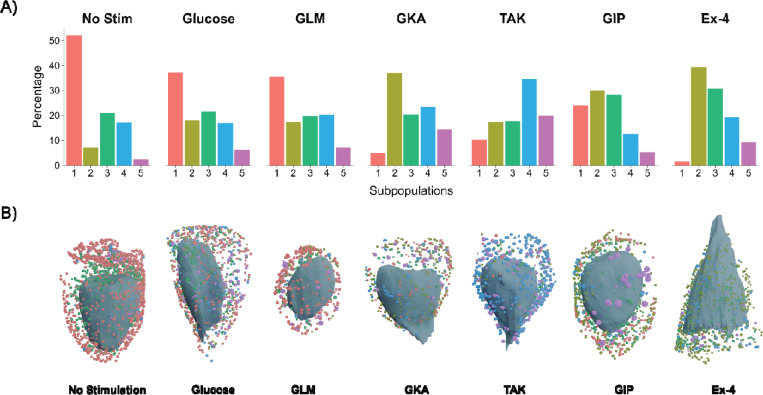
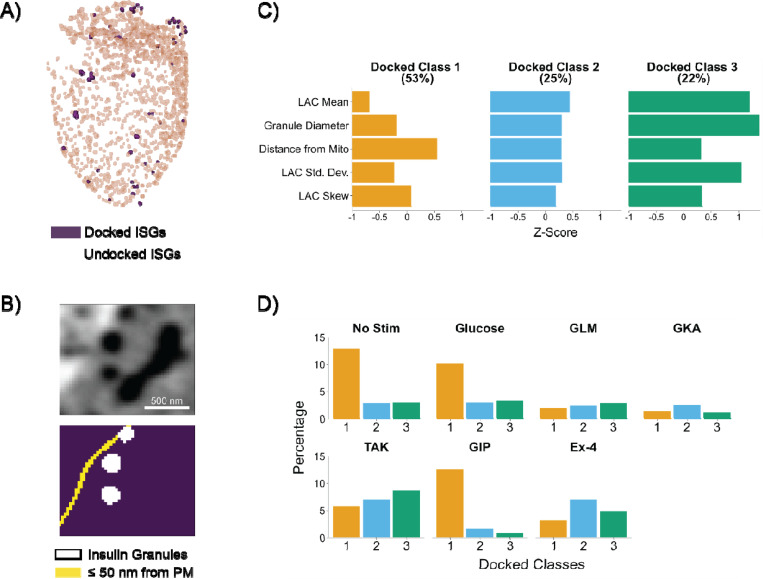
Verification
Claims the paper makes
The claims and statistics of this paper haven’t been checked yet.
Run the check — free, no account needed. It reads the open-access text and checks the sources it cites.
Self-check
Percentages, sums and reported differences re-computed from the paper’s own numbers.
The self-check needs the paper’s full text.
Citations
Cites
Deep Visual Proteomics defines single-cell identity and heterogeneity
Mund, A., Coscia, F., Kriston, A., Hollandi, R., Kovács, F., Brunner, A.-D., Migh, E., Schweizer, L., Santos, A., Bzorek, M., et al. (2022) · Nature Biotechnology · doi:10.1038/s41587-022-01302-5 · Cited by 562
Classification of electrophysiological and morphological neuron types in the mouse visual cortex
Gouwens, N. W., Sorensen, S. A., Berg, J., Lee, C., Jarsky, T., Ting, J., Sunkin, S. M., Feng, D., Anastassiou, C. A., Barkan, E., et al. (2019) · Nature Neuroscience · doi:10.1038/s41593-019-0417-0 · Cited by 456
Wang, Z., & Thurmond, D. C. (2009) · Journal of Cell Science · doi:10.1242/jcs.034355 · Cited by 386
Fast insulin secretion reflects exocytosis of docked granules in mouse pancreatic B-cells
Olofsson, C. S., Göpel, S. O., Barg, S., Galvanovskis, J., Ma, X., Salehi, A., Rorsman, P., & Eliasson, L. (2002) · Pflügers Archiv · doi:10.1007/s00424-002-0781-5 · Cited by 290
Integrated intracellular organization and its variations in human iPS cells
Viana, M. P., Chen, J., Knijnenburg, T. A., Vasan, R., Yan, C., Arakaki, J. E., Bailey, M., Berry, B., Borensztejn, A., Brown, E. M., et al. (2023) · Nature · doi:10.1038/s41586-022-05563-7 · Cited by 132
Research works printed but not linked: 69
- Macdonald, 2005, Glucose-sensing mechanisms in pancreatic β-cells, Philos. Trans. R. Soc. B, 360, 2211, 10.1098/rstb.2005.1762 · DOI
- Omar-Hmeadi, 2021, Insulin granule biogenesis and exocytosis, Cell. Mol. Life Sci., 78, 1957, 10.1007/s00018-020-03688-4 · DOI
- Germanos, 2021, Inside the Insulin Secretory Granule, Metabolites, 11, 515, 10.3390/metabo11080515 · DOI
- Lin, 2024, Decoding Insulin Secretory Granule Maturation Using Genetically Encoded pH Sensors, ACS Sens., 9, 6032, 10.1021/acssensors.4c01885 · DOI
- Yau, 2020, A fluorescent timer reporter enables sorting of insulin secretory granules by age, J. Biol. Chem., 295, 8901, 10.1074/jbc.RA120.012432 · DOI
- Hoboth, 2015, Aged insulin granules display reduced microtubule-dependent mobility and are disposed within actin-positive multigranular bodies, Proc. Natl. Acad. Sci. USA, 112, 667, 10.1073/pnas.1409542112 · DOI
- Neukam, 2024, Purification of time-resolved insulin granules reveals proteomic and lipidomic changes during granule aging, Cell Rep., 43, 10.1016/j.celrep.2024.113836 · DOI
- Kasai, 2008, Docking is not a prerequisite but a temporal constraint for fusion of secretory granules, Traffic, 9, 1191, 10.1111/j.1600-0854.2008.00744.x · DOI
- Yi, 2024, Distinct Sub- to Superdiffuse Insulin Granule Transport Behaviors in beta-Cells Are Strongly Affected by Granule Age, J. Phys. Chem. B, 128, 6246, 10.1021/acs.jpcb.4c01403 · DOI
- Hickey, 2009, Proteins associated with immunopurified granules from a model pancreatic islet beta-cell system: proteomic snapshot of an endocrine secretory granule, J. Proteome Res., 8, 178, 10.1021/pr800675k · DOI
- Norris, 2024, Optimized Proteomic Analysis of Insulin Granules From MIN6 Cells Identifies Scamp3, a Novel Regulator of Insulin Secretion and Content, Diabetes, 73, 2045, 10.2337/db24-0355 · DOI
- Kreutzberger, 2020, Distinct insulin granule subpopulations implicated in the secretory pathology of diabetes types 1 and 2, eLife, 9, 10.7554/eLife.62506 · DOI
- Huang, 2021, Defective insulin maturation in patients with type 2 diabetes, Eur. J. Endocrinol., 185, 565, 10.1530/EJE-21-0144 · DOI
- Yau, 2021, Targeting the insulin granule for modulation of insulin exocytosis, Biochem. Pharmacol., 194, 10.1016/j.bcp.2021.114821 · DOI
- Rafelski, 2008, Building the cell: design principles of cellular architecture, Nat. Rev. Mol. Cell Biol., 9, 593, 10.1038/nrm2460 · DOI
- Mirvis, 2026, A scoping study of the whole-cell imaging literature: a foundational corpus, potential for mesoscale data synthesis, and implications for standardization of an emerging field., BMC Biology., 24, 91, 10.1186/s12915-026-02556-0 · DOI
- Barekatain, 2024, Insulator-based dielectrophoresis-assisted separation of insulin secretory vesicles, eLife, 13, 10.7554/eLife.74989 · DOI
- Loconte, 2022, Soft X-ray tomography to map and quantify organelle interactions at the mesoscale, Structure, 30, 510, 10.1016/j.str.2022.01.006 · DOI
- White, 2020, Visualizing subcellular rearrangements in intact beta cells using soft x-ray tomography, Sci. Adv., 6, 10.1126/sciadv.abc8262 · DOI
- Deshmukh, 2024, Subcellular Feature-Based Classification of alpha and beta Cells Using Soft X-ray Tomography, Cells, 13, 869, 10.3390/cells13100869 · DOI
- Chen, 2022, A protocol for full-rotation soft X-ray tomography of single cells, STAR Protoc., 3, 10.1016/j.xpro.2022.101176 · DOI
- Do, 2015, Imaging and characterizing cells using tomography, Arch. Biochem. Biophys., 581, 111, 10.1016/j.abb.2015.01.011 · DOI
- Deshmukh, 2025, Secretory stimuli distinctly regulate insulin secretory granule maturation through structural remodeling, Structure, 33, 1831, 10.1016/j.str.2025.07.022 · DOI · Paper page
- Lee, 2024, Quantitative subcellular reconstruction reveals a lipid mediated inter-organelle biogenesis network, Nat. Cell Biol., 26, 57, 10.1038/s41556-023-01297-4 · DOI
- Cho, 2022, OpenCell: Endogenous tagging for the cartography of human cellular organization, Science, 375, 10.1126/science.abi6983 · DOI · Paper page
- Pfeifer, 2015, Quantitative analysis of mouse pancreatic islet architecture by serial block-face SEM, J. Struct. Biol., 189, 44, 10.1016/j.jsb.2014.10.013 · DOI
- Müller, 2021, 3D FIB-SEM reconstruction of microtubule-organelle interaction in whole primary mouse beta cells, J. Cell Biol., 220, 10.1083/jcb.202010039 · DOI
- Rao, 2020, Determination of secretory granule maturation times in pancreatic islet β-cells by serial block-face electron microscopy, J. Struct. Biol., 212, 10.1016/j.jsb.2020.107584 · DOI
- Autin, 2022, Integrative structural modelling and visualisation of a cellular organelle, QRB Discov., 3, e11, 10.1017/qrd.2022.10 · DOI
- Hennig, 2007, Cluster-wise assessment of cluster stability, Comput. Stat. Data Anal., 52, 258, 10.1016/j.csda.2006.11.025 · DOI · Paper page
- Fortunato, 2016, Community detection in networks: A user guide, Phys. Rep., 659, 1, 10.1016/j.physrep.2016.09.002 · DOI · Paper page
- Schlegel, 2024, Whole-brain annotation and multi-connectome cell typing of Drosophila, Nature, 634, 139, 10.1038/s41586-024-07686-5 · DOI · Paper page
- Zhang, 2020, Visualizing insulin vesicle neighborhoods in beta cells by cryo-electron tomography, Sci. Adv., 6, 10.1126/sciadv.abc8258 · DOI
- Müller, 2017, A 4D view on insulin secretory granule turnover in the beta-cell, Diabetes Obes. Metabol., 19, 107, 10.1111/dom.13015 · DOI
- Proks, 2002, Sulfonylurea stimulation of insulin secretion, Diabetes, 51, 368, 10.2337/diabetes.51.2007.S368 · DOI · Paper page
- Haddad, 2024, New-Generation Glucokinase Activators: Potential Game-Changers in Type 2 Diabetes Treatment, Int. J. Mol. Sci., 25, 571, 10.3390/ijms25010571 · DOI
- Sakuma, 2016, Fasiglifam (TAK-875) has dual potentiating mechanisms via Galphaq-GPR40/FFAR1 signaling branches on glucose-dependent insulin secretion, Pharmacol. Res. Perspect., 4, 10.1002/prp2.237 · DOI
- Negoro, 2010, Discovery of TAK-875: A Potent, Selective, and Orally Bioavailable GPR40 Agonist, ACS Med. Chem. Lett., 1, 290, 10.1021/ml1000855 · DOI
- Burant, 2013, Activation of GPR40 as a therapeutic target for the treatment of type 2 diabetes, Diabetes Care, 36, 175, 10.2337/dcS13-2037 · DOI
- Seino, 2010, GIP and GLP-1, the two incretin hormones: Similarities and differences, J. Diabetes Investig., 1, 8, 10.1111/j.2040-1124.2010.00022.x · DOI · Paper page
- Gomi, 2005, Granuphilin molecularly docks insulin granules to the fusion machinery, J. Cell Biol., 171, 99, 10.1083/jcb.200505179 · DOI
- Gaisano, 2014, Here come the newcomer granules, better late than never, Trends Endocrinol. Metabol., 25, 381, 10.1016/j.tem.2014.03.005 · DOI · Paper page
- Izumi, 2023, Multiple pathways and independent functional pools in insulin granule exocytosis, Genes Cells, 28, 471, 10.1111/gtc.13029 · DOI
- Gilbert, 2018, Development and validation of a Hospital Frailty Risk Score focusing on older people in acute care settings using electronic hospital records: an observational study, Lancet, 391, 1775, 10.1016/S0140-6736(18)30668-8 · DOI
- Gower, 1971, A General Coefficient of Similarity and Some of Its Properties, Biometrics, 27, 857, 10.2307/2528823 · DOI
- Potdar, 2025, Pancreatic β cell models for screening insulin secretagogues and cytotoxicity, J. Appl. Toxicol., 45, 89, 10.1002/jat.4658 · DOI
- Topalidou, 2020, EIPR1 controls dense-core vesicle cargo retention and EARP complex localization in insulin-secreting cells, Mol. Biol. Cell, 31, 59, 10.1091/mbc.E18-07-0469 · DOI
- Lucocq, 2015, Systems biology in 3D space – enter the morphome, Trends Cell Biol., 25, 59, 10.1016/j.tcb.2014.09.008 · DOI
- Son, 2024, Morphomics via next-generation electron microscopy, J. Mol. Cell Biol., 15, 10.1093/jmcb/mjad081 · DOI
- Unterauer, 2024, Spatial proteomics in neurons at single-protein resolution, Cell, 187, 1785, 10.1016/j.cell.2024.02.045 · DOI
- Wang, 2021, Live-cell imaging of glucose-induced metabolic coupling of beta and alpha cell metabolism in health and type 2 diabetes. Commun, Biol., 4, 594
- Kravčenko, 2024, Molecular architecture of synaptic vesicles, Proc. Natl. Acad. Sci. USA, 121, 10.1073/pnas.2407375121 · DOI · Paper page
- Rosengren, 2008, Why Treatment Fails in Type 2 Diabetes, PLoS Med., 5, 10.1371/journal.pmed.0050215 · DOI
- Fahy, 2024, Laboratory based correlative cryo-soft X-ray tomography and cryo-fluorescence microscopy, Methods Cell Biol., 187, 293, 10.1016/bs.mcb.2024.02.033 · DOI
- Kievits, 2022, How innovations in methodology offer new prospects for volume electron microscopy, J. Microsc., 287, 114, 10.1111/jmi.13134 · DOI
- Kremer, 1996, Computer visualization of three-dimensional image data using IMOD, J. Struct. Biol., 116, 71, 10.1006/jsbi.1996.0013 · DOI
- Erozan, 2024, Automated 3D cytoplasm segmentation in soft X-ray tomography, iScience, 27, 10.1016/j.isci.2024.109856 · DOI
- Parkinson, 2012, Automatic alignment and reconstruction of images for soft X-ray tomography, J. Struct. Biol., 177, 259, 10.1016/j.jsb.2011.11.027 · DOI
- Van der Walt, 2014, scikit-image: image processing in Python, PeerJ, 2, 10.7717/peerj.453 · DOI
- McInnes, 2018, Umap: Uniform manifold approximation and projection for dimension reduction, arXiv
- Becht, 2018, Dimensionality reduction for visualizing single-cell data using UMAP, Nat. Biotechnol., 37, 38, 10.1038/nbt.4314 · DOI · Paper page
- Wickham, 2011, ggplot2, WIREs Computational Stats., 3, 180, 10.1002/wics.147 · DOI
- D’Orazio, 2015, Integration and imputation of survey data in R: the StatMatch package, Romanian Statistical Review, 63, 57
- Dixon, 2003, VEGAN, a package of R functions for community ecology, J. Veg. Sci., 14, 927, 10.1111/j.1654-1103.2003.tb02228.x · DOI
- Suckale, 2010, The insulin secretory granule as a signaling hub, Trends Endocrinol. Metabol., 21, 599, 10.1016/j.tem.2010.06.003 · DOI · Paper page
- Ahlqvist, 2018, Novel subgroups of adult-onset diabetes and their association with outcomes: a data-driven cluster analysis of six variables, Lancet Diabetes Endocrinol., 6, 361, 10.1016/S2213-8587(18)30051-2 · DOI · Paper page
- Whitaker, 2022, Persistent COVID-19 symptoms in a community study of 606,434 people in England, Nat. Commun., 13, 1957, 10.1038/s41467-022-29521-z · DOI
- Wagner, 2021, Pathophysiology-based subphenotyping of individuals at elevated risk for type 2 diabetes, Nat. Med., 27, 49, 10.1038/s41591-020-1116-9 · DOI · Paper page
- Hammarlund, 2007, Open Syntaxin Docks Synaptic Vesicles, PLoS Biol., 5, 10.1371/journal.pbio.0050198 · DOI
Metadata
- Authors
- Chang, K., Deshmukh, A., Verma, R., Loconte, V., & White, K. L.
- Affiliations
- University of Southern California (US)
- Corresponding author
- White, Kate L.
- Venue
- Structure
- Publisher
- Elsevier BV
- Published
- 2026-06
- Volume
- 34
- Issue
- 6
- Pages
- 977-987.e2
- ISSN
- 0969-2126 (ISSN-L)
- PMC
- PMC12458229
- OpenAlex
- W4414255444
- Cited by
- 3
- References
- 5
- Citations by year
- 2026: 3
- FWCI
- 19.05
- Type
- journal article
- Language
- en
- Open access
- hybrid
- doi.org
- Licence
- Locations
- Structure (publishedVersion, cc-by)
- bioRxiv (Cold Spring Harbor Laboratory) (acceptedVersion, cc-by-nc-nd)
- PubMed (publishedVersion)
- PubMed Central (publishedVersion, cc-by-nc-nd)
- eScholarship (California Digital Library) (submittedVersion, cc-by)
- Europe PMC (PubMed Central) (submittedVersion, cc-by-nc-nd)
- Funders
- National Institutes of Health
- National Institute of General Medical Sciences (R35GM154893, P30GM138441)
- Topics
- Health Sciences › Medicine › Endocrinology, Diabetes and Metabolism › Pancreatic function and diabetes
- Life Sciences › Biochemistry, Genetics and Molecular Biology › Cell Biology › Cellular transport and secretion
- Physical Sciences › Physics and Astronomy › Radiation › Advanced X-ray Imaging Techniques
- Keywords
- insulin secretory granules, pancreatic beta cells, secretory granule maturation, soft X-ray tomography, volume electron microscopy, unsupervised clustering, proinsulin processing, insulin secretion
About these checks
Registry, retraction, Cites and statistics results are computed, not judged, with one exception: a printed reference that no index lists is read once by a model before it counts as a citation error. Claims are extracted by a model and kept only when their quote appears verbatim in the text; each cited source is then checked, with a model’s help, for whether it says what the claim relies on. Those verdicts can be wrong — read the claim’s quote and the cited source before relying on one.
Statistics and arithmetic are recomputed, not judged.
Confidence bands are shown only for fields calibrated on our annotated test set. None is calibrated yet, so no band is shown.
What counts as a claim ›How we measure confidence ›How we check this ›
Are you an author, or do you see a problem with this page? Request a review
How to cite
Cite CoChat for the checks on this page, and the paper for its own findings.
- This page
- CoChat. (2026). Citation check: Classifying biophysical subpopulations of insulin secretory granules using quantitative whole-cell structure analysis. https://app.cochat.ai/papers/10.1016/j.str.2026.03.005
- The paper
- Chang, K., Deshmukh, A., Verma, R., Loconte, V., & White, K. L. (2026). Classifying biophysical subpopulations of insulin secretory granules using quantitative whole-cell structure analysis. Structure. https://doi.org/10.1016/j.str.2026.03.005
