

The DOI matches its Crossref record; 68 of the 69 references it cites were found in a registry or an index.
A Comprehensive Immunologic Portrait of Triple-Negative Breast Cancer
Open accessPublished version of a preprint
Abstract
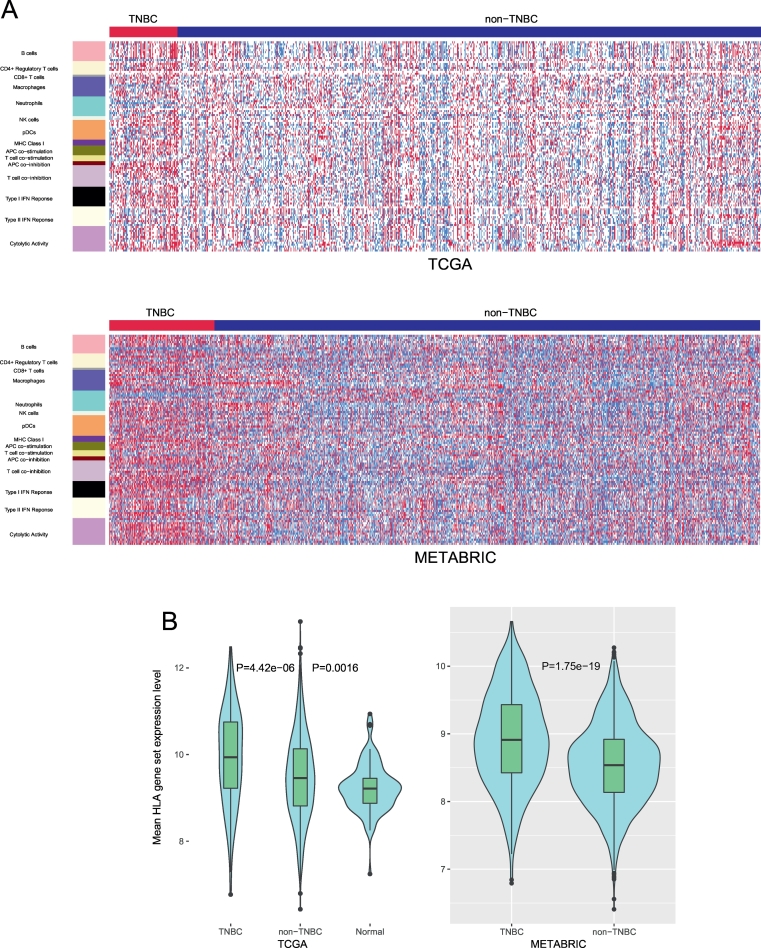
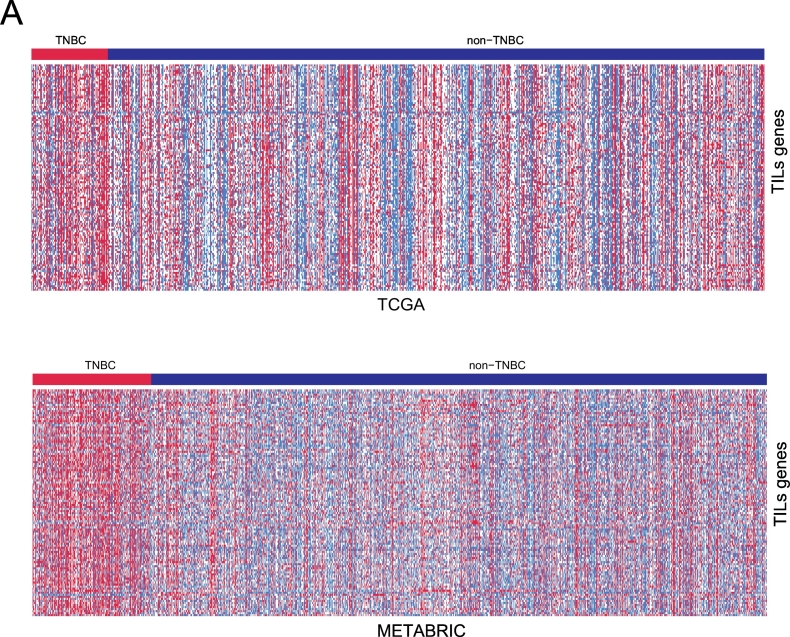
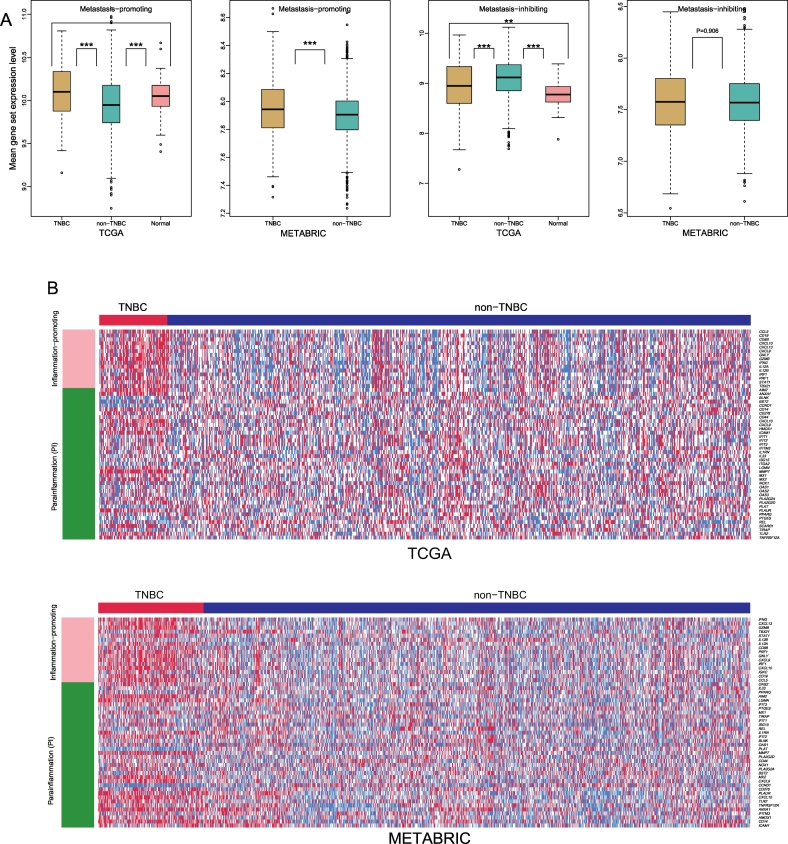
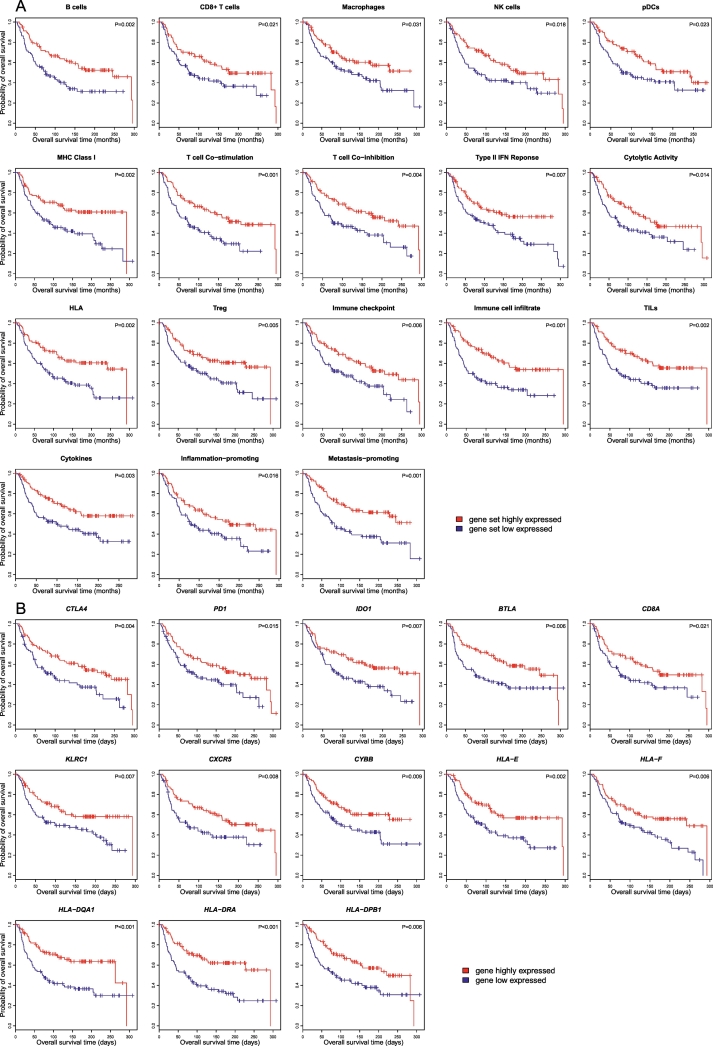
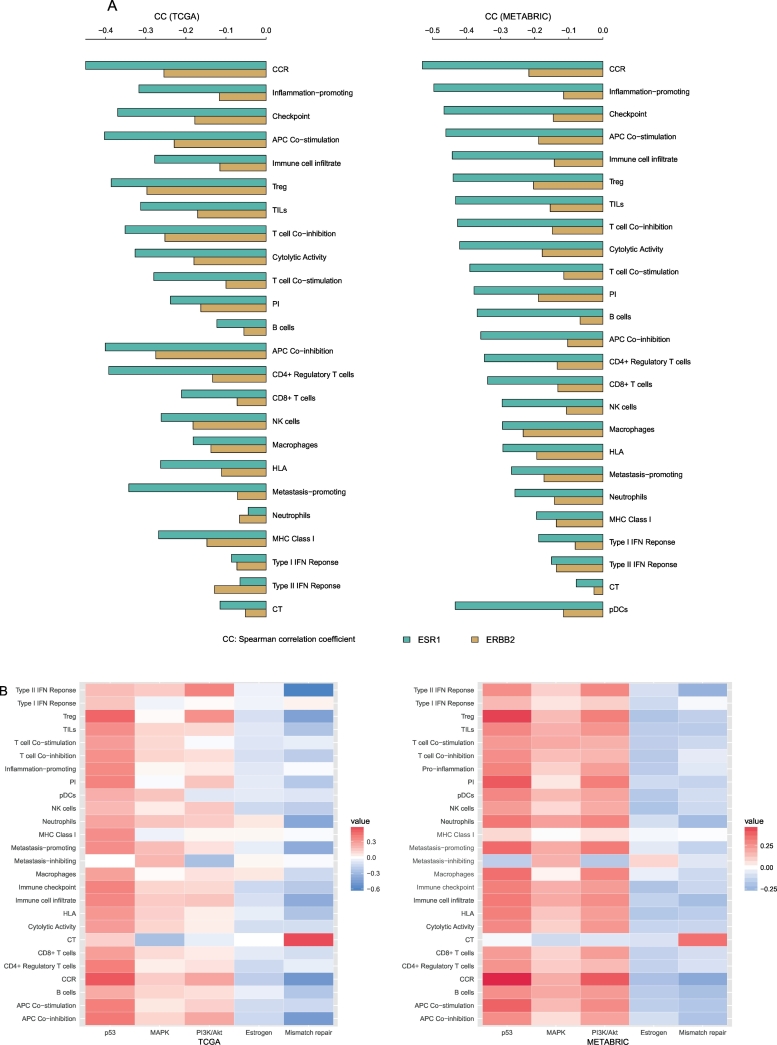
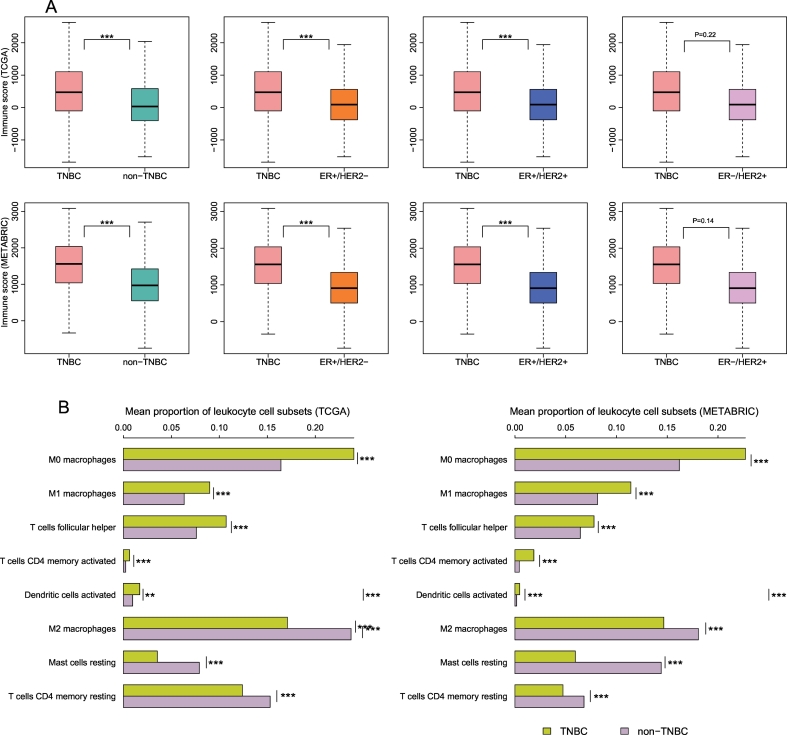
Abstract Background Triple-negative breast cancer (TNBC) is a high-risk malignancy due to its high capacity for invasion and lack of targeted therapy. Immunotherapy continues to demonstrate efficacy in a variety of cancers, and thus may be a promising strategy for TNBC given the limited therapeutic options currently available for TNBC. In this study, we performed a comprehensive portrait of immunologic landscape of TNBC based on 2 large-scale breast cancer genomic data. Methods We compared expression levels of immune-related genes and gene-sets among TNBC, non-TNBC, and normal tissue, and within TNBCs of different genotypic or phenotypic features. Moreover, we explored the association of immune-related genes or gene-sets expression and survival prognosis in TNBC patients. Results We found that almost all analyzed immune-related gene-sets had significantly higher expression levels in TNBC than non-TNBC. These highly expressed gene-sets in TNBC included 15 immune cell type and function, human leukocyte antigen (HLA), cancer testis (CT), tumor-infiltrating lymphocytes (TILs), immune cell infiltrate, regulatory T (Treg) cells, immune checkpoint, cytokine and cytokine receptor, metastasis-promoting, pro-inflammatory and parainflammation (PI) gene-sets. Moreover, TP53-mutated , TNBC had significantly higher expression levels of the immune checkpoint, Treg, PI, and CT gene-sets, and lower expression levels of the immune cell infiltrate gene-set than TP53 -wildtype TNBC. Furthermore, we found that elevated expression of most of the immune-related genes in TNBC was associated with the ER-status, while some were associated with both ER-and HER2-status. Elevated expression of the immune-related genes in TNBC was also associated with the high tumor mutation burden (TMB) in TNBC. Finally, elevated expression of the immune-related gene-sets was likely to be associated with better survival prognosis in TNBC. Conclusions Our findings suggest that TNBC is a breast cancer subtype with particularly strong immunogenicity, and therefore could be propitious to immunotherapeutic options.
Overview
The claims and statistics of this paper haven’t been checked yet.
Run the check — free, no account needed. It reads the open-access text and checks the sources it cites.
Integrity signals
Registry
Cites
Statistics
Figures
Verification
Claims the paper makes
The claims and statistics of this paper haven’t been checked yet.
Run the check — free, no account needed. It reads the open-access text and checks the sources it cites.
Claims other papers make about this one
Each is checked against this paper’s own text: does it say what the citing paper says it does?
In the citing paper
“Paradoxically, despite strong immunogenicity and a higher prevalence of tumor-infiltrating lymphocytes (TILs) in TNBC3, patients often progress to metastasis with poor clinical outcomes1.”
Self-check
Percentages, sums and reported differences re-computed from the paper’s own numbers.
The self-check needs the paper’s full text.
Citations
Cites
Controlling the False Discovery Rate: A Practical and Powerful Approach to Multiple Testing
Benjamini, Y., & Hochberg, Y. (1995) · Journal of the Royal Statistical Society Series B: Statistical Methodology · doi:10.1111/j.2517-6161.1995.tb02031.x · Cited by 109,482
Siegel, R. L., Miller, K. D., & Jemal, A. (2017) · CA: A Cancer Journal for Clinicians · doi:10.3322/caac.21387 · Cited by 14,712
Robust enumeration of cell subsets from tissue expression profiles
Newman, A. M., Liu, C. L., Green, M. R., Gentles, A. J., Feng, W., Xu, Y., Hoang, C. D., Diehn, M., & Alizadeh, A. A. (2015) · Nature Methods · doi:10.1038/nmeth.3337 · Cited by 13,224
Comprehensive molecular portraits of human breast tumours
The Cancer Genome Atlas Network (2012) · Nature · doi:10.1038/nature11412 · Cited by 12,129
Immunity, Inflammation, and Cancer
Grivennikov, S. I., Greten, F. R., & Karin, M. (2010) · Cell · doi:10.1016/j.cell.2010.01.025 · Cited by 10,755
Inferring tumour purity and stromal and immune cell admixture from expression data
Yoshihara, K., Shahmoradgoli, M., Martínez, E., Vegesna, R., Kim, H., Torres-Garcia, W., Treviño, V., Shen, H., Laird, P. W., Levine, D. A., et al. (2013) · Nature Communications · doi:10.1038/ncomms3612 · Cited by 9,778
PD-1 Blockade in Tumors with Mismatch-Repair Deficiency
Le, D. T., Uram, J. N., Wang, H., Bartlett, B. R., Kemberling, H., Eyring, A. D., Skora, A. D., Luber, B. S., Azad, N. S., Laheru, D., et al. (2015) · New England Journal of Medicine · doi:10.1056/nejmoa1500596 · Cited by 9,377
Combined Nivolumab and Ipilimumab or Monotherapy in Untreated Melanoma
Larkin, J., Chiarion-Sileni, V., Gonzalez, R., Grob, J. J., Cowey, C. L., Lao, C. D., Schadendorf, D., Dummer, R., Smylie, M., Rutkowski, P., et al. (2015) · New England Journal of Medicine · doi:10.1056/nejmoa1504030 · Cited by 8,157
Mutational landscape determines sensitivity to PD-1 blockade in non–small cell lung cancer
Rizvi, N. A., Hellmann, M. D., Snyder, A., Kvistborg, P., Makarov, V., Havel, J. J., Lee, W., Yuan, J., Wong, P., Ho, T. S., et al. (2015) · Science · doi:10.1126/science.aaa1348 · Cited by 7,802
Herbst, R. S., Baas, P., Kim, D.-W., Felip, E., Pérez-Gracia, J. L., Han, J.-Y., Molina, J., Kim, J.-H., Arvis, C. D., Ahn, M.-J., et al. (2016) · The Lancet · doi:10.1016/s0140-6736(15)01281-7 · Cited by 6,449
The genomic and transcriptomic architecture of 2,000 breast tumours reveals novel subgroups
METABRIC Group, Curtis, C., Shah, S. P., Chin, S.-F., Turashvili, G., Rueda, O. M., Dunning, M. J., Speed, D., Lynch, A. G., Samarajiwa, S., et al. (2012) · Nature · doi:10.1038/nature10983 · Cited by 6,097
Lehmann, B. D., Bauer, J. A., Chen, X., Sanders, M. E., Chakravarthy, A. B., Shyr, Y., & Pietenpol, J. A. (2011) · Journal of Clinical Investigation · doi:10.1172/jci45014 · Cited by 5,592
The future of immune checkpoint therapy
Sharma, P., & Allison, J. P. (2015) · Science · doi:10.1126/science.aaa8172 · Cited by 4,878
Spatiotemporal Dynamics of Intratumoral Immune Cells Reveal the Immune Landscape in Human Cancer
Bindea, G., Mlecnik, B., Tosolini, M., Kirilovsky, A., Waldner, M. J., Obenauf, A. C., Angell, H. K., Fredriksen, T., Lafontaine, L., Berger, A., et al. (2013) · Immunity · doi:10.1016/j.immuni.2013.10.003 · Cited by 4,455
Genetic Basis for Clinical Response to CTLA-4 Blockade in Melanoma
Snyder, A., Makarov, V., Merghoub, T., Yuan, J., Zaretsky, J. M., Desrichard, A., Walsh, L. A., Postow, M. A., Wong, P., Ho, T. S., et al. (2014) · New England Journal of Medicine · doi:10.1056/nejmoa1406498 · Cited by 4,286
Immune Checkpoint Blockade: A Common Denominator Approach to Cancer Therapy
Topalian, S. L., Drake, C. G., & Pardoll, D. M. (2015) · Cancer Cell · doi:10.1016/j.ccell.2015.03.001 · Cited by 4,229
Systematic RNA interference reveals that oncogenic KRAS-driven cancers require TBK1
Barbie, D. A., Tamayo, P., Boehm, J. S., Kim, S. Y., Moody, S. E., Dunn, I. F., Schinzel, A. C., Sandy, P., Meylan, E., Scholl, C., et al. (2009) · Nature · doi:10.1038/nature08460 · Cited by 3,922
Molecular and genetic properties of tumors associated with local immune cytolytic activity
Rooney, M. S., Shukla, S. A., Wu, C. J., Getz, G., & Hacohen, N. (2015) · Cell · doi:10.1016/j.cell.2014.12.033 · Cited by 3,825
Genomic and Transcriptomic Features of Response to Anti-PD-1 Therapy in Metastatic Melanoma
Hugo, W., Zaretsky, J. M., Sun, L., Song, C., Moreno, B. H., Hu-Lieskovan, S., Berent-Maoz, B., Pang, J., Chmielowski, B., Cherry, G., et al. (2016) · Cell · doi:10.1016/j.cell.2016.02.065 · Cited by 3,448
Genomic correlates of response to CTLA-4 blockade in metastatic melanoma
Van Allen, E. M., Miao, D., Schilling, B., Shukla, S. A., Blank, C., Zimmer, L., Sucker, A., Hillen, U., Geukes Foppen, M. H., Goldinger, S. M., et al. (2015) · Science · doi:10.1126/science.aad0095 · Cited by 2,839
Adoptive cell transfer as personalized immunotherapy for human cancer
Rosenberg, S. A., & Restifo, N. P. (2015) · Science · doi:10.1126/science.aaa4967 · Cited by 2,545
Regulatory T cells in cancer immunotherapy
Tanaka, A., & Sakaguchi, S. (2017) · Cell Research · doi:10.1038/cr.2016.151 · Cited by 1,860
Denkert, C., Loibl, S., Noske, A., Roller, M., Müller, B. M., Komor, M., Budczies, J., Darb‐Esfahani, S., Kronenwett, R., Hanusch, C. A., et al. (2009) · Journal of Clinical Oncology · doi:10.1200/jco.2009.23.7370 · Cited by 1,796
Pereira, B., Chin, S., Rueda, O. M., Vollan, H. K. M., Provenzano, E., Bardwell, H. A., Pugh, M., Jones, L. R., Russell, R., Sammut, S., et al. (2016) · Nature Communications · doi:10.1038/ncomms11479 · Cited by 1,752
Pembrolizumab in Patients With Advanced Triple-Negative Breast Cancer: Phase Ib KEYNOTE-012 Study
Nanda, R., Chow, L. Q. M., Dees, E. C., Berger, R., Gupta, S., Geva, R., Pusztai, L., Pathiraja, K., Aktan, G., Cheng, J. D., et al. (2016) · Journal of Clinical Oncology · doi:10.1200/jco.2015.64.8931 · Cited by 1,477
Anti–PD-1/PD-L1 therapy of human cancer: past, present, and future
Chen, L., & Han, X. N. (2015) · Journal of Clinical Investigation · doi:10.1172/jci80011 · Cited by 1,455
Adams, S., Gray, R. J., Demaria, S., Goldstein, L. J., Perez, E. A., Shulman, L. N., Martino, S., Wang, M., Jones, V. E., Saphner, T. J., et al. (2014) · Journal of Clinical Oncology · doi:10.1200/jco.2013.55.0491 · Cited by 1,313
ppcor: An R Package for a Fast Calculation to Semi-partial Correlation Coefficients
Kim, S. (2015) · Communications for Statistical Applications and Methods · doi:10.5351/csam.2015.22.6.665 · Cited by 1,106
Bracci, L., Schiavoni, G., Sistigu, A., & Belardelli, F. (2013) · Cell Death and Differentiation · doi:10.1038/cdd.2013.67 · Cited by 951
Combination cancer immunotherapies tailored to the tumour microenvironment
Smyth, M. J., Ngiow, S. F., Ribas, A., & Teng, M. W. L. (2016) · Nature Reviews Clinical Oncology · doi:10.1038/nrclinonc.2015.209 · Cited by 944
Selective Stimulation of T Cell Subsets with Antibody-Cytokine Immune Complexes
Boyman, O., Kovář, M., Rubinstein, M., Surh, C., & Sprent, J. (2006) · Science · doi:10.1126/science.1122927 · Cited by 940
Cytokine patterns in patients with cancer: a systematic review
Lippitz, B. E. (2013) · The Lancet Oncology · doi:10.1016/s1470-2045(12)70582-x · Cited by 922
Regulatory T Cells Exhibit Distinct Features in Human Breast Cancer
Plitas, G., Konopacki, C., Wu, K., Bos, P. D., Morrow, M., Putintseva, E. V., Chudakov, D. M., & Rudensky, A. Y. (2016) · Immunity · doi:10.1016/j.immuni.2016.10.032 · Cited by 695
De Simone, M., Arrigoni, A., Rossetti, G., Gruarin, P., Ranzani, V., Politano, C., Bonnal, R. J. P., Provasi, E., Sarnicola, M. L., Panzeri, I., et al. (2016) · Immunity · doi:10.1016/j.immuni.2016.10.021 · Cited by 687
Development of immuno-oncology drugs — from CTLA4 to PD1 to the next generations
Hoos, A. (2016) · Nature Reviews Drug Discovery · doi:10.1038/nrd.2015.35 · Cited by 601
Cancer/testis (CT) antigens: Potential targets for immunotherapy
Caballero, O. L., & Chen, Y. (2009) · Cancer Science · doi:10.1111/j.1349-7006.2009.01303.x · Cited by 554
CTdatabase: a knowledge-base of high-throughput and curated data on cancer-testis antigens
de Almeida, L. G. P., Sakabe, N. J., deOliveira, A. R., da Silva, M. C. C., Mundstein, A. S., Cohen, T., Chen, Y., Chua, R., Gurung, S., Gnjatic, S., et al. (2008) · Nucleic Acids Research · doi:10.1093/nar/gkn673 · Cited by 436
Hartman, Z. C., Poage, G. M., den Hollander, P., Tsimelzon, A. I., Hill, J. L., Panupinthu, N., Zhang, Y., Mazumdar, A., Hilsenbeck, S. G., Mills, G. B., et al. (2013) · Cancer Research · doi:10.1158/0008-5472.can-12-4524-t · Cited by 416
The p53 pathway in breast cancer
Gasco, M., Shami, S. K., & Crook, T. (2002) · Breast Cancer Research · doi:10.1186/bcr426 · Cited by 410
Understanding and treating triple-negative breast cancer
Carey, L., & Anders, C. (2021) · PubMed · doi:10.17615/85ph-f542 · Cited by 348
New Strategies for Triple-Negative Breast Cancer—Deciphering the Heterogeneity
Mayer, I. A., Abramson, V. G., Lehmann, B. D., & Pietenpol, J. A. (2014) · Clinical Cancer Research · doi:10.1158/1078-0432.ccr-13-0583 · Cited by 320
The PI‐3 kinase/Akt pathway and T cell activation: pleiotropic pathways downstream of PIP3
Kane, L., & Weiss, A. (2003) · Immunological Reviews · doi:10.1034/j.1600-065x.2003.00008.x · Cited by 262
Genome-wide in vivo screen identifies novel host regulators of metastatic colonization
Sanger Mouse Genetics Project, van der Weyden, L., Arends, M. J., Campbell, A. D., Bald, T., Wardle‐Jones, H., Griggs, N., Velasco‐Herrera, M. D. C., Tüting, T., Sansom, O. J., et al. (2017) · Nature · doi:10.1038/nature20792 · Cited by 228
Svoronos, N., Perales‐Puchalt, A., Allegrezza, M. J., Rutkowski, M. R., Payne, K. K., Tesone, A. J., Nguyen, J. M., Curiel, T. J., Cadungog, M. G., Singhal, S. K., et al. (2016) · Cancer Discovery · doi:10.1158/2159-8290.cd-16-0502 · Cited by 220
Emens, L. A., Braiteh, F. S., Cassier, P. A., Delord, J., Eder, J. P., Fassò, M., Xiao, Y., Wang, Y., Molinero, L. L., Chen, D. S., et al. (2015) · Cancer Research · doi:10.1158/1538-7445.am2015-2859 · Cited by 211
Genomic Approaches to Understanding Response and Resistance to Immunotherapy
Braun, D. A., Burke, K. P., & Allen, E. M. V. (2016) · Clinical Cancer Research · doi:10.1158/1078-0432.ccr-16-0066 · Cited by 178
Guo, G., Yu, M., Xiao, W., Celis, E., & Cui, Y. (2017) · Cancer Research · doi:10.1158/0008-5472.can-16-2832 · Cited by 168
Traina, T. A., Miller, K. D., Yardley, D. A., O’Shaughnessy, J., Cortés, J., Awada, A. H., Kelly, C. M., Trudeau, M., Schmid, P., Gianni, L., et al. (2015) · Journal of Clinical Oncology · doi:10.1200/jco.2015.33.15_suppl.1003 · Cited by 164
Immune Gene Expression Is Associated with Genomic Aberrations in Breast Cancer
Safonov, A. M., Jiang, T., Bianchini, G., Győrffy, B., Karn, T., Hatzis, C., & Pusztai, L. (2017) · Cancer Research · doi:10.1158/0008-5472.can-16-3478 · Cited by 153
Molecularly targeted therapies for metastatic triple-negative breast cancer
Bayraktar, S., & Glück, S. (2013) · Breast Cancer Research and Treatment · doi:10.1007/s10549-013-2421-5 · Cited by 146
Hix, L. M., Karavitis, J., Khan, M. W., Shi, Y. H., Khazaie, K., & Zhang, M. (2013) · Journal of Biological Chemistry · doi:10.1074/jbc.m112.441402 · Cited by 134
Bertucci, F., Ueno, N. T., Finetti, P., Vermeulen, P. B., Lucci, A., Robertson, F. M., Marsan, M., Iwamoto, T., Krishnamurthy, S., Masuda, H., et al. (2013) · Annals of Oncology · doi:10.1093/annonc/mdt496 · Cited by 117
Prognostic and predictive immune gene signatures in breast cancer
Bedognetti, D., Hendrickx, W., Marincola, F. M., & Miller, L. D. (2015) · Current Opinion in Oncology · doi:10.1097/cco.0000000000000234 · Cited by 106
Wheler, J. J., Jankú, F., Naing, A., Li, Y., Stephen, B., Zinner, R., Subbiah, V., Fu, S., Karp, D. D., Falchook, G. S., et al. (2016) · Molecular Cancer Therapeutics · doi:10.1158/1535-7163.mct-16-0196 · Cited by 106
Widespread parainflammation in human cancer
Aran, D., Lasry, A., Zinger, A., Biton, M., Pikarsky, E., Hellman, A., Butte, A. J., & Ben‐Neriah, Y. (2016) · Genome biology · doi:10.1186/s13059-016-0995-z · Cited by 104
Immunogenic Subtypes of Breast Cancer Delineated by Gene Classifiers of Immune Responsiveness
Miller, L. D., Chou, J., Black, M. A., Print, C. G., Chifman, J., Alistar, A. T., Putti, T. C., Zhou, X., Bedognetti, D., Hendrickx, W., et al. (2016) · Cancer Immunology Research · doi:10.1158/2326-6066.cir-15-0149 · Cited by 101
Renaud, S., Pugacheva, E. M., Delgado, M. D., Braunschweig, R., Abdullaev, Z., Loukinov, D. I., Benhattar, J., & Lobanenkov, V. V. (2007) · Nucleic Acids Research · doi:10.1093/nar/gkm896 · Cited by 99
Jansson, T. E., Inganäs, M., Sjögren, S., Norberg, T., Lindgren, A., Holmberg, L., & Bergh, J. C. S. (1995) · Journal of Clinical Oncology · doi:10.1200/jco.1995.13.11.2745 · Cited by 86
Krishnamurti, U., Wetherilt, C. S., Yang, J. L., Peng, L., & Li, X. (2017) · Human Pathology · doi:10.1016/j.humpath.2017.01.004 · Cited by 80
Lee, H. J., Lee, J.-J., Song, I. H., Park, I. A., Kang, J. K., Yu, J. H., Ahn, J., & Gong, G. (2015) · Breast Cancer Research and Treatment · doi:10.1007/s10549-015-3438-8 · Cited by 73
Genomic profiling of CHEK2*1100delC-mutated breast carcinomas
Massink, M. P. G., Kooi, I. E., Martens, J. W. M., Waisfisz, Q., & Meijers-Heijboer, H. E. J. (2015) · BMC Cancer · doi:10.1186/s12885-015-1880-y · Cited by 59
Personal neoantigen cancer vaccines
Fritsch, E. F., Hacohen, N., & Wu, C. J. (2014) · OncoImmunology · doi:10.4161/onci.29311 · Cited by 56
Bonsang‐Kitzis, H., Sadacca, B., Hamy, A., Moarii, M., Pinheiro, A., Laurent, C., & Reyal, F. (2015) · OncoImmunology · doi:10.1080/2162402x.2015.1061176 · Cited by 40
Iakovleva, N. V., Gorbushin, A. M., & Storey, K. B. (2006) · Fish & Shellfish Immunology · doi:10.1016/j.fsi.2005.12.008 · Cited by 37
Characterization of cytokinome landscape for clinical responses in human cancers
Wong, H. S.-C., Chang, C., Liu, X., Huang, W., & Chang, W. (2016) · OncoImmunology · doi:10.1080/2162402x.2016.1214789 · Cited by 31
Martínez‐Canales, S., Cifuentes, F. T., de Rodas, M. L., Serrano‐Oviedo, L., Galán‐Moya, E. M., Amir, E., Pandiella, A., Győrffy, B., & Ocaña, A. (2017) · PLoS ONE · doi:10.1371/journal.pone.0175128 · Cited by 30
Wang, X., & Guda, C. (2016) · Medicine · doi:10.1097/md.0000000000004321 · Cited by 29
Self-citationBardia, A., Diamond, J. R., Messersmith, W. A., Mayer, I. A., Isakoff, S. J., Abramson, V. G., Berlin, J. D., Starodub, A., O’Shaughnessy, J., Kalinsky, K. M., et al. (2016) · Journal of Clinical Oncology · doi:10.1200/jco.2016.34.18_suppl.lba509 · Cited by 4
Cited by
Sorted by citations
Classification of triple-negative breast cancers based on Immunogenomic profiling
He, Y., Jiang, Z., Chen, C., & Wang, X. (2018) · Journal of Experimental & Clinical Cancer Research · doi:10.1186/s13046-018-1002-1 · Cited by 633
Self-citationTriple-Negative Breast Cancer: A Review of Conventional and Advanced Therapeutic Strategies
Salcedo, J. M. M., Oza, G., Sharma, A. K., Arriaga, L., Hernández, J. M. H., Rotello, V. M., & Tapia-Ramı́rez, J. (2020) · International Journal of Environmental Research and Public Health · doi:10.3390/ijerph17062078 · Cited by 348
The Great Immune Escape: Understanding the Divergent Immune Response in Breast Cancer Subtypes
Onkar, S., Carleton, N. M., Lucas, P. C., Bruno, T. C., Lee, A. V., Vignali, D. A. A., & Oesterreich, S. (2022) · Cancer Discovery · doi:10.1158/2159-8290.cd-22-0475 · Cited by 227
Liu, Q., Zhang, J., Guo, C., Wang, M., Wang, C., Yan, Y., Sun, L., Wang, D., Zhang, L., Yu, H., et al. (2024) · Cell · doi:10.1016/j.cell.2023.12.004 · Cited by 234
Ma, S., Zhao, Y., Lee, W. C., Ong, L.-T., Lee, P. L., Jiang, Z., Oguz, G., Niu, Z., Liu, M., Goh, J. Y., et al. (2022) · Nature Communications · doi:10.1038/s41467-022-31764-9 · Cited by 200
Self-citation
Metadata
- Authors
- Liu, Z., Li, M., Jiang, Z., & Wang, X.
- Affiliations
- China Pharmaceutical University (CN)
- Corresponding author
- Wang, Xiaosheng
- Venue
- Translational Oncology
- Publisher
- Elsevier BV
- Published
- 2018-04
- Volume
- 11
- Issue
- 2
- Pages
- 311-329
- ISSN
- 1936-5233 (ISSN-L)
- PMC
- PMC5884188
- OpenAlex
- W2766581433
- Cited by
- 275
- References
- 69
- Citations by year
- 2026: 14 · 2025: 25 · 2024: 22 · 2023: 39 · 2022: 45 · 2021: 51 · 2020: 46 · 2019: 24 · 2018: 9
- FWCI
- 9.98
- Type
- journal article
- Language
- en
- Open access
- gold
- doi.org
- Licence
- Locations
- Translational Oncology (publishedVersion, cc-by-nc-nd)
- bioRxiv (Cold Spring Harbor Laboratory) (acceptedVersion, cc-by-nc-nd)
- Europe PMC (PubMed Central) (publishedVersion, cc-by-nc-nd)
- PubMed Central (publishedVersion, cc-by-nc-nd)
- PubMed (publishedVersion)
- DOAJ (DOAJ: Directory of Open Access Journals) (submittedVersion)
- Funders
- China Pharmaceutical University (2632018YX01, 3150120001)
- Topics
- Life Sciences › Biochemistry, Genetics and Molecular Biology › Cancer Research › Breast Cancer Treatment Studies
- Health Sciences › Medicine › Oncology › Cancer Immunotherapy and Biomarkers
- Life Sciences › Immunology and Microbiology › Immunology › Immune cells in cancer
- Keywords
- triple-negative breast cancer, tumor immunogenicity, immune pathways, immunotherapy, breast cancer subtypes, survival prediction, genomic data analysis
About these checks
Registry, retraction, Cites and statistics results are computed, not judged, with one exception: a printed reference that no index lists is read once by a model before it counts as a citation error. Claims are extracted by a model and kept only when their quote appears verbatim in the text; each cited source is then checked, with a model’s help, for whether it says what the claim relies on. Those verdicts can be wrong — read the claim’s quote and the cited source before relying on one.
Statistics and arithmetic are recomputed, not judged.
Confidence bands are shown only for fields calibrated on our annotated test set. None is calibrated yet, so no band is shown.
What counts as a claim ›How we measure confidence ›How we check this ›
Are you an author, or do you see a problem with this page? Request a review
