

The DOI matches its Crossref record; 50 of the 50 references it cites were found in a registry or an index.
Efficient Targeting and Activation of Antigen-Presenting Cells In Vivo after Modified mRNA Vaccine Administration in Rhesus Macaques
Open accessAbstract
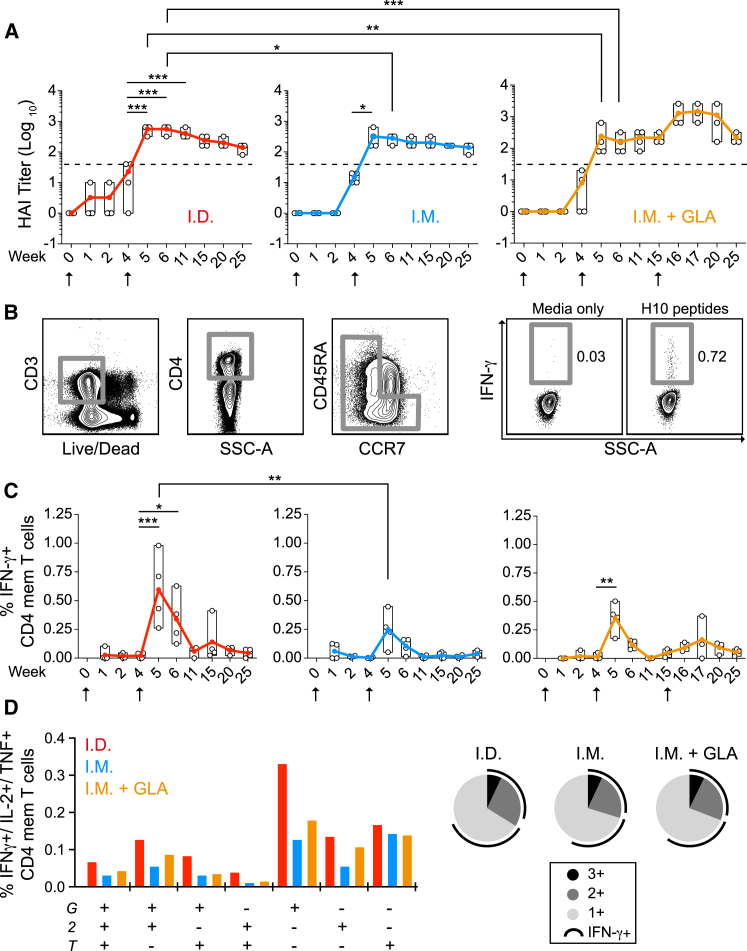
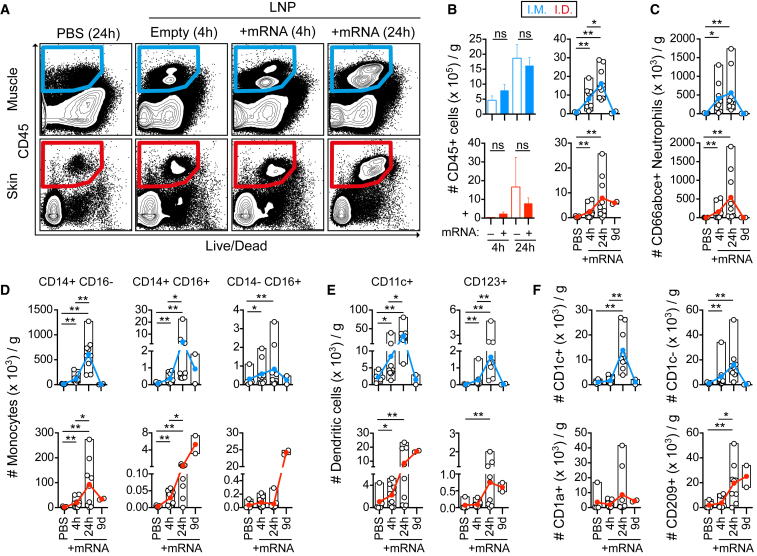
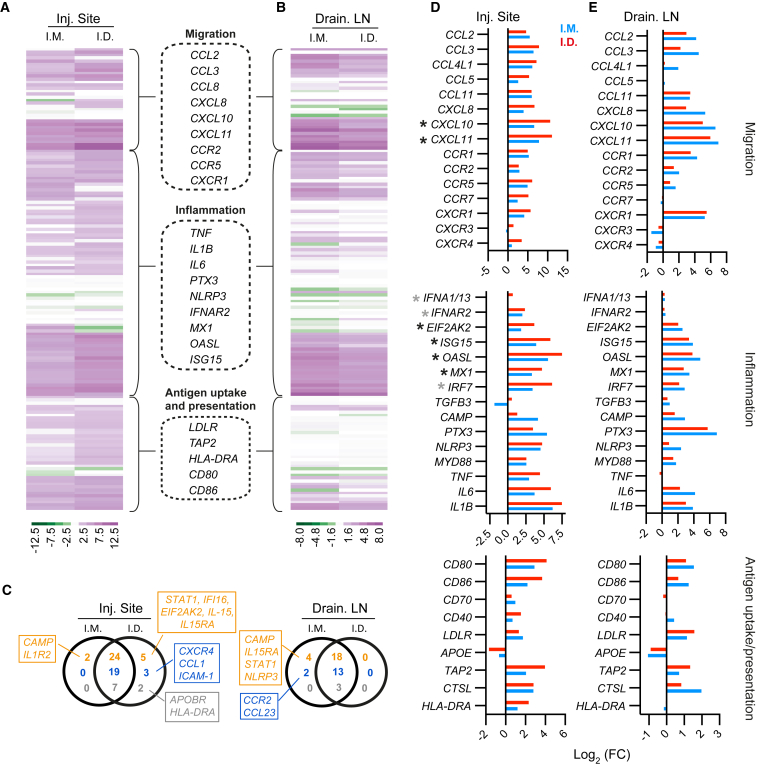
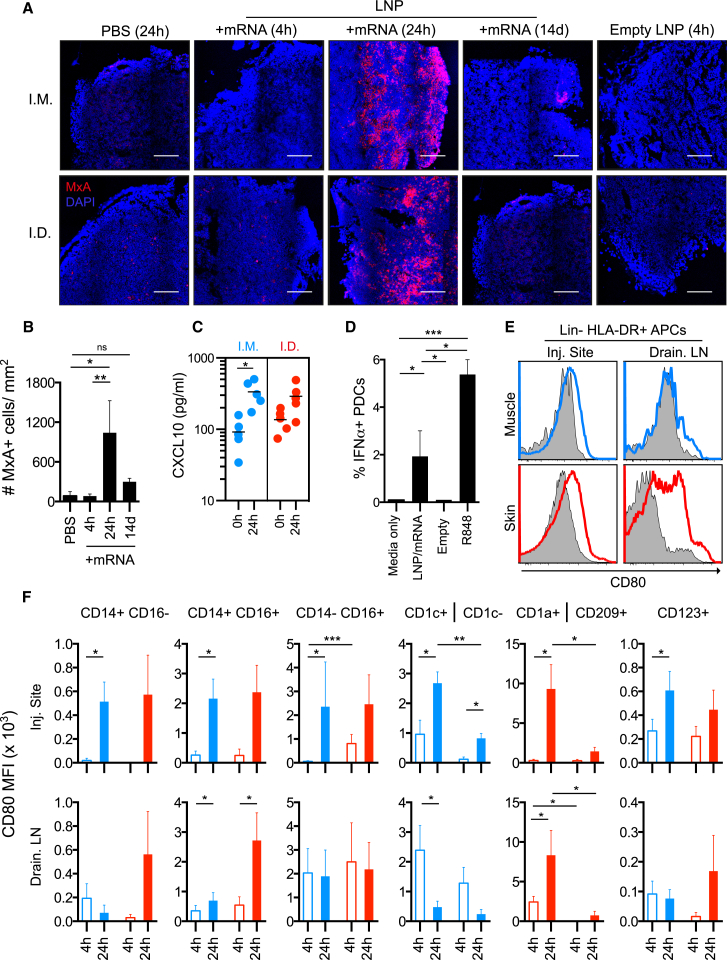
mRNA vaccines are rapidly emerging as a powerful platform for infectious diseases because they are well tolerated, immunogenic, and scalable and are built on precise but adaptable antigen design. We show that two immunizations of modified non-replicating mRNA encoding influenza H10 hemagglutinin (HA) and encapsulated in lipid nanoparticles (LNP) induce protective HA inhibition titers and H10-specific CD4 + T cell responses after intramuscular or intradermal delivery in rhesus macaques. Administration of LNP/mRNA induced rapid and local infiltration of neutrophils, monocytes, and dendritic cells (DCs) to the site of administration and the draining lymph nodes (LNs). While these cells efficiently internalized LNP, mainly monocytes and DCs translated the mRNA and upregulated key co-stimulatory receptors (CD80 and CD86). This coincided with upregulation of type I IFN-inducible genes, including MX1 and CXCL10. The innate immune activation was transient and resulted in priming of H10-specific CD4 + T cells exclusively in the vaccine-draining LNs. Collectively, this demonstrates that mRNA-based vaccines induce type-I IFN-polarized innate immunity and, when combined with antigen production by antigen-presenting cells, lead to generation of potent vaccine-specific responses.
Overview
The claims and statistics of this paper haven’t been checked yet.
Run the check — free, no account needed. It reads the open-access text and checks the sources it cites.
Integrity signals
Registry
Cites
Statistics
Figures
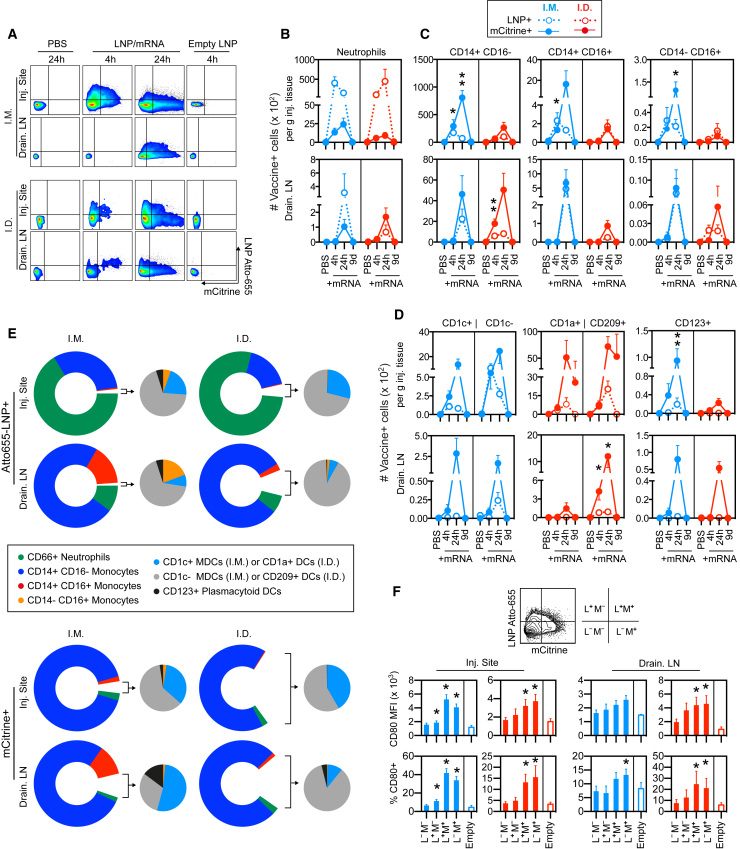
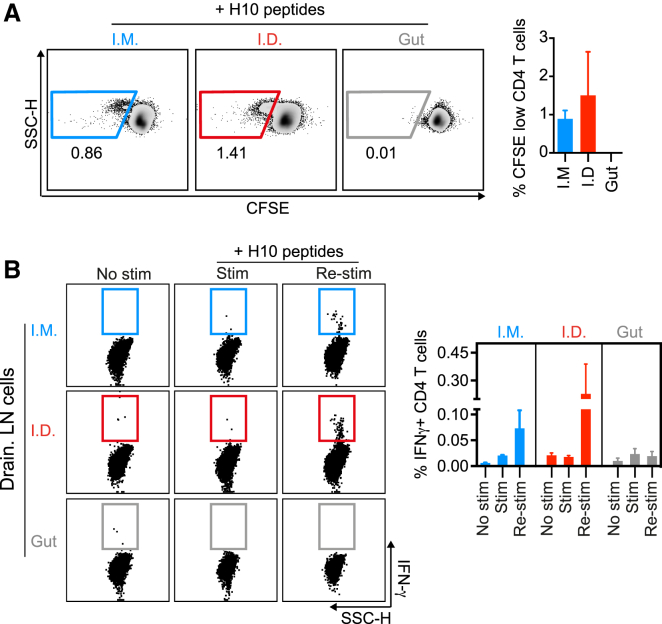
Verification
Claims the paper makes
The claims and statistics of this paper haven’t been checked yet.
Run the check — free, no account needed. It reads the open-access text and checks the sources it cites.
Claims other papers make about this one
Each is checked against this paper’s own text: does it say what the citing paper says it does?
In the citing paper
“More robust germinal centre responses are consistent with antigen dissemination to multiple lymph nodes and the self-adjuvating characteristics of the mRNA–lipid nanoparticle vaccine platform compared to nonadjuvanted inactivated vaccines used for seasonal influenza virus vaccination7,20,21.”
From SARS-CoV-2 mRNA vaccines induce persistent human germinal centre responses (2021) · cites this paper as [21]
In the citing paper
“and enhances delivery to the cytosol of antigen-presenting cells (Liang et al., 2017, Lindsay et al., 2019).”
From mRNA-lipid nanoparticle COVID-19 vaccines: structure and stability (2021) · cites this paper as Liang et al., 2017
In the citing paper
“Vaccine targeted cell types (see Mode of action), such as dendritic cells (DCs) and monocytes, highly express LDL receptors and other scavenger receptors [41]”
From The dawn of mRNA vaccines: the COVID-19 case (2021) · cites this paper as [41]
In the citing paper
“Similar to the more classical vaccine approaches, the COVID-19 mRNA vaccines are injected in the muscle, where they trigger localized and transient inflammation that recruits different immune cells to the injection site (Fig. 3 ) [11,41]”
From The dawn of mRNA vaccines: the COVID-19 case (2021) · cites this paper as [41]
In the citing paper
“According to mechanistic studies on the fate of mRNA LNPs in rhesus monkeys, primarily monocytes and DC subsets translate the mRNA, likely involving ApoE dependent endocytosis [41]”
From The dawn of mRNA vaccines: the COVID-19 case (2021) · cites this paper as [41]
In the citing paper
“In addition, they could detect mature, mRNA-transfected APCs in the draining LNs.”
From Three decades of messenger RNA vaccine development (2019) · cites this paper as [127]
In the citing paper
“Although all of these cell types were able to internalize mRNA LNPs, only monocytes and myeloid DCs showed high translation of the mRNA.”
From Three decades of messenger RNA vaccine development (2019) · cites this paper as [127]
In the citing paper
“With respect to the resulting immune response, they showed that i.d.delivery resulted in an earlier activation of skin DCs and a more efficient migration to draining LNs, as well as a prolonged antigen availability at the injection site.”
From Three decades of messenger RNA vaccine development (2019) · cites this paper as [127]
In the citing paper
“For both administration routes, they could show a rapid recruitment of neutrophils, monocytes and different DC subsets to the injection site (skin or muscle).”
From Three decades of messenger RNA vaccine development (2019) · cites this paper as [127]
In the citing paper
“Together, this resulted in a superior immunogenicity compared to i.m. delivery, as i.d.injection resulted in the highest antibody titers and CD4 + T cell activation.”
From Three decades of messenger RNA vaccine development (2019) · cites this paper as [127]
Self-check
Percentages, sums and reported differences re-computed from the paper’s own numbers.
The self-check needs the paper’s full text.
Citations
Cites
Karikó, K., Buckstein, M., Ni, H., & Weissman, D. (2005) · Immunity · doi:10.1016/j.immuni.2005.06.008 · Cited by 2,728
Warren, L., Manos, P. D., Ahfeldt, T., Loh, Y.-H., Li, H., Lau, F., Ebina, W., Mandal, P. K., Smith, Z. D., Meissner, A., et al. (2010) · Cell Stem Cell · doi:10.1016/j.stem.2010.08.012 · Cited by 2,662
Vaccine Adjuvants: Putting Innate Immunity to Work
Coffman, R. L., Sher, A., & Seder, R. A. (2010) · Immunity · doi:10.1016/j.immuni.2010.10.002 · Cited by 1,927
Systemic RNA delivery to dendritic cells exploits antiviral defence for cancer immunotherapy
Kranz, L. M., Diken, M., Haas, H., Kreiter, S., Loquai, C., Reuter, K. C., Meng, M., Fritz, D., Vascotto, F., Hefesha, H., et al. (2016) · Nature · doi:10.1038/nature18300 · Cited by 1,819
Skin immune sentinels in health and disease
Nestle, F. O., Meglio, P. D., Qin, J., & Nickoloff, B. J. (2009) · Nature reviews. Immunology · doi:10.1038/nri2622 · Cited by 1,529
Human CD14dim Monocytes Patrol and Sense Nucleic Acids and Viruses via TLR7 and TLR8 Receptors
Cros, J. F., Cagnard, N., Woollard, K. J., Patey, N., Zhang, S., Sénéchal, B., Puel, A., Biswas, S. K., Moshous, D., Pïcard, C., et al. (2010) · Immunity · doi:10.1016/j.immuni.2010.08.012 · Cited by 1,320
Jongbloed, S. L., Kassianos, A. J., McDonald, K. J., Clark, G. J., Ju, X., Angel, C. E., Chen, C. J., Dunbar, P. R., Wadley, R. B., Jeet, V., et al. (2010) · The Journal of Experimental Medicine · doi:10.1084/jem.20092140 · Cited by 1,019
Pardi, N., Tuyishime, S., Muramatsu, H., Kariko, K., Mui, B. L., Tam, Y. K., Madden, T. D., Hope, M. J., & Weissman, D. (2015) · Journal of Controlled Release · doi:10.1016/j.jconrel.2015.08.007 · Cited by 1,014
Safety and efficacy of RNAi therapy for transthyretin amyloidosis
Coelho, T., Adams, D., Silva, A., Lozeron, P., Hawkins, P. N., Mant, T., Perez, J., Chiesa, J., Warrington, S., Tranter, E., et al. (2013) · New England Journal of Medicine · doi:10.1056/nejmoa1208760 · Cited by 971
Modified mRNA vaccines protect against zika virus infection
Richner, J. M., Himansu, S., Dowd, K. A., Butler, S. L., Salazar, V., Fox, J. M., Julander, J. G., Tang, W. W., Shresta, S., Pierson, T. C., et al. (2017) · Cell · doi:10.1016/j.cell.2017.02.017 · Cited by 909
Self-citation
Cited by
Sorted by citations
mRNA-lipid nanoparticle COVID-19 vaccines: structure and stability
Schoenmaker, L., Witzigmann, D., Kulkarni, J. A., Verbeke, R., Kersten, G., Jiskoot, W., & Crommelin, D. J. A. (2021) · International Journal of Pharmaceutics · doi:10.1016/j.ijpharm.2021.120586 · Cited by 1,566
Optimization of lipid nanoparticles for intramuscular administration of mRNA vaccines
Hassett, K. J., Benenato, K. E., Jacquinet, E., Lee, A., Woods, A., Yuzhakov, O., Himansu, S., Deterling, J., Geilich, B. M., Ketova, T., et al. (2019) · Molecular Therapy — Nucleic Acids · doi:10.1016/j.omtn.2019.01.013 · Cited by 927
Self-citationSARS-CoV-2 mRNA vaccines induce persistent human germinal centre responses
Turner, J. S., O’Halloran, J. A., Kalaidina, E., Kim, W., Schmitz, A. J., Zhou, J. Q., Lei, T., Thapa, M., Chen, R. E., Case, J. B., et al. (2021) · Nature · doi:10.1038/s41586-021-03738-2 · Cited by 831
Lipids and Lipid Derivatives for RNA Delivery
Zhang, Y., Sun, C., Wang, C., Jankovic, K. E., & Dong, Y. (2021) · Chemical Reviews · doi:10.1021/acs.chemrev.1c00244 · Cited by 649
Advances in COVID-19 mRNA vaccine development
Fang, E., Liu, X., Li, M., Zhang, Z., Song, L., Zhu, B., Wu, X., Liu, J., Zhao, D., & Li, Y. (2022) · Signal Transduction and Targeted Therapy · doi:10.1038/s41392-022-00950-y · Cited by 601
Metadata
- Authors
- Liang, F., Lindgren, G., Lin, A., Thompson, E. A., Ols, S., Röhss, J., John, S., Hassett, K., Yuzhakov, O., Bahl, K., Brito, L. A., Salter, H., Ciaramella, G., & Loré, K.
- Affiliations
- Karolinska Institutet (SE)
- Moderna Therapeutics (United States) (US)
- Corresponding author
- Loré, Karin
- ORCID
- Venue
- Molecular Therapy
- Publisher
- Elsevier BV
- Published
- 2017-12
- Volume
- 25
- Issue
- 12
- Pages
- 2635-2647
- ISSN
- 1525-0016 (ISSN-L)
- PMC
- PMC5768558
- OpenAlex
- W2745973480
- Cited by
- 395
- References
- 50
- Citations by year
- 2026: 33 · 2025: 69 · 2024: 60 · 2023: 53 · 2022: 66 · 2021: 62 · 2020: 23 · 2019: 20 · 2018: 7 · 2017: 2
- FWCI
- 6.37
- Type
- journal article
- Language
- en
- Open access
- hybrid
- doi.org
- Licence
- Locations
- Molecular Therapy (publishedVersion, cc-by-nc-nd)
- Europe PMC (PubMed Central) (publishedVersion, cc-by-nc-nd)
- PubMed Central (publishedVersion, cc-by-nc-nd)
- PubMed (publishedVersion)
- Funders
- Swedish Research Council (2015-02608)
- Fernström Foundation
- Swedish Society of Medicine
- Topics
- Life Sciences › Immunology and Microbiology › Immunology › Immunotherapy and Immune Responses
- Life Sciences › Biochemistry, Genetics and Molecular Biology › Molecular Biology › RNA Interference and Gene Delivery
- Health Sciences › Medicine › Epidemiology › Influenza Virus Research Studies
- Keywords
- mRNA vaccines, lipid nanoparticles, antigen-presenting cells, dendritic cells, monocytes, CD4+ T cell responses, type I interferon, MX1, CXCL10, intradermal vaccination, intramuscular vaccination, innate immune activation, rhesus monkeys
- MeSH terms
- Animals, Antigen-Presenting Cells, Immunization, Influenza Vaccines, Injections, Intradermal, Lymph Nodes, Macaca mulatta, Phenotype, RNA, Messenger, T-Lymphocytes, Vaccines, Gene Expression, Immunophenotyping, Cytokines
About these checks
Registry, retraction, Cites and statistics results are computed, not judged, with one exception: a printed reference that no index lists is read once by a model before it counts as a citation error. Claims are extracted by a model and kept only when their quote appears verbatim in the text; each cited source is then checked, with a model’s help, for whether it says what the claim relies on. Those verdicts can be wrong — read the claim’s quote and the cited source before relying on one.
Statistics and arithmetic are recomputed, not judged.
Confidence bands are shown only for fields calibrated on our annotated test set. None is calibrated yet, so no band is shown.
What counts as a claim ›How we measure confidence ›How we check this ›
Are you an author, or do you see a problem with this page? Request a review
