

The DOI matches its Crossref record; 210 of the 218 references it cites were found in a registry or an index.
The 2021 report of the Lancet Countdown on health and climate change: code red for a healthy future
Open accessOverview
The claims and statistics of this paper haven’t been checked yet.
Run the check — free, no account needed. It reads the open-access text and checks the sources it cites.
Integrity signals
Registry
Cites
Statistics
Figures
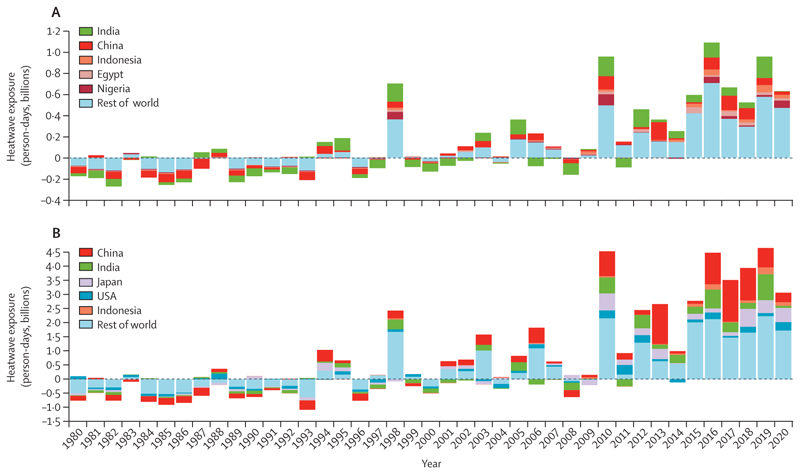
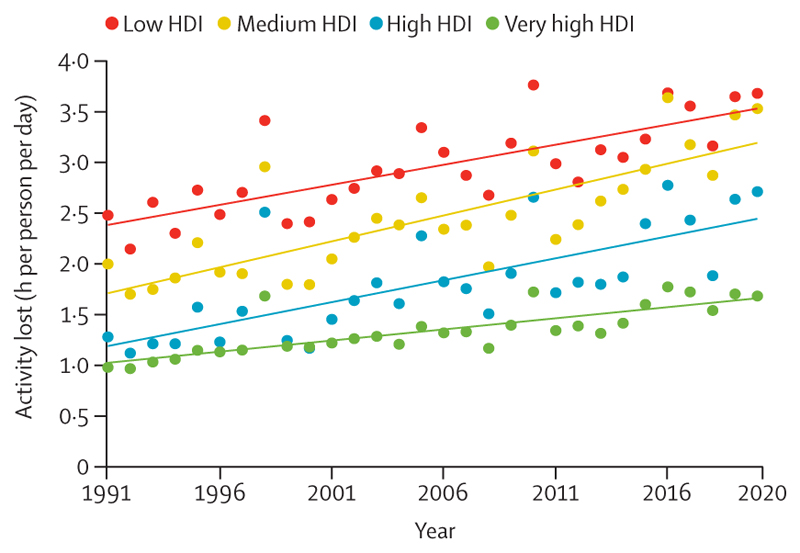
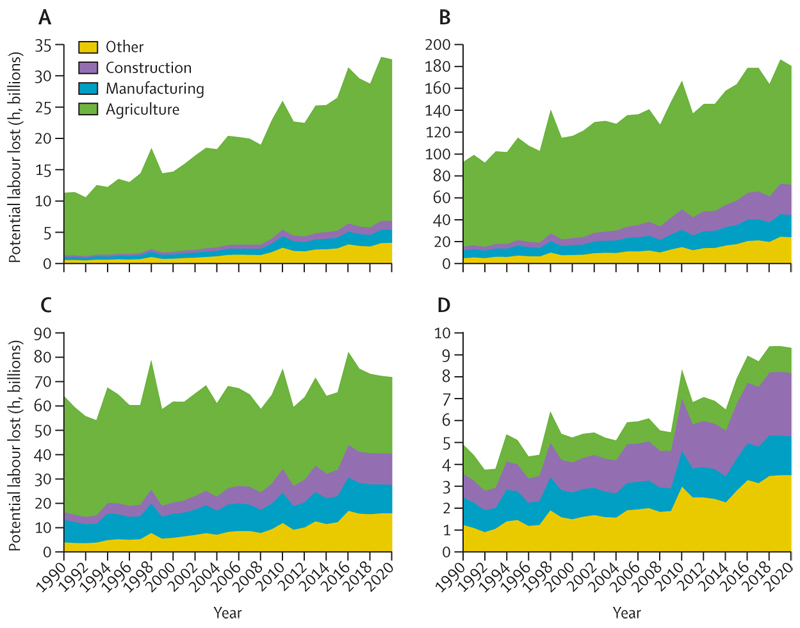
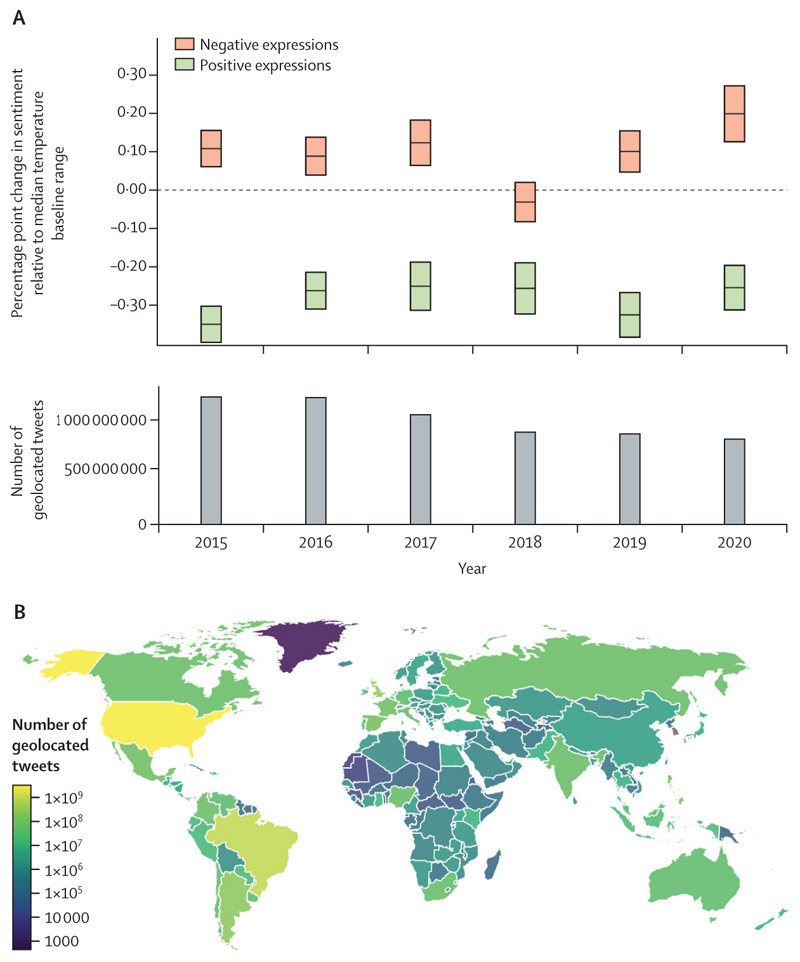
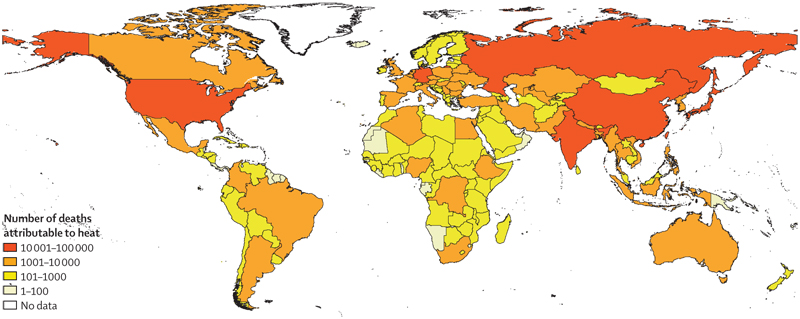
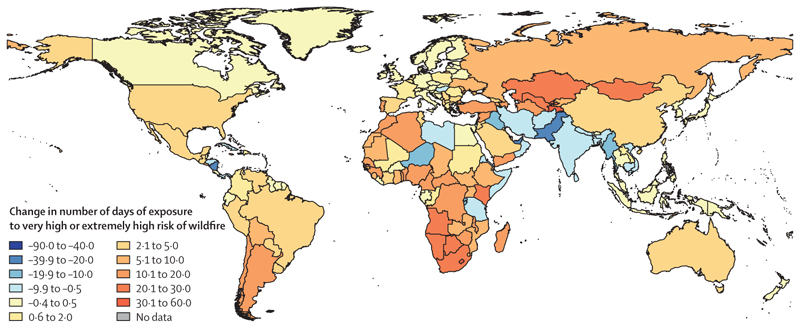
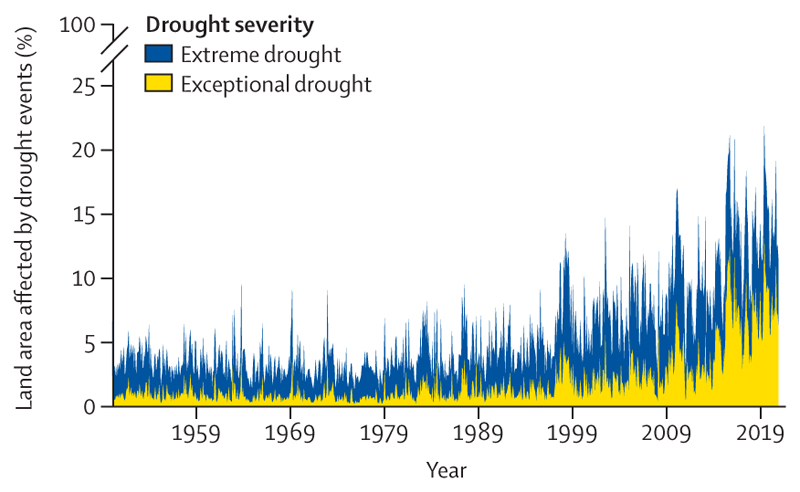
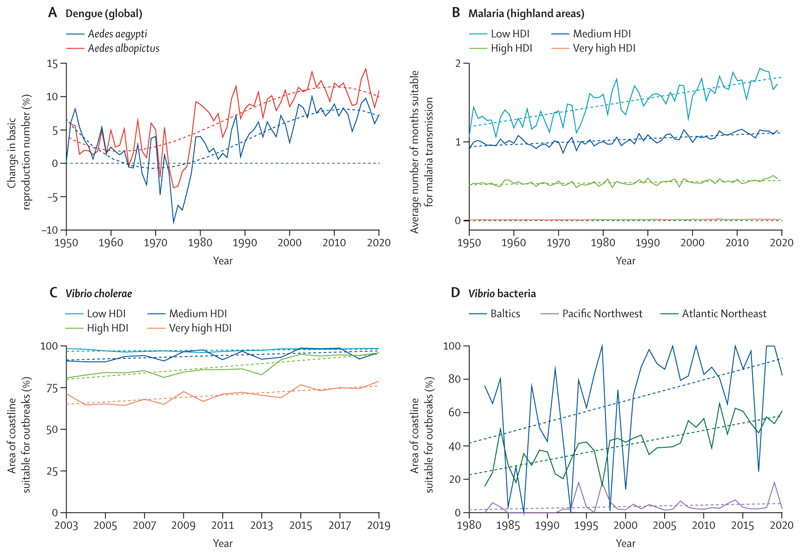
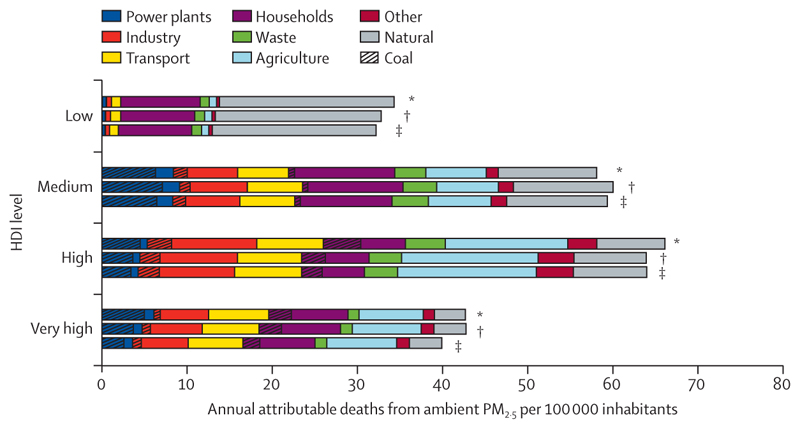
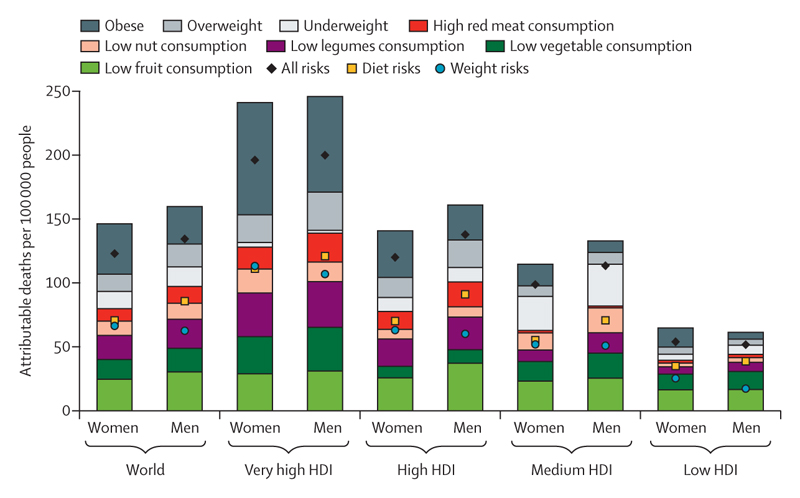
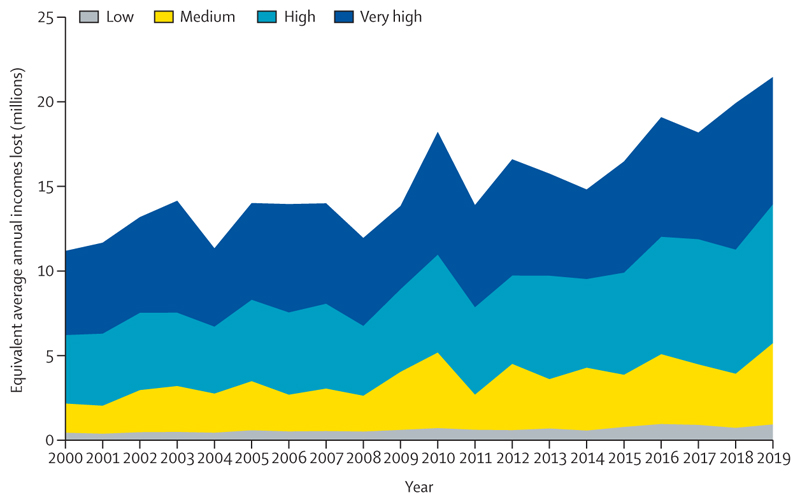
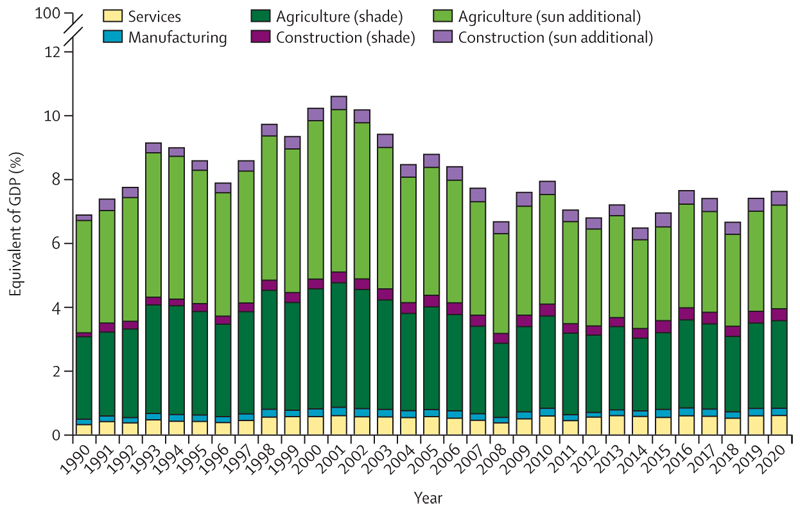
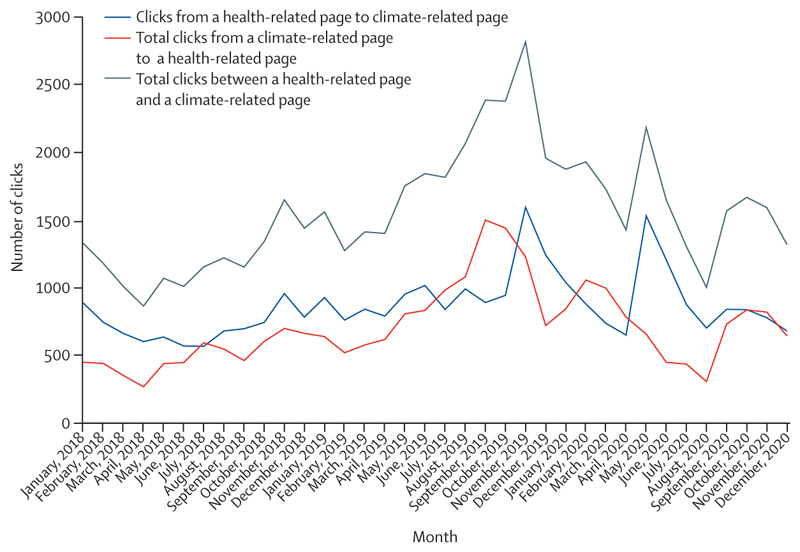
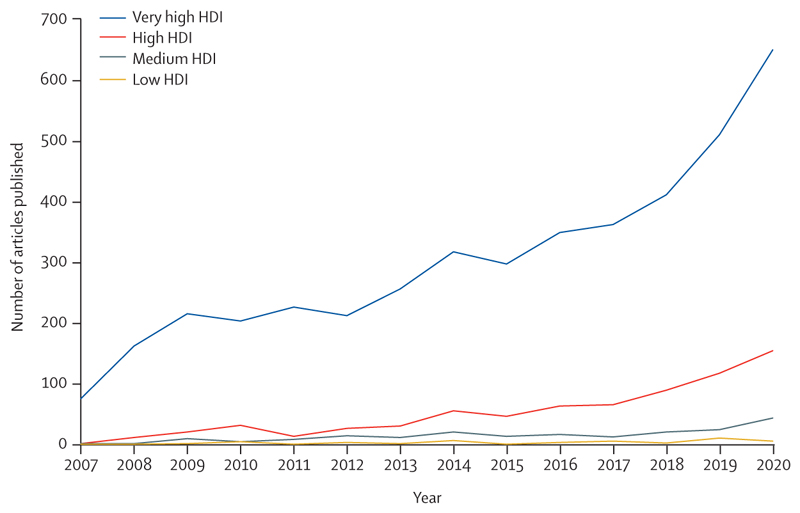
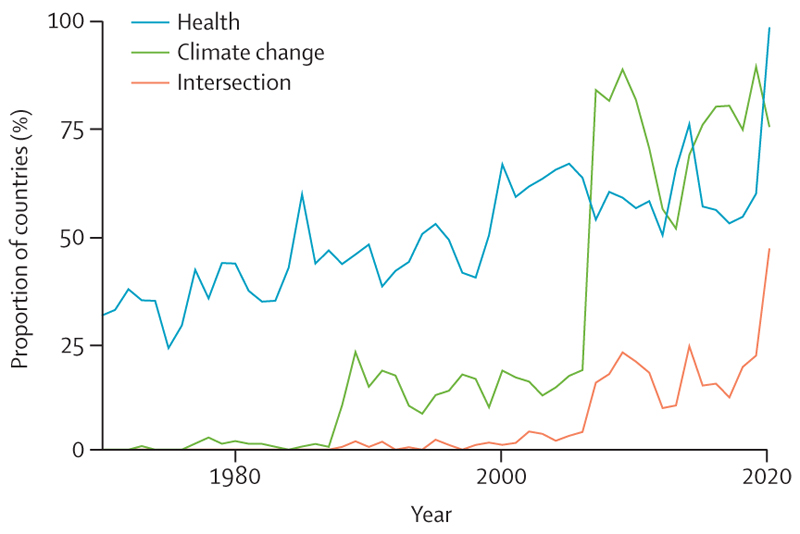
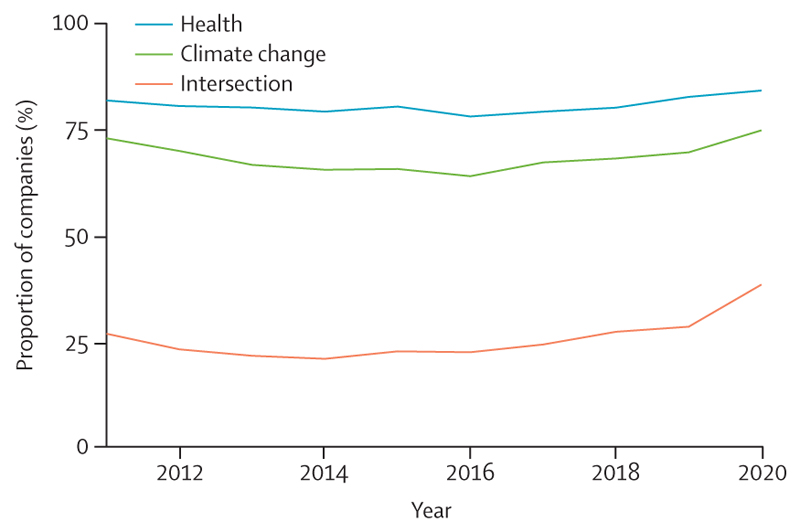
Verification
Claims the paper makes
The claims and statistics of this paper haven’t been checked yet.
Run the check — free, no account needed. It reads the open-access text and checks the sources it cites.
Claims other papers make about this one
Each is checked against this paper’s own text: does it say what the citing paper says it does?
The check wasn’t confident either way, so it gives no verdict — never disputed.
In the citing paper
“Given that the economy functions as a subsystem within the finite biosphere, achieving real sustainable growth under these conditions remains highly improbable, if not impossible (48).”
From Bridging Sectors and Disciplines to Gain a Critical Understanding of the Eco-Social Determinants of Health Inequities: The ESDHI-EU Conference (2025) · cites this paper as [48]
Experimental — accuracy not yet measuredThe check wasn’t confident either way, so it gives no verdict — never disputed.
In the citing paper
“Sleep of adequate duration and quality is important for good human physical and mental health.97–100”
From The 2024 report of the Lancet Countdown on health and climate change: facing record-breaking threats from delayed action (2024) · cites this paper as [98]
Experimental — accuracy not yet measured
Self-check
Percentages, sums and reported differences re-computed from the paper’s own numbers.
The self-check needs the paper’s full text.
Citations
Cites
Gender Trouble: Feminism and the Subversion of Identity
McIntosh, M., & Butler, J. (1991) · Feminist Review · doi:10.2307/1395391 · Cited by 29,314
Vos, T., Lim, S. S., Abbafati, C., Abbas, K. M., Abbasi, M., Abbasifard, M., Abbasi-Kangevari, M., Abbastabar, H., Abd-Allah, F., Abdelalim, A., et al. (2020) · The Lancet · doi:10.1016/s0140-6736(20)30925-9 · Cited by 19,358
Climate Change 2014 Impacts, Adaptation, and Vulnerability
(IPCC), I. P. O. C. C. (2014) · Cambridge University Press eBooks · doi:10.1017/cbo9781107415379 · Cited by 14,964
Murray, C. J. L., Aravkin, A. Y., Zheng, P., Abbafati, C., Abbas, K. M., Abbasi-Kangevari, M., Abd-Allah, F., Abdelalim, A., Abdollahi, M., Abdollahpour, I., et al. (2020) · The Lancet · doi:10.1016/s0140-6736(20)30752-2 · Cited by 9,854
Health benefits of physical activity: the evidence
Warburton, D. E. R. (2006) · Canadian Medical Association Journal · doi:10.1503/cmaj.051351 · Cited by 8,007
Thring, M. W. (1977) · Electronics and Power · doi:10.1049/ep.1977.0180 · Cited by 7,338
The socio-economic implications of the coronavirus pandemic (COVID-19): a review
Nicola, M., Alsafi, Z., Sohrabi, C., Kerwan, A., Al-Jabir, A., Iosifidis, C., Agha, M., & Agha, R. (2020) · International Journal of Surgery · doi:10.1016/j.ijsu.2020.04.018 · Cited by 6,351
(2019) · Cited by 3,602
Friedlingstein, P., O'Sullivan, M., Jones, M. W., Andrew, R. M., Hauck, J., Olsen, A., Peters, G. P., Peters, W., Pongratz, J., Sitch, S., et al. (2020) · Earth System Science Data · doi:10.5194/essd-12-3269-2020 · Cited by 2,544
Self-citation(2013) · Cited by 2,540
Research works printed but not linked: 5
- Sanga, 2008, Addressing gender issues through the production and use of gender-sensitive information, Afr Stat J, 7, 116
- Shupler, 2020, COVID-19 lockdown in a Kenyan informal settlement: impacts on household energy and food security, medRxiv
- Ranger, 2013, Unburnable carbon 2013: wasted capital and stranded assets about the Grantham Research Institute on, Manag Environ Qual, 24, 1
- Hendryx, 2020, Impacts of coal use on health, Annu Rev Public Health, 41, 397, 10.1146/annurev-publhealth-040119-094104 · DOI
- Yoshida, 2015, Wikipedia page view reflects web search trend. Proceedings of the ACM Web Science Conference, Commun ACM, 65, 1
Cited by
Sorted by citations
Items 501–600 of 1,000
The combined effects of sleep and extreme heat exposure on cognitive function among older adults
Zhou, W., Li, X., Wang, Q., Ling, L., & Zhang, H. (2025) · Ecotoxicology and Environmental Safety · doi:10.1016/j.ecoenv.2025.117683 · Cited by 11
Mitigating the environmental effects of healthcare: the role of the endocrinologist
Rizan, C., Rotchell, J. M., Eng, P. C., Robaire, B., Ciocan, C. M., Kapoor, N., Kalra, S., & Sherman, J. D. (2025) · Nature Reviews Endocrinology · doi:10.1038/s41574-025-01098-9 · Cited by 11
Self-citationKamgno, J., Adeleke, M., Basáñez, M.-G., Coulibaly, Y. I., de Souza, D. K., Debrah, L. B., Debrah, A. Y., Diggle, P. J., Nana-Djeunga, H. C., Domché, A., et al. (2025) · The Lancet Infectious Diseases · doi:10.1016/s1473-3099(25)00084-2 · Cited by 13
Malaria in Senegal: Recent and Future Changes Based on Bias-Corrected CMIP6 Simulations
Diouf, I., Ndione, J., & Gaye, A. T. (2022) · Tropical Medicine and Infectious Disease · doi:10.3390/tropicalmed7110345 · Cited by 12
Present and future: Infectious tropical travel rashes and the impact of climate change
Dinulos, J. E., & DINULOS, J. G. H. (2022) · Annals of Allergy Asthma & Immunology · doi:10.1016/j.anai.2022.12.025 · Cited by 13
Li, Y., Sun, J., Lei, R., Zheng, J., Tian, X., Xue, B., & Luo, B. (2023) · International Journal of Environmental Research and Public Health · doi:10.3390/ijerph20031959 · Cited by 14
Peng, L., Song, H., Xiao, X., Liu, G., Lu, M. X., Liu, Y., Wei, B., & Kikkawa, T. (2023) · IEEE Transactions on Microwave Theory and Techniques · doi:10.1109/tmtt.2023.3248788 · Cited by 11
Self-citationA first approach to human biometeorology research in Brazil: a systematic review and meta-analysis
Krüger, E. L., Gobo, J. P. A., Nedel, A. S., Gonçalves, F. L. T., Lúcio, P. S., Tejas, G. T., & Piacenti‐Silva, M. (2022) · International Journal of Biometeorology · doi:10.1007/s00484-022-02288-0 · Cited by 15
Kadaverugu, R. (2023) · Earth Science Informatics · doi:10.1007/s12145-022-00927-z · Cited by 11
The intersection of pediatric surgery, climate change, and equity
Cockrell, H. C., Hansen, E. E., Gow, K. W., Fecteau, A. H., & Greenberg, S. L. M. (2023) · Journal of Pediatric Surgery · doi:10.1016/j.jpedsurg.2023.01.017 · Cited by 11
Anthropogenic climate change drives rising global heat stress and its spatial inequality
Peng, J., Wang, Q., Yang, Z., Dong, J., Yu, X., & Corcoran, J. (2026) · Nature Communications · doi:10.1038/s41467-026-69164-y · Cited by 16
Scovronick, N., Shiwang, J., Ferranna, M., Wagner, F., Errickson, F., Tong, D., Yan, X., Dubash, N. K., Liu, Y., Krishna, B., et al. (2026) · The Lancet Global Health · doi:10.1016/s2214-109x(26)00006-9 · Cited by 10
Self-citationde Korte, J. Q., Veenstra, B., van Rijswick, M., Derksen, E. J. K., Hopman, M. T. E., Bongers, C. C. W. G., & Eijsvogels, T. M. H. (2022) · Frontiers in Sports and Active Living · doi:10.3389/fspor.2022.882254 · Cited by 11
Dietary intake of potentially toxic elements and children's chemical exposure
Urbano, T., Zagnoli, F., Malavolti, M., Halldorsson, T. I., Vinceti, M., & Filippini, T. (2022) · Current Opinion in Environmental Science & Health · doi:10.1016/j.coesh.2022.100393 · Cited by 9
Environmental Sustainability in Orthopaedic Surgery – Where We Are and Where We Are Going
Engler, I. D., & Curley, A. J. (2022) · Operative Techniques in Orthopaedics · doi:10.1016/j.oto.2022.100995 · Cited by 10
DeMasi, M., Chekuri, B., Paladine, H. L., & Kenyon, T. (2022) · Family Medicine · doi:10.22454/fammed.2022.827476 · Cited by 10
Virtual consumption: A review of digitalization's “green” credentials
Hynes, M. J. (2022) · Frontiers in Sustainability · doi:10.3389/frsus.2022.969329 · Cited by 13
Fears, R., Holzeis, C. C., Caussy, D., Harper, S. L., Hoe, V. C. W., McNeil, J. N., Mogwitz, J., ter Meulen, V., & Haines, A. (2023) · Global Policy · doi:10.1111/1758-5899.13210 · Cited by 10
Wardani, J., Bos, J. J. (., Ramirez-Lovering, D., & Capon, A. (2023) · The Journal of Climate Change and Health · doi:10.1016/j.joclim.2023.100242 · Cited by 13
Valck, J. D., Rolfe, J. C., Star, M., Rajapaksa, D., & Burton, M. P. (2023) · Journal of Cleaner Production · doi:10.1016/j.jclepro.2023.138157 · Cited by 10
Becvarik, Z. A., Smurthwaite, K. S., & Lal, A. (2023) · Transboundary and Emerging Diseases · doi:10.1155/2023/2714539 · Cited by 10
McCormick, J. J., Meade, R. D., King, K. E., Notley, S. R., Akerman, A. P., Sigal, R. J., & Kenny, G. P. (2023) · Journal of Applied Physiology · doi:10.1152/japplphysiol.00537.2023 · Cited by 11
Elzohairy, N. W., Fatah, N. K. A. E., & Khedr, M. A. (2023) · Geriatric Nursing · doi:10.1016/j.gerinurse.2023.10.017 · Cited by 10
van Nieuwenhuizen, K. E., Both, I. G. I. A., Porte, P. J., van der Eijk, A. C., & Jansen, F. W. (2023) · BJOG An International Journal of Obstetrics & Gynaecology · doi:10.1111/1471-0528.17709 · Cited by 14
Deng, X., Qi, W., Zhao, S., Yang, R., Zhang, C., & Huang, Y. (2024) · Scientific Reports · doi:10.1038/s41598-023-50858-y · Cited by 10
Environmental Impact of a Direct Laryngoscopy: Opportunities for Pollution Mitigation
Filley, G. I., Kayastha, D., Hayes, W., Mehra, S., Sherman, J. D., & Eckelman, M. J. (2024) · The Laryngoscope · doi:10.1002/lary.31341 · Cited by 11
Self-citationHarris-Glenville, F., & Cloos, P. (2024) · BMC Family Practice · doi:10.1186/s12875-024-02311-w · Cited by 10
Gupta, J., Chen, Y., McKay, D. I. A., Fezzigna, P., Gentile, G., Karg, A., van Vliet, L., Lade, S. J., & Jacobson, L. (2024) · International Environmental Agreements Politics Law and Economics · doi:10.1007/s10784-024-09628-y · Cited by 15
Zhu, Y., Wang, J., Yuan, Y.-T., Meng, B., Luo, M., Shi, C., & Ji, H. (2024) · Computational Urban Science · doi:10.1007/s43762-024-00119-z · Cited by 10
Stoneman, S., Balmer, F., Moore, L., Fontana, M., Kielstein, J. T., & Woywodt, A. (2024) · Clinical Kidney Journal · doi:10.1093/ckj/sfae062 · Cited by 10
Visaria, A., Kang, E., Parthasarathi, A., Robinson, D., Read, J., Nethery, R. C., Josey, K., Gandhi, P., Bates, B., Rua, M., et al. (2024) · The American Journal of Emergency Medicine · doi:10.1016/j.ajem.2024.04.010 · Cited by 11
Sudenkaarne, T., & Butcher, A. (2024) · Bioethics News · doi:10.1007/s40592-024-00197-z · Cited by 11
Dietary Flavonoids: Mitigating Air Pollution’s Cardiovascular Risks
Rocha-Velasco, O. A., Morales‐Suárez‐Varela, M., & González, A. L. (2024) · Nutrients · doi:10.3390/nu16162647 · Cited by 10
Integrating Forest Ecosystem Services into Health Strategies to Improve Human Well-Being
Liu, Y., Wang, C., Liu, Y., Feng, T., Wang, E., Yang, L., Niu, Q., & Mao, X. (2024) · Forests · doi:10.3390/f15111872 · Cited by 11
Self-citationHealth security—Why is ‘public health’ not enough?
Akhavein, D., Sheel, M., & Abímbọ́lá, Ṣ. (2025) · Global Health Research and Policy · doi:10.1186/s41256-024-00394-7 · Cited by 10
Li, Q., Shizhen, L., Zhai, T., Jin, S., Wang, C., Fang, B., & Xia, T. (2025) · Atmosphere · doi:10.3390/atmos16020119 · Cited by 10
Learning from COVID-19 for Climate-Ready Urban Transformation
Mahadevia, D., Ramos, G. C. D., Barnes, J., Fitzgerald, J., Kamei, M., Lanza, K., SOLECKI, W. D., Pathak, M., Barata, M. M. D. L., Barau, A. S., et al. (2025) · Cambridge University Press eBooks · doi:10.1017/9781009527279 · Cited by 10
Planetary Health: Focusing on the Intersection of Human Health and the Earth System
Guzmán, C., Redvers, N., Ji, J. S., Lacey-Hall, O., Mahmood, J., Masztalerz, O., Phelan, A., Rockström, J., & Myers, S. S. (2025) · Annual Review of Environment and Resources · doi:10.1146/annurev-environ-111523-102309 · Cited by 13
Unequal impacts of rising temperatures on global human sentiment
Wang, J., Guetta-Jeanrenaud, N., Palacios, J., Fan, Y., Kakkar, D., Obradovich, N., & Zheng, S. (2025) · One Earth · doi:10.1016/j.oneear.2025.101422 · Cited by 11
Self-citationTochkin, J., Richmond, J., & Hertelendy, A. J. (2022) · BMJ Leader · doi:10.1136/leader-2021-000583 · Cited by 10
An urgent need to reassess climate change and child labour in agriculture
Greenfield, M. H. (2022) · The Lancet Planetary Health · doi:10.1016/s2542-5196(22)00118-8 · Cited by 10
Climate Change Factors and the Aerobiology Effect
Rorie, A. C. (2022) · Immunology and Allergy Clinics of North America · doi:10.1016/j.iac.2022.05.007 · Cited by 10
Nationalism and Climate Change
Conversi, D. (2023) · Studies on National Movements · doi:10.21825/snm.89005 · Cited by 10
Cosentino, M., Gal-Oz, R., & Safer, D. L. (2024) · Springer eBooks · doi:10.1007/978-3-031-54790-4_15 · Cited by 12
Schmäing, T., & Grotjohann, N. (2022) · Environmental Education Research · doi:10.1080/13504622.2022.2102584 · Cited by 10
Parker, J., Young, P., Hodson, N., & Shelton, C. (2023) · Anaesthesia · doi:10.1111/anae.15991 · Cited by 10
Alford, J. E., Massazza, A., Jennings, N. R., & Lawrance, E. (2023) · The Journal of Climate Change and Health · doi:10.1016/j.joclim.2023.100252 · Cited by 13
The Inflation Reduction Act - a Historic Piece of Climate and Health Legislation
Rudolph, L., Beyeler, N., & Patel, L. H. (2022) · The Journal of Climate Change and Health · doi:10.1016/j.joclim.2022.100172 · Cited by 10
Editorial: Achieving food system resilience and equity in the era of global environmental change
Miles, A. F., & Hoy, C. W. (2023) · Frontiers in Sustainable Food Systems · doi:10.3389/fsufs.2022.1126013 · Cited by 10
Development of a global urban greenness indicator dataset for 1,000+ cities
Stowell, J., Ngo, C., Jimenez, M. P., Kinney, P. L., & James, P. (2023) · Data in Brief · doi:10.1016/j.dib.2023.109140 · Cited by 10
Self-citationImproving planetary health is integral to improving children’s health—a call to action
Sampath, V., Nadeau, K. C., Ebi, K. L., Narvaez, D., Tessema, M. T., Pak-Gorstein, S., & Darmstadt, G. L. (2022) · Pediatric Research · doi:10.1038/s41390-022-02432-x · Cited by 9
Self-citationAlaca, Ç. (2023) · Psikiyatride Guncel Yaklasimlar - Current Approaches in Psychiatry · doi:10.18863/pgy.1172916 · Cited by 9
Liu, Y., Wang, D., Huang, X., Liang, R., Tu, Z., You, X., Zhou, M., & Chen, W. (2023) · Environmental Science and Pollution Research · doi:10.1007/s11356-023-28225-1 · Cited by 10
Self-citationBrülhart, M., Klotzbücher, V., & Lalive, R. (2023) · Scientific Reports · doi:10.1038/s41598-023-39064-y · Cited by 10
Economics, health, or environment: What motivates individual climate action?
Brown, H. E., Austhof, E., Luz, P. M., & Ferguson, D. B. (2023) · PLOS Climate · doi:10.1371/journal.pclm.0000177 · Cited by 9
Wu, Y., Wang, X., Zhao, L., Lü, B., Yu, J.-F., Liu, Z., Sun, Y., Liang, W., & Huang, C. (2023) · Advances in Climate Change Research · doi:10.1016/j.accre.2023.09.015 · Cited by 9
Self-citationSantana, F. N., Herbert, N., & Wong‐Parodi, G. (2024) · Journal of Risk Research · doi:10.1080/13669877.2024.2315997 · Cited by 9
Filho, W. L., Dinis, M. A. P., Salvia, A. L., Sierra, J., Vasconcelos, H. C., Henderson‐Wilson, C., Diatta, S., Kumar, T. V. L., Meirelles, M., & Carvalho, F. (2024) · PLoS ONE · doi:10.1371/journal.pone.0304019 · Cited by 9
What do Climate Change, Nutrition, and the Environment Have to do With Mental Health?
Sugden, S. G., & Merlo, G. (2024) · American Journal of Lifestyle Medicine · doi:10.1177/15598276241280245 · Cited by 10
The impact of climate change-related disasters on mental health and epigenetics: a narrative review
Roe, E., Khov, E., Kim, H., Demelo, B., Zavitz, S., & Cao-Lei, L. (2024) · Frontiers in Epigenetics and Epigenomics · doi:10.3389/freae.2024.1464276 · Cited by 9
Moharam, M. M., Irfan, M., Asif, S. U., & Zakaly, H. M. H. (2025) · Polyhedron · doi:10.1016/j.poly.2025.117388 · Cited by 9
Greenness and averted mortality in 390 cities in China (2000–2020)
Ji, J. S., Tao, Z., Miao, H., Cole‐Hunter, T., Li, X., Rueda, D. R., & Cai, W. (2025) · The Lancet Regional Health - Western Pacific · doi:10.1016/j.lanwpc.2024.101283 · Cited by 9
Self-citationSandri, E., Broccolo, A., & Piredda, M. (2025) · Sustainability · doi:10.3390/su17030991 · Cited by 10
Urban Spatial Heat Resilience Indicator Based on Running Activity Z-Score
Zhou, L., & Lai, Y. (2025) · Urban Science · doi:10.3390/urbansci9020034 · Cited by 9
Reis, J. J., Öztürk, Ş., Ayta, S., Tülek, Z., Sıva, A., Can, G., & Spencer, P. S. (2025) · Journal of the Neurological Sciences · doi:10.1016/j.jns.2025.123423 · Cited by 9
Shapira, S., Rosenthal, A., Singer, M. E., Natour, S., & Negev, M. (2025) · International Journal of Disaster Risk Reduction · doi:10.1016/j.ijdrr.2025.105750 · Cited by 9
López-Bueno, J. A., Díaz, J., Iriso, M., Ruiz-Páez, R., Navas-Martín, M. Á., & Linares, C. (2025) · Journal of Urban Health · doi:10.1007/s11524-025-01006-6 · Cited by 9
Effects of governance quality on health outcomes in West African countries
Kouadio, M. (2025) · Discover Public Health · doi:10.1186/s12982-025-01014-6 · Cited by 11
The inclusion of health in major global reports on climate change and biodiversity
Dasandi, N., Cai, W., Friberg, P., Mikhaylov, S., Kuylenstierna, J. C. I., & Nilsson, M. (2022) · BMJ Global Health · doi:10.1136/bmjgh-2022-008731 · Cited by 9
Self-citationWortzel, J. R., Guerrero, A. P. S., Aggarwal, R., Coverdale, J., & Brenner, A. M. (2022) · Academic Psychiatry · doi:10.1007/s40596-022-01688-z · Cited by 12
Quantifying the future risk of dengue under climate change in Japan
Hayashi, K., Fujimoto, M., & Nishiura, H. (2022) · Frontiers in Public Health · doi:10.3389/fpubh.2022.959312 · Cited by 9
Kolimenakis, A., Tsesmelis, D. E., Richardson, C., Milonas, P., Stefopoulou, A., Stefopoulou, Α., Yakob, L., Papachristos, D., BALATSOS, G., & Michaelakis, Α. (2022) · International Journal of Environmental Research and Public Health · doi:10.2139/ssrn.4003208 · Cited by 9
González‐Pizarro, P., Muret, J. C., & Brazzi, L. (2023) · Current Opinion in Anaesthesiology · doi:10.1097/aco.0000000000001240 · Cited by 9
Davies, J. F., McGain, F., & Francis, J. (2023) · International Journal of Environmental Research and Public Health · doi:10.3390/ijerph20053978 · Cited by 9
Hamilton, W. T., Philippe, C. D., Hospedales, J., Dresser, C. J., Colebrooke, B., Hamacher, N., Humphrey, K., & Sorensen, C. J. (2023) · Dialogues in Health · doi:10.1016/j.dialog.2023.100141 · Cited by 12
Tian, Z., Yang, F., & Qin, D. (2023) · Sensors · doi:10.3390/s23229118 · Cited by 9
World Gastroenterology Organisation - Gut commentary series on digestive health and climate change
Omary, M. B., Leddin, D. J., Metz, G. L., Veitch, A., El-Omar, E. M., Macedo, G., & Perman, M. L. (2023) · Gut · doi:10.1136/gutjnl-2023-331193 · Cited by 9
Lane, M. A., Ebelt, S., Wu, Z., Scovronick, N., D’Souza, R. R., & Chang, H. H. (2024) · Environmental Health · doi:10.1186/s12940-024-01048-4 · Cited by 9
Wan, K., Hajat, S., Doherty, R. M., & Feng, Z. (2024) · Environmental Research · doi:10.1016/j.envres.2024.118731 · Cited by 9
Do no harm: addressing the environmental impact of health care
Mortimer, F., & Pencheon, D. C. (2022) · Nature Reviews Disease Primers · doi:10.1038/s41572-022-00372-8 · Cited by 9
Self-citationClimate mitigation and adaptation is cancer prevention and control
Rublee, C. S., Bikomeye, J. C., Rao, S., Husain, M., & Beyer, K. M. M. (2023) · The Journal of Climate Change and Health · doi:10.1016/j.joclim.2023.100209 · Cited by 9
Zhang, H., Wang, D.-S., Wu, S.-H., Huang, G., Chen, D.-H., Ma, H., Zhang, Y.-T., Guo, L.-H., Liu, R.-Q., Gui, Z.-H., et al. (2023) · International Journal of Hygiene and Environmental Health · doi:10.1016/j.ijheh.2023.114258 · Cited by 9
Health at COP26: just the beginning
Salas, R. N., Miller, J., & Neira, M. (2021) · BMJ · doi:10.1136/bmj.n2960 · Cited by 9
Self-citationWilliams, J. A., Chin-Yee, S., Maslin, M. A., Barnsley, J., Costello, A. M. D. L., Lang, J., McGlade, J. M., Mulugetta, Y., Taylor, R. G., Winning, M., et al. (2022) · doi:10.14324/111.444/000180.v1 · Cited by 9
Self-citationChapter 23 : US Caribbean. Fifth National Climate Assessment
Méndez‐Lázaro, P., Chardón-Maldonado, P., Carrubba, L., Álvarez-Berríos, N. L., Barreto-Orta, M., Bowden, J. H., Crespo-Acevedo, W. I., Diaz, E. L., Gardner, L. S., González, G., et al. (2023) · doi:10.7930/nca5.2023.ch23 · Cited by 11
da Silva, I., Wikuats, C. F. H., Hashimoto, E. M., & Martins, L. D. (2022) · International Journal of Environmental Research and Public Health · doi:10.3390/ijerph192416521 · Cited by 8
Parsons, L. A., Shindell, D. T., Faluvegi, G., & Nagamoto, E. (2023) · Earth s Future · doi:10.1029/2023ef003839 · Cited by 8
Varghese, B. M., Hansen, A. L., Mann, N., Liu, J., Zhang, Y., Driscoll, T., Morgan, G. G., Dear, K. B. G., Capon, A. G., Gourley, M., et al. (2023) · The Medical Journal of Australia · doi:10.5694/mja2.52171 · Cited by 10
Lehmann, F., Schulz, C. M., Leicht, D., Brady, S., Fuhrmann, A., Prütting, J., Hügel, M. G., Hörr, D., & Sander, M. (2023) · BMC Health Services Research · doi:10.1186/s12913-023-10307-y · Cited by 8
Lai, P., Zhang, L., Yan, Q., Ren, J., Sun, X., Zhang, T., Wang, L., Cheng, S., Liu, S., Zhuang, H., et al. (2024) · Journal of Thermal Biology · doi:10.1016/j.jtherbio.2024.103799 · Cited by 9
Self-citationMarginean, I., Cuaresma, J. C., Hoffmann, R., Muttarak, R., Gao, J., & Daloz, A. S. (2024) · Earth s Future · doi:10.1029/2024ef004431 · Cited by 8
Jordan, A., Nothacker, J., Paucke, V., Häger, K., Hueber, S., Karimzadeh, A., Kötter, T., Löffler, C., Müller, B. S., Tajdar, D., et al. (2024) · JMIR Public Health and Surveillance · doi:10.2196/58711 · Cited by 8
Shinoda, J., Bivolarova, M. P., Bidstrup, C., Hvitved, T., & Toftum, J. (2024) · Energy and Buildings · doi:10.1016/j.enbuild.2024.115110 · Cited by 10
Is Ecological Anxiety Due to Climate Change Associated With the Fertility Preferences of Women?
Özkan, A., Kolcu, M., Yilmaz, A., & Akbaş, G. (2024) · Journal of Evaluation in Clinical Practice · doi:10.1111/jep.14265 · Cited by 8
Horn, S., Turunen, T., Saukkonen, S., Nylén, E.-J., & Sorvari, J. (2024) · Resources Conservation and Recycling · doi:10.1016/j.resconrec.2024.108095 · Cited by 8
From policy to practice: building a resilient, climate aware health system from the ground up
Smith, C. L., Rojas, C., Zurynski, Y. A., Partington, A., & Braithwaite, J. (2025) · Climatic Change · doi:10.1007/s10584-025-03914-7 · Cited by 8
Liu, X., Hao, M., Zhou, Y., Zhang, Y., Xu, Z., Liu, X., Gao, Y., Li, R., Zhang, H., Li, X., et al. (2025) · Environmental Health Perspectives · doi:10.1289/ehp15010 · Cited by 8
Temperature and Mental Health: Evidence from Helpline Calls
Janzen, B. (2025) · Journal of the Association of Environmental and Resource Economists · doi:10.1086/736751 · Cited by 12
Guhan, Raju, A. D., Krishna, R., & Nagaratna, K. (2025) · Dynamics of Atmospheres and Oceans · doi:10.1016/j.dynatmoce.2025.101562 · Cited by 12
Sarcone, A., Angelillo, S., Gennaro, G. D., Belfiore, M. G., Pileggi, C., Costa, D., & Nobile, C. G. A. (2025) · Frontiers in Public Health · doi:10.3389/fpubh.2025.1711363 · Cited by 10
Metadata
- Authors
- Romanello, M., McGushin, A., Di Napoli, C., Drummond, P., Hughes, N., Jamart, L., Kennard, H., Lampard, P., Solano Rodriguez, B., Arnell, N., Ayeb-Karlsson, S., Belesova, K., Cai, W., Campbell-Lendrum, D., Capstick, S., Chambers, J., Chu, L., Ciampi, L., Dalin, C., Dasandi, N., Dasgupta, S., Davies, M., Dominguez-Salas, P., Dubrow, R., Ebi, K. L., Eckelman, M., Ekins, P., Escobar, L. E., Georgeson, L., Grace, D., Graham, H., Gunther, S. H., Hartinger, S., He, K., Heaviside, C., Hess, J., Hsu, S.-C., Jankin, S., Jimenez, M. P., Kelman, I., Kiesewetter, G., Kinney, P. L., Kjellstrom, T., Kniveton, D., Lee, J. K. W., Lemke, B., Liu, Y., Liu, Z., Lott, M., Lowe, R., Martinez-Urtaza, J., Maslin, M., McAllister, L., McMichael, C., Mi, Z., Milner, J., Minor, K., Mohajeri, N., Moradi-Lakeh, M., Morrissey, K., Munzert, S., Murray, K. A., Neville, T., Nilsson, M., Obradovich, N., Sewe, M. O., Oreszczyn, T., Otto, M., Owfi, F., Pearman, O., Pencheon, D., Rabbaniha, M., Robinson, E., Rocklöv, J., Salas, R. N., Semenza, J. C., Sherman, J., Shi, L., Springmann, M., Tabatabaei, M., Taylor, J., Trinanes, J., Shumake-Guillemot, J., Vu, B., Wagner, F., Wilkinson, P., Winning, M., Yglesias, M., Zhang, S., Gong, P., Montgomery, H., Costello, A., & Hamilton, I.
- Affiliations
- University College London (GB)
- University of York (GB)
- University of Reading (GB)
- London School of Hygiene & Tropical Medicine (GB)
- Tsinghua University (CN)
- World Health Organization (CH)
- Cardiff University (GB)
- Yale University (US)
- University of Birmingham (GB)
- CMCC Foundation - Euro-Mediterranean Center on Climate Change (IT)
- University of Washington (US)
- Northeastern University (US)
- Virginia Tech (US)
- International Livestock Research Institute (KE)
- National University of Singapore (SG)
- Universidad Peruana Cayetano Heredia (PE)
- Harvard University (US)
- International Institute for Applied Systems Analysis (AT)
- Boston University (US)
- University of Sussex (GB)
- Nelson Marlborough Institute of Technology (NZ)
- Emory University (US)
- Center on Global Energy Policy (US)
- Technical University of Munich (DE)
- The University of Melbourne (AU)
- University of Copenhagen (DK)
- Technical University of Denmark (DK)
- Hertie School (DE)
- Umeå University (SE)
- Max Planck Institute for Human Development (DE)
- Agricultural Research & Education Organization (IR)
- Cooperative Institute for Research in Environmental Sciences (US)
- University of Exeter (GB)
- University of Oxford (GB)
- Universiti Malaysia Terengganu (MY)
- Tampere University (FI)
- Universidade de Santiago de Compostela (ES)
- World Meteorological Organization (CH)
- University of Hong Kong (HK)
- Energy Institute (GB)
- Corresponding author
- Hamilton, Ian
- ORCID
- Romanello, Marina
- McGushin, Alice
- Drummond, Paul
- Hughes, Nick
- Kennard, Harry
- Lampard, Pete
- Arnell, Nigel
- Belesova, Kristine
- Cai, Wenjia
- Campbell-Lendrum, Diarmid
- Capstick, Stuart
- Chambers, Jonathan
- Chu, Lingzhi
- Ciampi, Luisa
- Dalin, Carole
- Dasandi, Niheer
- Dasgupta, Shouro
- Davies, Michael
- Dubrow, Robert
- Ebi, Kristie L
- Eckelman, Matthew
- Ekins, Paul
- Escobar, Luis E
- Georgeson, Lucien
- Grace, Delia
- Graham, Hilary
- Gunther, Samuel H
- Hartinger, Stella
- He, Kehan
- Heaviside, Clare
- Hsu, Shih-Che
- Jimenez, Marcia P
- Kelman, Ilan
- Kiesewetter, Gregor
- Kinney, Patrick L
- Kjellstrom, Tord
- Kniveton, Dominic
- Lee, Jason K W
- Liu, Yang
- Liu, Zhao
- Lott, Melissa
- Lowe, Rachel
- Maslin, Mark
- McAllister, Lucy
- McMichael, Celia
- Mi, Zhifu
- Milner, James
- Minor, Kelton
- Mohajeri, Nahid
- Morrissey, Karyn
- Munzert, Simon
- Murray, Kris A
- Nilsson, Maria
- Obradovich, Nick
- Sewe, Maquins Odhiambo
- Oreszczyn, Tadj
- Owfi, Fereidoon
- Pencheon, David
- Rabbaniha, Mahnaz
- Robinson, Elizabeth
- Rocklöv, Joacim
- Salas, Renee N
- Semenza, Jan C
- Sherman, Jodi
- Shi, Liuhua
- Springmann, Marco
- Tabatabaei, Meisam
- Taylor, Jonathon
- Trinanes, Joaquin
- Vu, Bryan
- Wagner, Fabian
- Wilkinson, Paul
- Winning, Matthew
- Zhang, Shihui
- Gong, Peng
- Montgomery, Hugh
- Costello, Anthony
- Hamilton, Ian
- Venue
- The Lancet
- Publisher
- Elsevier BV
- Published
- 2021-10
- Volume
- 398
- Issue
- 10311
- Pages
- 1619-1662
- ISSN
- 0099-5355 (ISSN-L)
- 0140-6736
- PMC
- PMC7616807
- OpenAlex
- W3211328827
- Cited by
- 1,603
- References
- 218
- Citations by year
- 2026: 200 · 2025: 251 · 2024: 289 · 2023: 523 · 2022: 318 · 2021: 20
- FWCI
- 27.37
- Type
- journal article
- Language
- en
- Update notices
- erratum (2021-12-11)
- Open access
- bronze
- doi.org
- Licence
- www.elsevier.com/tdm/userlicense/1.0/ (tdm)
- www.elsevier.com/legal/tdmrep-license (tdm)
- www.elsevier.com/open-access/userlicense/1.0/ (am, 384 d)
- doi.org/10.15223/policy-017 (stm-asf)
- doi.org/10.15223/policy-037 (stm-asf)
- doi.org/10.15223/policy-012 (stm-asf)
- doi.org/10.15223/policy-029 (stm-asf)
- doi.org/10.15223/policy-004 (stm-asf)
- Locations
- The Lancet (acceptedVersion)
- PubMed (publishedVersion)
- Research at the University of Copenhagen (University of Copenhagen) (publishedVersion, cc-by-nc-nd)
- Greenwich Academic Literature Archive (University of Greenwich) (acceptedVersion)
- PubMed Central (acceptedVersion, cc-by)
- London School of Economics and Political Science Research Online (London School of Economics and Political Science) (acceptedVersion)
- CentAUR (University of Reading) (submittedVersion)
- White Rose Research Online (University of Leeds, The University of Sheffield, University of York) (submittedVersion)
- London School of Economics and Political Science Theses Online (London School of Economics and Political Science) (submittedVersion)
- Sussex Research Online (University of Sussex) (submittedVersion)
- UNU Collections (United Nations University) (submittedVersion)
- National University of Singapore (submittedVersion)
- CGSPace A Repository of Agricultural Research Outputs (Consultative Group for International Agricultural Research) (submittedVersion, other-oa)
- UCL Discovery (University College London) (submittedVersion)
- Figshare (submittedVersion)
- Hispana (submittedVersion, other-oa)
- ORCA Online Research @Cardiff (Cardiff University) (submittedVersion)
- ARCA (Università Ca' Foscari Venezia) (submittedVersion, cc-by-nc-nd)
- Minerva Access (University of Melbourne) (submittedVersion, cc-by)
- OPUS 4 (Zuse Institute Berlin) (submittedVersion)
- University of Birmingham Research Portal (University of Birmingham) (submittedVersion, other-oa)
- Technical University of Denmark, DTU Orbit (Technical University of Denmark, DTU) (submittedVersion)
- IIASA PURE (International Institute of Applied Systems Analysis) (submittedVersion)
- Tampere University Institutional Repository (Tampere University) (submittedVersion, cc-by-nc-nd)
- Funders
- Wellcome Trust (209734/Z/17/Z)
- Northeastern University
- Royal Society
- National Research Foundation
- UK Energy Research Centre
- International Energy Agency
- National Research Foundation Singapore
- National University of Singapore
- National Aeronautics and Space Administration (80NSSC21K0507)
- Svenska Forskningsrådet Formas (2018\u201301754, 2017\u201301300)
- Harvard University
- Natural Environment Research Council (NE/N01524X/1, 205200/Z/16/Z, NE/R01440X/1, 216035/Z/19/Z)
- Topics
- Physical Sciences › Environmental Science › Health, Toxicology and Mutagenesis › Climate Change and Health Impacts
- Physical Sciences › Environmental Science › Health, Toxicology and Mutagenesis › Air Quality and Health Impacts
- Physical Sciences › Environmental Science › Global and Planetary Change › Climate Change and Environmental Impact
- Keywords
- health and climate change, COVID-19 pandemic, health equity, low-carbon transition, climate change adaptation, global health indicators, sustainable development, just transition
- MeSH terms
- Forecasting, Health Planning, Humans, Global Health, Climate Change, Renewable Energy
About these checks
Registry, retraction, Cites and statistics results are computed, not judged, with one exception: a printed reference that no index lists is read once by a model before it counts as a citation error. Claims are extracted by a model and kept only when their quote appears verbatim in the text; each cited source is then checked, with a model’s help, for whether it says what the claim relies on. Those verdicts can be wrong — read the claim’s quote and the cited source before relying on one.
Statistics and arithmetic are recomputed, not judged.
Confidence bands are shown only for fields calibrated on our annotated test set. None is calibrated yet, so no band is shown.
What counts as a claim ›How we measure confidence ›How we check this ›
Are you an author, or do you see a problem with this page? Request a review
