

The DOI matches its Crossref record; 54 of the 54 references it cites were found in a registry or an index.
Development and validation of a weakly supervised deep learning framework to predict the status of molecular pathways and key mutations in colorectal cancer from routine histology images: a retrospective study
Open accessPublished version of a preprint
Abstract
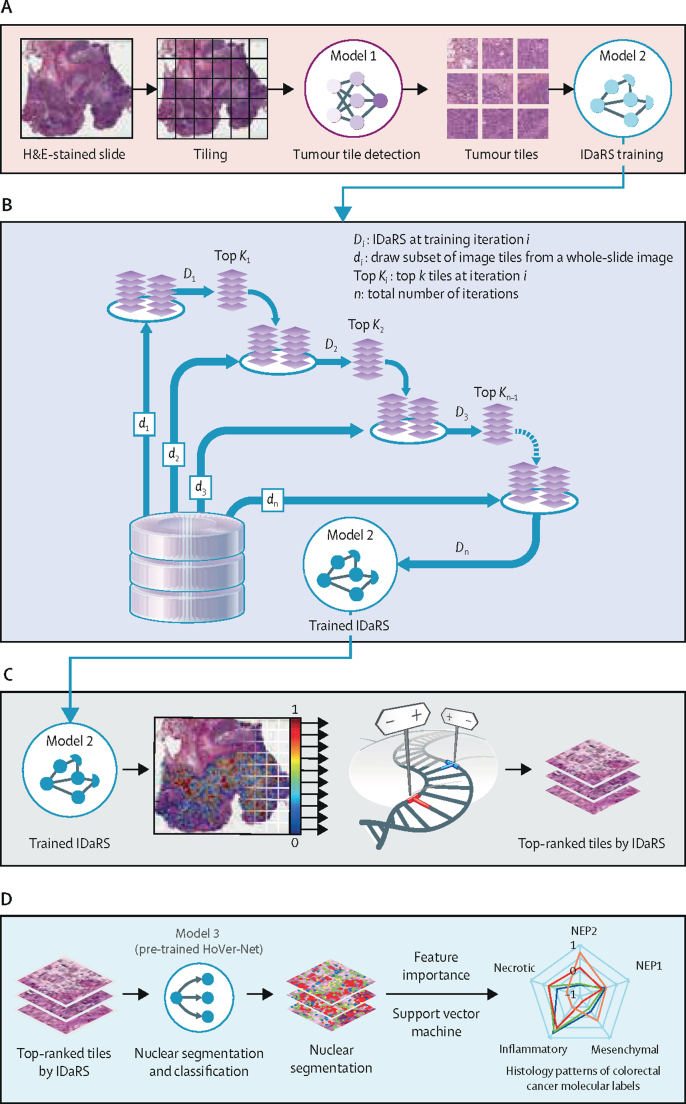
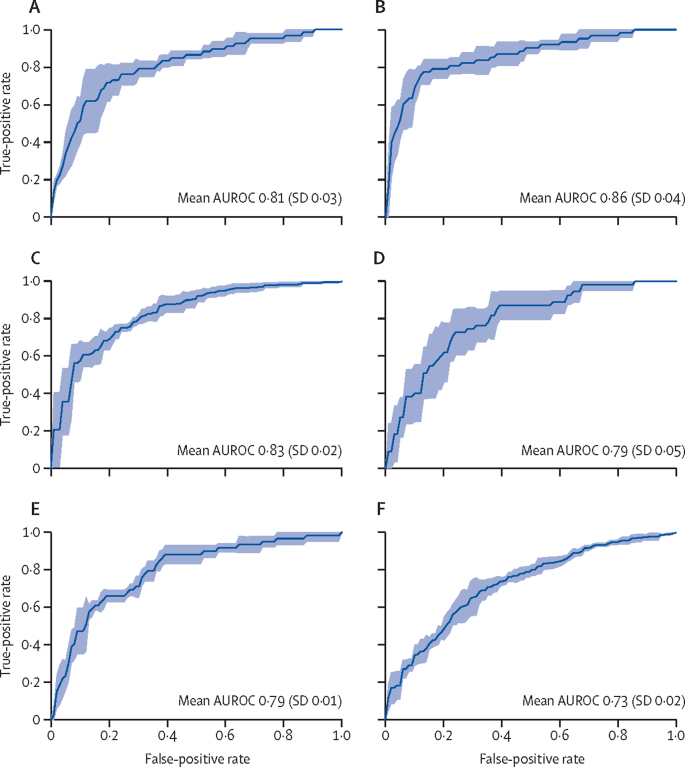
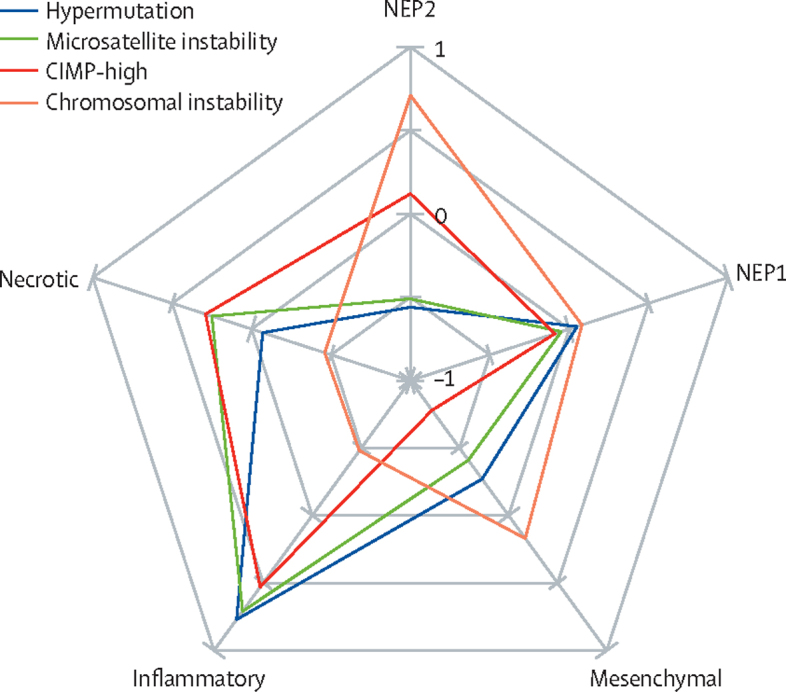
Background Determining the status of molecular pathways and key mutations in colorectal cancer is crucial for optimal therapeutic decision making. We therefore aimed to develop a novel deep learning pipeline to predict the status of key molecular pathways and mutations from whole-slide images of haematoxylin and eosin-stained colorectal cancer slides as an alternative to current tests. Methods In this retrospective study, we used 502 diagnostic slides of primary colorectal tumours from 499 patients in The Cancer Genome Atlas colon and rectal cancer (TCGA-CRC-DX) cohort and developed a weakly supervised deep learning framework involving three separate convolutional neural network models. Whole-slide images were divided into equally sized tiles and model 1 (ResNet18) extracted tumour tiles from non-tumour tiles. These tumour tiles were inputted into model 2 (adapted ResNet34), trained by iterative draw and rank sampling to calculate a prediction score for each tile that represented the likelihood of a tile belonging to the molecular labels of high mutation density ( vs low mutation density), microsatellite instability ( vs microsatellite stability), chromosomal instability ( vs genomic stability), CpG island methylator phenotype (CIMP)-high ( vs CIMP-low), BRAF mut ( vs BRAF WT ), TP53 mut ( vs TP53 WT ), and KRAS WT ( vs KRAS mut ). These scores were used to identify the top-ranked titles from each slide, and model 3 (HoVer-Net) segmented and classified the different types of cell nuclei in these tiles. We calculated the area under the convex hull of the receiver operating characteristic curve (AUROC) as a model performance measure and compared our results with those of previously published methods. Findings Our iterative draw and rank sampling method yielded mean AUROCs for the prediction of hypermutation (0·81 [SD 0·03] vs 0·71), microsatellite instability (0·86 [0·04] vs 0·74), chromosomal instability (0·83 [0·02] vs 0·73), BRAF mut (0·79 [0·01] vs 0·66), and TP53 mut (0·73 [0·02] vs 0·64) in the TCGA-CRC-DX cohort that were higher than those from previously published methods, and an AUROC for KRAS mut that was similar to previously reported methods (0·60 [SD 0·04] vs 0·60). Mean AUROC for predicting CIMP-high status was 0·79 (SD 0·05). We found high proportions of tumour-infiltrating lymphocytes and necrotic tumour cells to be associated with microsatellite instability, and high proportions of tumour-infiltrating lymphocytes and a low proportion of necrotic tumour cells to be associated with hypermutation. Interpretation After large-scale validation, our proposed algorithm for predicting clinically important mutations and molecular pathways, such as microsatellite instability, in colorectal cancer could be used to stratify patients for targeted therapies with potentially lower costs and quicker turnaround times than sequencing-based or immunohistochemistry-based approaches. Funding The UK Medical Research Council.
Overview
The claims and statistics of this paper haven’t been checked yet.
Free: it reads the open-access text and checks the first 5 claims that cite a source we can check. Create a free account to check every claim.
Integrity signals
Registry
Cites
Statistics
Figures
Verification
Claims the paper makes
The claims and statistics of this paper haven’t been checked yet.
Free: it reads the open-access text and checks the first 5 claims that cite a source we can check. Create a free account to check every claim.
Claims other papers make about this one
Each is checked against this paper’s own text: does it say what the citing paper says it does?
The cited source says what the claim attributes to it.
In the citing paper
“Here, we demonstrate that the use of SL can enable AI-based prediction of clinical biomarkers in solid tumors, and yields high-performing models for pathology-based prediction of BRAF and MSI status, two important prognostic and predictive biomarkers in CRC 3,9,34 .”
From Swarm learning for decentralized artificial intelligence in cancer histopathology (2022) · cites this paper as [34]
Self-check
Percentages, sums and reported differences re-computed from the paper’s own numbers.
The self-check needs the paper’s full text.
Citations
Cites
Deep Residual Learning for Image Recognition
He, K., Zhang, X., Ren, S., & Sun, J. (2016) · 2016 IEEE Conference on Computer Vision and Pattern Recognition (CVPR) · doi:10.1109/cvpr.2016.90 · Cited by 235,474
A Threshold Selection Method from Gray-Level Histograms
Otsu, N. (1979) · IEEE Transactions on Systems, Man, and Cybernetics · doi:10.1109/tsmc.1979.4310076 · Cited by 43,398
PyTorch: An Imperative Style, High-Performance Deep Learning Library
Paszke, A., Gross, S., Massa, F., Lerer, A., Bradbury, J., Chanan, G., Killeen, T., Lin, Z., Gimelshein, N., Antiga, L., et al. (2019) · arXiv · doi:10.48550/arxiv.1912.01703 · Cited by 31,473
ShuffleNet: An Extremely Efficient Convolutional Neural Network for Mobile Devices
Zhang, X., Zhou, X., Lin, M., & Sun, J. (2018) · 2018 IEEE/CVF Conference on Computer Vision and Pattern Recognition · doi:10.1109/cvpr.2018.00716 · Cited by 9,982
ShuffleNet: An Extremely Efficient Convolutional Neural Network for Mobile Devices
Zhang, X., Zhou, X., Lin, M., & Sun, J. (2017) · arXiv · doi:10.48550/arxiv.1707.01083 · Cited by 9,982
The consensus molecular subtypes of colorectal cancer
Guinney, J., Dienstmann, R., Wang, X., de Reyniès, A., Schlicker, A., Soneson, C., Marisa, L., Roepman, P., Nyamundanda, G., Angelino, P., et al. (2015) · Nature Medicine · doi:10.1038/nm.3967 · Cited by 5,170 · cited 1×
“Increasing numbers of studies have subtyped colorectal cancer on the basis of shared and distinct molecular characteristics and pathways 1,8 and determined the association of these pathways with patient prognosis, overall survival, and response to specific treatments—particularly targeted therapy…”
BackgroundEhteshami Bejnordi, B., Veta, M., Johannes van Diest, P., van Ginneken, B., Karssemeijer, N., Litjens, G., van der Laak, J. A. W. M., and the CAMELYON16 Consortium, Hermsen, M., Manson, Q. F., et al. (2017) · JAMA · doi:10.1001/jama.2017.14585 · Cited by 3,293
Self-citationCoudray, N., Ocampo, P. S., Sakellaropoulos, T., Narula, N., Snuderl, M., Fenyö, D., Moreira, A. L., Razavian, N., & Tsirigos, A. (2018) · Nature Medicine · doi:10.1038/s41591-018-0177-5 · Cited by 2,930
Clinical-grade computational pathology using weakly supervised deep learning on whole slide images
Campanella, G., Hanna, M. G., Geneslaw, L., Miraflor, A., Werneck Krauss Silva, V., Busam, K. J., Brogi, E., Reuter, V. E., Klimstra, D. S., & Fuchs, T. J. (2019) · Nature Medicine · doi:10.1038/s41591-019-0508-1 · Cited by 2,799
Data-efficient and weakly supervised computational pathology on whole-slide images
Lu, M. Y., Williamson, D. F. K., Chen, T. Y., Chen, R. J., Barbieri, M., & Mahmood, F. (2021) · Nature Biomedical Engineering · doi:10.1038/s41551-020-00682-w · Cited by 2,282
Cited by
Artificial intelligence in drug development
Zhang, K., Yang, X., Wang, Y., Yu, Y., Huang, N., Li, G., Li, X., Wu, J. C., & Yang, S. (2025) · Nature Medicine · doi:10.1038/s41591-024-03434-4 · Cited by 498
A foundation model for clinical-grade computational pathology and rare cancers detection
Vorontsov, E., Bozkurt, A., Casson, A., Shaikovski, G., Zelechowski, M., Severson, K., Zimmermann, E., Hall, J., Tenenholtz, N., Fusi, N., et al. (2024) · Nature Medicine · doi:10.1038/s41591-024-03141-0 · Cited by 572
Artificial intelligence in histopathology: enhancing cancer research and clinical oncology
Shmatko, A., Ghaffari Laleh, N., Gerstung, M., & Kather, J. N. (2022) · Nature Cancer · doi:10.1038/s43018-022-00436-4 · Cited by 446
Wagner, S. J., Reisenbüchler, D., West, N. P., Niehues, J. M., Zhu, J., Foersch, S., Veldhuizen, G. P., Quirke, P., Grabsch, H. I., van den Brandt, P. A., et al. (2023) · Cancer Cell · doi:10.1016/j.ccell.2023.08.002 · Cited by 275
Tumour-infiltrating lymphocytes: from prognosis to treatment selection
Brummel, K., Eerkens, A. L., de Bruyn, M., & Nijman, H. W. (2023) · British Journal of Cancer · doi:10.1038/s41416-022-02119-4 · Cited by 242
Metadata
- Authors
- Bilal, M., Raza, S. E. A., Azam, A., Graham, S., Ilyas, M., Cree, I. A., Snead, D., Minhas, F., & Rajpoot, N. M.
- Affiliations
- University of Warwick (GB)
- University Hospital Coventry (GB)
- University of Nottingham (GB)
- Centre international de recherche sur le cancer (FR)
- Corresponding author
- Rajpoot, Nasir M
- ORCID
- Venue
- The Lancet Digital Health
- Publisher
- Elsevier BV
- Published
- 2021-12
- Volume
- 3
- Issue
- 12
- Pages
- e763-e772
- ISSN
- 2589-7500 (ISSN-L)
- PMC
- PMC8609154
- OpenAlex
- W3205605830
- Cited by
- 299
- References
- 54
- Citations by year
- 2026: 47 · 2025: 64 · 2024: 48 · 2023: 70 · 2022: 59 · 2021: 11
- FWCI
- 16.61
- Type
- journal article
- Language
- en
- Open access
- gold
- doi.org
- Licence
- cc-by-nc-nd
- www.elsevier.com/tdm/userlicense/1.0/ (tdm)
- www.elsevier.com/legal/tdmrep-license (tdm)
- creativecommons.org/licenses/by-nc-nd/4.0/ (vor)
- Locations
- The Lancet Digital Health (publishedVersion, cc-by-nc-nd)
- medRxiv (acceptedVersion, cc-by-nc-nd)
- PubMed Central (publishedVersion, cc-by-nc-nd)
- PubMed (publishedVersion)
- Repository@Nottingham (University of Nottingham) (publishedVersion, cc-by-nc-nd)
- Warwick Research Archive Portal (University of Warwick) (acceptedVersion)
- Repository@Nottingham (University of Nottingham) (submittedVersion, cc-by-nc-nd)
- DOAJ (DOAJ: Directory of Open Access Journals) (submittedVersion, cc-by-sa)
- Funders
- Korea Health Industry Development Institute
- Seoul National University Hospital
- Medical Research Council (MR/P015476/1)
- Ministry of Health and Welfare (HI18C0316)
- Topics
- Physical Sciences › Computer Science › Artificial Intelligence › AI in cancer detection
- Health Sciences › Medicine › Radiology, Nuclear Medicine and Imaging › Radiomics and Machine Learning in Medical Imaging
- Health Sciences › Medicine › Oncology › Colorectal Cancer Screening and Detection
- Keywords
- colorectal cancer, mutation status prediction, weakly supervised deep learning, whole slide images, H&E staining, microsatellite instability, chromosomal instability, CpG island methylator phenotype, BRAF mutation, TP53 mutation, KRAS mutation, hypermutation, nuclei segmentation
- MeSH terms
- Deep Learning, Colon, Histological Techniques, Humans, Mutation, Phenotype, Rectum, Retrospective Studies, ROC Curve, Biomarkers, Tumor, Colorectal Neoplasms, Area Under Curve, Microsatellite Instability
About these checks
Registry, retraction, Cites and statistics results are computed, not judged, with one exception: a printed reference that no index lists is read once by a model before it counts as a citation error. Claims are extracted by a model and kept only when their quote appears verbatim in the text; each cited source is then checked, with a model’s help, for whether it says what the claim relies on. Those verdicts can be wrong — read the claim’s quote and the cited source before relying on one.
Statistics and arithmetic are recomputed, not judged.
Confidence bands are shown only for fields calibrated on our annotated test set. None is calibrated yet, so no band is shown.
What counts as a claim ›How we measure confidence ›How we check this ›
Are you an author, or do you see a problem with this page? Request a review
How to cite
Cite CoChat for the checks on this page, and the paper for its own findings.
- This page
- CoChat. (2026). Citation check: Development and validation of a weakly supervised deep learning framework to predict the status of molecular pathways and key mutations in colorectal cancer from routine histology images: a retrospective study. https://app.cochat.ai/papers/10.1016/s2589-7500(21)00180-1
- The paper
- Bilal, M., Raza, S. E. A., Azam, A., Graham, S., Ilyas, M., Cree, I. A., Snead, D., Minhas, F., & Rajpoot, N. M. (2021). Development and validation of a weakly supervised deep learning framework to predict the status of molecular pathways and key mutations in colorectal cancer from routine histology images: a retrospective study. The Lancet Digital Health. https://doi.org/10.1016/s2589-7500(21)00180-1
Data sources
Bibliographic data: Semantic Scholar, OpenAlex, Crossref.
Contains information from the Semantic Scholar Academic Graph Datasets, made available under the ODC Attribution License (ODC-BY 1.0).
Semantic Scholar’s data is described in: Kinney, R., et al. (2023). The Semantic Scholar Open Data Platform. arXiv:2301.10140.
