

The DOI matches its Crossref record; 493 of the 494 references it cites were found in a registry or an index.
High-Resolution Native Mass Spectrometry
Open accessAbstract
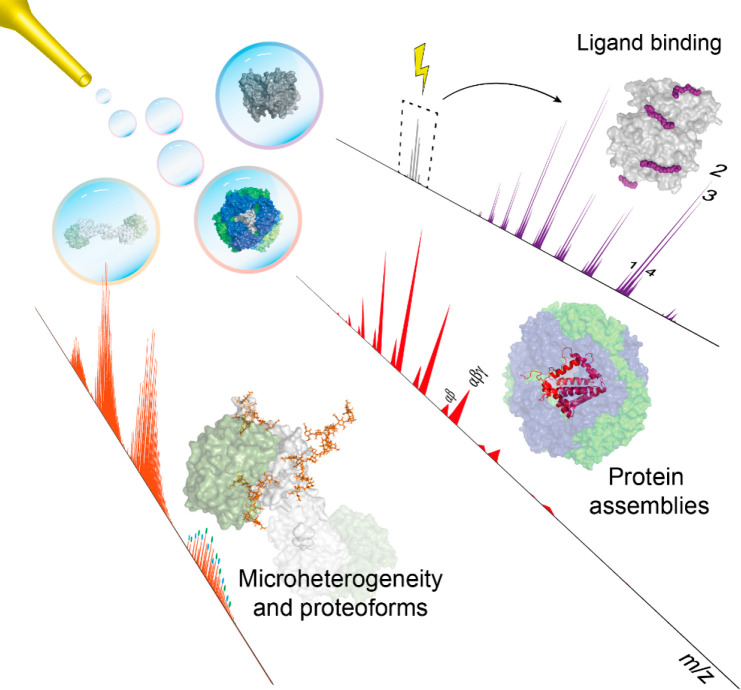
Native mass spectrometry (MS) involves the analysis and characterization of macromolecules, predominantly intact proteins and protein complexes, whereby as much as possible the native structural features of the analytes are retained. As such, native MS enables the study of secondary, tertiary, and even quaternary structure of proteins and other biomolecules. Native MS represents a relatively recent addition to the analytical toolbox of mass spectrometry and has over the past decade experienced immense growth, especially in enhancing sensitivity and resolving power but also in ease of use. With the advent of dedicated mass analyzers, sample preparation and separation approaches, targeted fragmentation techniques, and software solutions, the number of practitioners and novel applications has risen in both academia and industry. This review focuses on recent developments, particularly in high-resolution native MS, describing applications in the structural analysis of protein assemblies, proteoform profiling of─among others─biopharmaceuticals and plasma proteins, and quantitative and qualitative analysis of protein-ligand interactions, with the latter covering lipid, drug, and carbohydrate molecules, to name a few.
Overview
The claims and statistics of this paper haven’t been checked yet.
Run the check — free, no account needed. It reads the open-access text and checks the sources it cites.
Integrity signals
Registry
Cites
Statistics
Figures
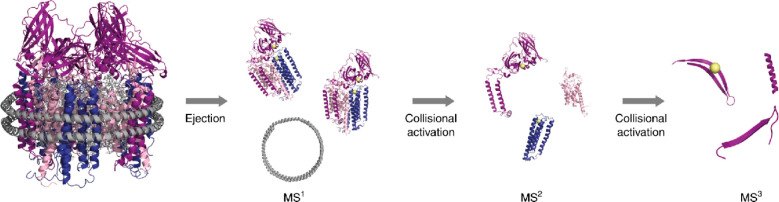
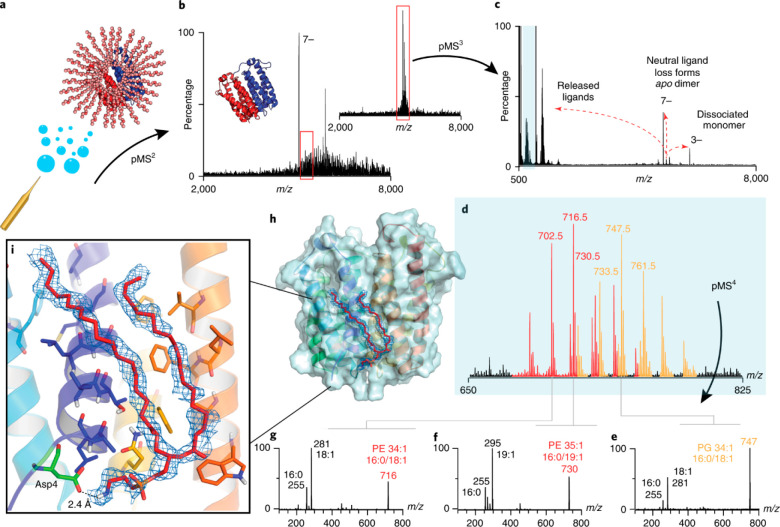
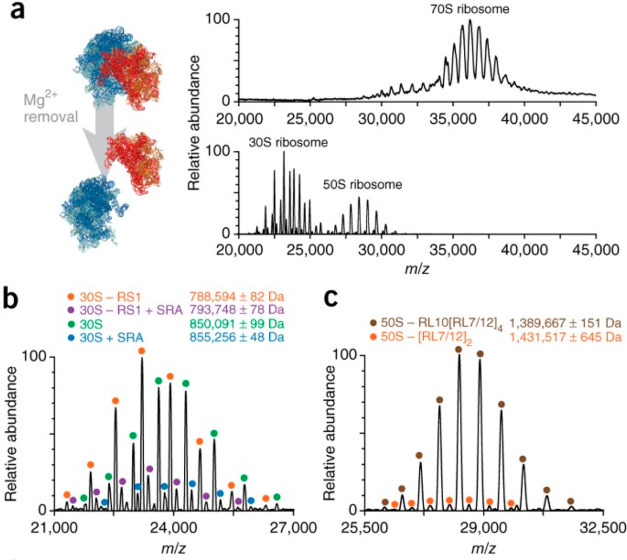
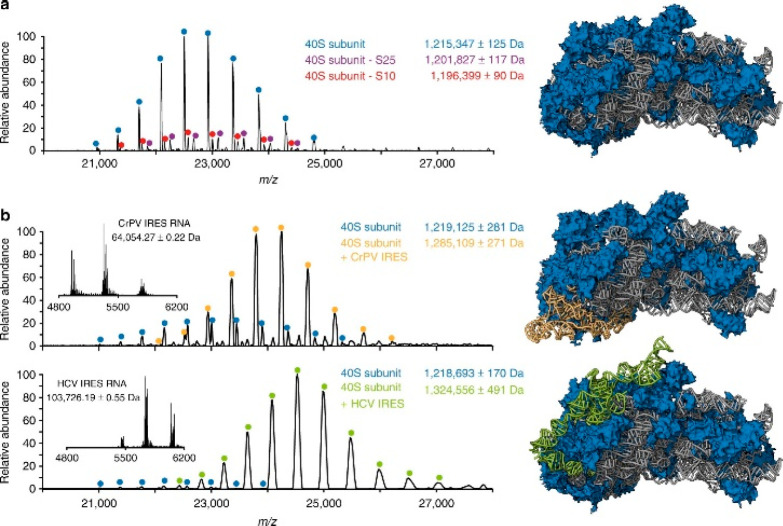
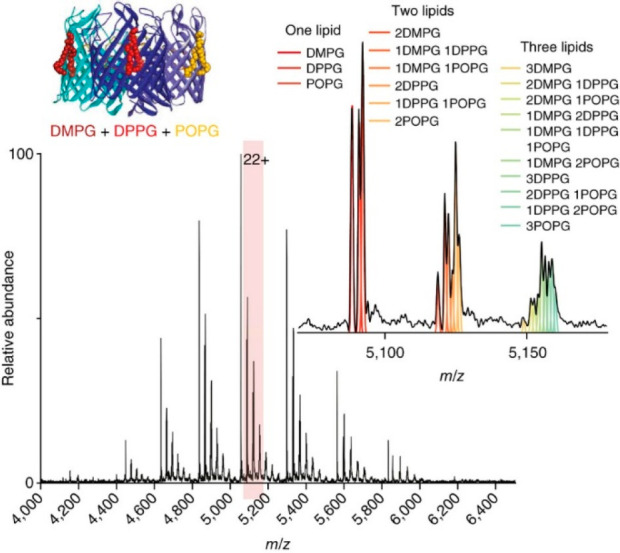
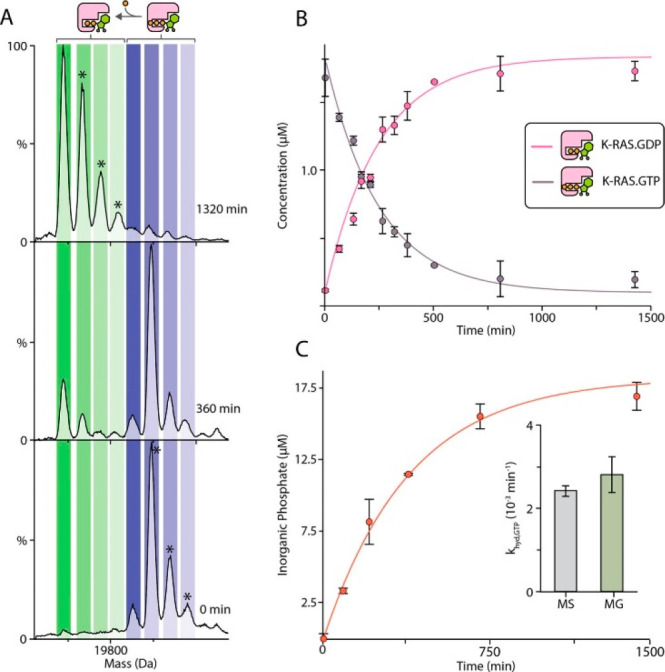
Verification
Claims the paper makes
The claims and statistics of this paper haven’t been checked yet.
Run the check — free, no account needed. It reads the open-access text and checks the sources it cites.
Claims other papers make about this one
Each is checked against this paper’s own text: does it say what the citing paper says it does?
The cited source says what the claim attributes to it.
In the citing paper
“Native mass spectrometry has made significant advances over the last decade and has both been applied to analyze intact proteins and protein complexes which have been extensively reviewed.82,85”
From Connecting metabolome and phenotype: recent advances in functional metabolomics tools for the identification of bioactive natural products (2024) · cites this paper as [82]
Self-check
Percentages, sums and reported differences re-computed from the paper’s own numbers.
The self-check needs the paper’s full text.
Citations
Cites
Electrospray Ionization for Mass Spectrometry of Large Biomolecules
Fenn, J. B., Mann, M., Meng, C. K., Wong, S. F., & Whitehouse, C. M. (1989) · Science · doi:10.1126/science.2675315 · Cited by 7,634
Pushko, P., Pumpens, P., & Grens, E. (2013) · Intervirology · doi:10.1159/000346773 · Cited by 5,975
Anion Recognition and Sensing: The State of the Art and Future Perspectives
Beer, P. D., & Gale, P. A. (2001) · Angewandte Chemie International Edition · doi:10.1002/1521-3773(20010202)40:3 · Cited by 3,633
Peptide and protein sequence analysis by electron transfer dissociation mass spectrometry
Syka, J. E. P., Coon, J. J., Schroeder, M. J., Shabanowitz, J., & Hunt, D. F. (2004) · Proceedings of the National Academy of Sciences · doi:10.1073/pnas.0402700101 · Cited by 2,370
Mass-spectrometric exploration of proteome structure and function
Aebersold, R., & Mann, M. (2016) · Nature · doi:10.1038/nature19949 · Cited by 2,334
Fourier transform ion cyclotron resonance mass spectrometry: A primer
Marshall, A. G., Hendrickson, C. L., & Jackson, G. S. (1998) · Mass Spectrometry Reviews · doi:10.1002/(sici)1098-2787(1998)17:1 · Cited by 1,992
Lessons from nature about solar light harvesting
Scholes, G. D., Fleming, G. R., Olaya-Castro, A., & van Grondelle, R. (2011) · Nature Chemistry · doi:10.1038/nchem.1145 · Cited by 1,915
Olsen, J. V., de Godoy, L. M. F., Li, G., Maček, B., Mortensen, P., Pesch, R., Makarov, A., Lange, O., Horning, S. R., & Mann, M. (2005) · Molecular & Cellular Proteomics · doi:10.1074/mcp.t500030-mcp200 · Cited by 1,539
Site-specific glycan analysis of the SARS-CoV-2 spike
Watanabe, Y., Allen, J. D., Wrapp, D., McLellan, J. S., & Crispin, M. (2020) · Science · doi:10.1126/science.abb9983 · Cited by 1,538
Surface Plasmon Resonance: A Versatile Technique for Biosensor Applications
Nguyen, H. H., Park, J., Kang, S., & Kim, M. (2015) · Sensors · doi:10.3390/s150510481 · Cited by 1,372
Research works printed but not linked: 3
- McNaught A. D., 1997, Compendium of Chemical Terminology: IUPAC Recommendations (The “Gold Book”)
- Mamyrin B. A., 1973, Zh. Ehksp. Teor. Fiz., 64, 82
- Ye B., 2003, Clin. Cancer Res., 9, 2904
Cited by
Sorted by citations
Christofi, E., & Barran, P. E. (2023) · Chemical Reviews · doi:10.1021/acs.chemrev.2c00600 · Cited by 248
Roberts, D. S., Loo, J. A., Tsybin, Y. O., Liu, X., Wu, S., Chamot-Rooke, J., Agar, J. N., Paša-Tolić, L., Smith, L. M., & Ge, Y. (2024) · Nature Reviews Methods Primers · doi:10.1038/s43586-024-00318-2 · Cited by 161
Mass spectrometry using electrospray ionization
Prabhu, G. R. D., Williams, E. R., Wilm, M. S., & Urban, P. L. (2023) · Nature Reviews Methods Primers · doi:10.1038/s43586-023-00203-4 · Cited by 132
Díez-Martín, E., Hernández-Suárez, L., Muñoz‐Villafranca, C., Martin–Souto, L., Astigarraga, E., Ramirez‐Garcia, A., & Barreda‐Gómez, G. (2024) · International Journal of Molecular Sciences · doi:10.3390/ijms25137062 · Cited by 121
“Additionally, it is a versatile method that can be used for other biomolecules like RNA, DNA, and lipids [273,274].”
Dowling, P., Gargan, S., Swandulla, D., & Ohlendieck, K. (2023) · International Journal of Molecular Sciences · doi:10.3390/ijms24032415 · Cited by 103
Regulatory guidelines and preclinical tools to study the biodistribution of RNA therapeutics
Vervaeke, P., Borgos, S. E., Sanders, N. N., & Combes, F. (2022) · Advanced Drug Delivery Reviews · doi:10.1016/j.addr.2022.114236 · Cited by 79
“Consequently, MS-based quantification of an intact mRNA molecule is currently not practically feasible but the recent progress in native mass spectrometry could change this in the relatively near future [80].”
Nguyen, G. T. H., Bennett, J. L., Liu, S., Hancock, S. E., Winter, D. L., Glover, D. J., & Donald, W. A. (2021) · Journal of the American Chemical Society · doi:10.1021/jacs.1c10408 · Cited by 66
Glucose-sensitive insulin with attenuation of hypoglycaemia
Hoeg-Jensen, T., Kruse, T., Brand, C. L., Sturis, J., Fledelius, C., Nielsen, P. K., Nishimura, E., Madsen, A. R., Lykke, L., Halskov, K. S., et al. (2024) · Nature · doi:10.1038/s41586-024-08042-3 · Cited by 65
“Although the native MS data are obtained in the gas phase (MS vacuum), such data often reflect the interactions of molecules corresponding to the aqueous solutions from which the complexes are sampled 19 .”
Vitale, G. A., Geibel, C., Minda, V., Wang, M., Aron, A. T., & Petras, D. (2024) · Natural Product Reports · doi:10.1039/d3np00050h · Cited by 66
Studying protein structure and function by native separation–mass spectrometry
van Schaick, G., Haselberg, R., Somsen, G. W., Wuhrer, M., & Domínguez‐Vega, E. (2022) · Nature Reviews Chemistry · doi:10.1038/s41570-021-00353-7 · Cited by 67
Schwenzer, A., Kruse, L., Jooß, K., & Neusüß, C. (2023) · PROTEOMICS · doi:10.1002/pmic.202300135 · Cited by 64
Liu, R., Xia, S., & Li, H. (2022) · Mass Spectrometry Reviews · doi:10.1002/mas.21793 · Cited by 64
Deciphering combinatorial post-translational modifications by top-down mass spectrometry
Brodbelt, J. S. (2022) · Current Opinion in Chemical Biology · doi:10.1016/j.cbpa.2022.102180 · Cited by 64
“This growing field, “native mass spectrometry”, utilizes electrospray ionization to transfer intact protein assemblies into the gas phase in a manner that preserves quaternary structures [26,110–112].”
InfluentialAnalytical methods for obtaining binding parameters of drug–protein interactions: A review
Wang, L., Zhang, W., Shao, Y., Zhang, D., Guo, G., & Wang, X. (2022) · Analytica Chimica Acta · doi:10.1016/j.aca.2022.340012 · Cited by 56
den Boer, M. A., Lai, S., Xue, X., van Kampen, M. D., Bleijlevens, B., & Heck, A. J. R. (2021) · Analytical Chemistry · doi:10.1021/acs.analchem.1c03656 · Cited by 58
Self-citationWestphall, M. S., Lee, K. W., Salome, A. Z., Lodge, J. M., Grant, T., & Coon, J. J. (2022) · Nature Communications · doi:10.1038/s41467-022-29964-4 · Cited by 57
“From these data we hypothesize that the GroEL ions had lost their condensed-phase structure via: (1) the process of ionization, vaporization, and transport through the MS, (2) lengthy exposure to high vacuum without solvent (i.”
BackgroundMethodInfluentialXu, T., Han, L., & Sun, L. (2022) · Analytical Chemistry · doi:10.1021/acs.analchem.2c00975 · Cited by 54
MALDI mass spectrometry in food carbohydrates analysis: A review of recent researches
Wang, J., Zhao, J. Y., Nie, S., Xie, M., & Li, S. (2022) · Food Chemistry · doi:10.1016/j.foodchem.2022.133968 · Cited by 48
Top-down mass spectrometry of native proteoforms and their complexes: a community study
Habeck, T., Brown, K. A., Soye, B. J. D., Lantz, C., Zhou, M., Alam, N., Hossain, M. A., Jung, W., Keener, J. E., Volný, M., et al. (2024) · Nature Methods · doi:10.1038/s41592-024-02279-6 · Cited by 52
A perspective toward mass spectrometry-based de novo sequencing of endogenous antibodies
de Graaf, S. C., Hoek, M., Tamara, S., & Heck, A. J. R. (2022) · mAbs · doi:10.1080/19420862.2022.2079449 · Cited by 45
“Furthermore, in MS analysis, mass accuracy and resolution typically diminish with increasing molecular weight, even when using the latest high-resolution mass spectrometers.(30,71,72) In addition, full sequence coverage is generally unattainable for intact proteins with masses above 20 kDa.”
BackgroundSelf-citationA Preparative Mass Spectrometer to Deposit Intact Large Native Protein Complexes
Fremdling, P., Esser, T. K., Saha, B., Makarov, A., Fort, K. L., Reinhardt-Szyba, M., Gault, J., & Rauschenbach, S. (2022) · ACS Nano · doi:10.1021/acsnano.2c04831 · Cited by 45
Emergence of mass spectrometry detergents for membrane proteomics
Behnke, J., & Urner, L. H. (2023) · Analytical and Bioanalytical Chemistry · doi:10.1007/s00216-023-04584-z · Cited by 52
“Today, it is well established that the ability to study intact membrane protein complexes by nMS and Nativeomics depends not only on MS instrumentations but also on detergents [14, 55, 58].”
BackgroundDeslignière, E., Yin, V. C., Ebberink, E. H. T. M., Rolland, A. D., Barendregt, A., Wörner, T. P., Nagornov, K. O., Kozhinov, A. N., Fort, K. L., Tsybin, Y. O., et al. (2024) · Nature Methods · doi:10.1038/s41592-024-02207-8 · Cited by 43
Self-citationCurrent Analytical Strategies for mRNA-Based Therapeutics
Camperi, J., Chatla, K., Freund, E. C., Galan, C., Lippold, S., & Guilbaud, A. (2025) · Molecules · doi:10.3390/molecules30071629 · Cited by 47
“This substantiates the high potential of high-resolution native MS for applications of mRNA characterization [90].”
Tang, G., Zhang, J., Ma, S., Li, J., Peng, Z., & Chen, W. (2025) · Chemical Society Reviews · doi:10.1039/d5cs00276a · Cited by 42
Small-molecule binding and sensing with a designed protein family
(2026) · doi:10.1038/s41467-026-70953-8 · Cited by 41
“We also analyzed the cortisol-induced complex by native mass spectrometry 36 , which revealed a molecular weight for the hcy129.”
Label-free visual proteomics: Coupling MS- and EM-based approaches in structural biology
Klykov, O. V., Kopylov, M., Carragher, B. O., Heck, A. J. R., Noble, A. J., & Scheltema, R. A. (2022) · Molecular Cell · doi:10.1016/j.molcel.2021.12.027 · Cited by 37
Self-citationKonermann, L., Liu, Z., Haidar, Y., Willans, M. J., & Bainbridge, N. A. (2023) · Analytical Chemistry · doi:10.1021/acs.analchem.3c02546 · Cited by 38
Zhang, X., Chen, T., Li, V. C., Bo, T., Du, M., & Huang, T. (2022) · Analytical Biochemistry · doi:10.1016/j.ab.2022.114961 · Cited by 36
Wu, G., Yu, C., Wang, W., Du, J., Fu, Z., Xu, G., Li, M., & Wang, L. (2023) · Analytical Chemistry · doi:10.1021/acs.analchem.2c05071 · Cited by 35
Remans, K., Lebendiker, M., Abreu, C., Maffei, M., Sellathurai, S., May, M. M., Vaněk, O., & de Marco, A. (2022) · Microbial Cell Factories · doi:10.1186/s12934-022-01778-5 · Cited by 37
“Additionally, mass photometry [44] or native mass spectrometry [45, 46] can be used as well to check the masses of the entities present in the purified sample.”
BackgroundYin, V. C., Lai, S., Caniels, T. G., Brouwer, P. J. M., Brinkkemper, M., Aldon, Y., Liu, H., Yuan, M., Wilson, I. A., Sanders, R. W., et al. (2021) · ACS Central Science · doi:10.1021/acscentsci.1c00804 · Cited by 36
Self-citationWu, D., & Robinson, C. V. (2022) · Current Opinion in Structural Biology · doi:10.1016/j.sbi.2022.102351 · Cited by 37
Quantification of snake venom proteomes by mass spectrometry‐considerations and perspectives
Calvete, J. J., Lomonte, B., Saviola, A. J., Calderón‐Celis, F., & Encinar, J. R. (2023) · Mass Spectrometry Reviews · doi:10.1002/mas.21850 · Cited by 36
Graphene nano-electromechanical mass sensor with high resolution at room temperature
Shin, D. H., Kim, H., Kim, S. H., Cheong, H., Steeneken, P. G., Joo, C., & Lee, S. W. (2023) · iScience · doi:10.1016/j.isci.2023.105958 · Cited by 35
Bhanot, J. S., Fabijanczuk, K. C., Abdillahi, A. M., Chao, H., Pizzala, N. J., Londry, F. A., Dziekonski, E. T., Hager, J. W., & McLuckey, S. A. (2022) · International Journal of Mass Spectrometry · doi:10.1016/j.ijms.2022.116874 · Cited by 33
Cao, W., Guo, T., Wang, J., Xu, G., Jiang, J., & Liu, D. (2023) · Coordination Chemistry Reviews · doi:10.1016/j.ccr.2023.215450 · Cited by 35
Oligomeric Remodeling by Molecular Glues Revealed Using Native Mass Spectrometry and Mass Photometry
Huang, X., Kamadurai, H., Siuti, P., Ahmed, E., Bennett, J. L., & Donald, W. A. (2023) · Journal of the American Chemical Society · doi:10.1021/jacs.3c02655 · Cited by 31
Orbitrap-Based Mass and Charge Analysis of Single Molecules
Deslignière, E., Rolland, A. D., Ebberink, E. H. T. M., Yin, V. C., & Heck, A. J. R. (2023) · Accounts of Chemical Research · doi:10.1021/acs.accounts.3c00079 · Cited by 37
Self-citationZhang, X., Kwok, T., Zhou, M., Du, M., Li, V. C., Bo, T., Huang, T., & Chen, T. (2022) · Journal of Pharmaceutical and Biomedical Analysis · doi:10.1016/j.jpba.2022.115178 · Cited by 28
Bas, T. G. (2025) · Pharmaceuticals · doi:10.3390/ph18060908 · Cited by 33
Wu, Z., Wang, H., Wu, J., Huang, Y., Zhao, X., Nguyen, J. B., Rosconi, M. P., Pyles, E. A., Qiu, H., & Li, N. (2022) · Journal of Pharmaceutical and Biomedical Analysis · doi:10.1016/j.jpba.2022.115147 · Cited by 29
Wang, Y., Xu, Z., Wu, X., & Wu, Z. (2023) · Green Energy & Environment · doi:10.1016/j.gee.2023.11.003 · Cited by 29
Mass Spectrometry Strategies for O-Glycoproteomics
Helms, A., & Brodbelt, J. S. (2024) · Cells · doi:10.3390/cells13050394 · Cited by 29
Geue, N. (2024) · Analytical Chemistry · doi:10.1021/acs.analchem.4c01028 · Cited by 31
Wu, D., Yan, R., Song, S., Swansiger, A. K., Li, Y., Prell, J. S., Zhou, Q., & Robinson, C. V. (2024) · Nature Communications · doi:10.1038/s41467-024-47948-4 · Cited by 29
“Recent advances in native mass spectrometry (nMS) enable de fi - nition of the heterogeneity and regulation of soluble protein assemblies 19 .”
HLA ‐E: Immune Receptor Functional Mechanisms Revealed by Structural Studies
Gillespie, G. M. A., Quastel, M. N., & McMichael, A. J. (2025) · Immunological Reviews · doi:10.1111/imr.13434 · Cited by 31
Dissecting the structural heterogeneity of proteins by native mass spectrometry
Reid, D. J., Thibert, S. M., & Zhou, M. (2023) · Protein Science · doi:10.1002/pro.4612 · Cited by 28
“…and instrumental advances in all areas of native MS, we refer the reader to the recent special issue of Chemical Reviews (Bennett et al., 2022; Jarrold, 2022; Largy et al., 2022; Rogawski & Sharon, 2022; Rolland & Prell, 2022; Snyder et al., 2022; Tamara et al., 2022; Vallejo et al., 2022).”
BackgroundMethodWijker, S., & Palmans, A. R. A. (2023) · ChemPlusChem · doi:10.1002/cplu.202300260 · Cited by 28
Chapman, E. A., Roberts, D. S., Tiambeng, T. N., Andrews, J., Wang, M.-D., Reasoner, E. A., Melby, J. A., Li, B. H., Kim, D., Alpert, A. J., et al. (2023) · Nature Communications · doi:10.1038/s41467-023-43321-z · Cited by 28
Native Proteomics by Capillary Zone Electrophoresis‐Mass Spectrometry
Wang, Q., Wang, Q., Qi, Z., Moeller, W. J., Wysocki, V. H., & Sun, L. (2024) · Angewandte Chemie International Edition · doi:10.1002/anie.202408370 · Cited by 31
Kwok, T., Zhou, M., Schaefer, A., Bo, T., Li, V. C., Huang, T., & Chen, T. (2022) · Analytical Methods · doi:10.1039/d2ay01670b · Cited by 26
Zhou, L., Liu, Z., Guo, Y., Liu, S., Zhao, H., Zhao, S., Xiao, C., Feng, S., Yang, X., & Wang, F. (2022) · Journal of the American Chemical Society · doi:10.1021/jacs.2c11210 · Cited by 28
Production and characterization of an AAV1-VP3-only capsid: An analytical benchmark standard
Mietzsch, M., Liu, W., Ma, K., Bennett, A. D., Nelson, A. R., Gliwa, K., Chipman, P. R., Fu, X., Bechler, S. L., McKENNA, R. V., et al. (2023) · Molecular Therapy — Methods & Clinical Development · doi:10.1016/j.omtm.2023.05.002 · Cited by 28
“In addition to AEX, native MS has become more common for the assessment of biomolecules under properly folded states.(42,43) However, the heterogeneous nature of AAV capsids poses the challenge of not being able to resolve the charge states of intact AAV particles by utilizing conventional native MS.”
BackgroundRecent advances in computational and experimental protein-ligand affinity determination techniques
Kairys, V., Baranauskienė, L., Kazlauskiene, M., Zubrienė, A., Petrauskas, V., Matulis, D., & Kazlauskas, E. (2024) · Expert Opinion on Drug Discovery · doi:10.1080/17460441.2024.2349169 · Cited by 29
“As the same amount of different substances can result in different signal intensities, proper controls are necessary for any quantitative assessment [220].”
BackgroundTracking the mechanism of covalent molecular glue stabilization using native mass spectrometry
Verhoef, C. J. A., Kay, D. F., Dijck, L. V., Doveston, R. G., Brunsveld, L., Leney, A. C., & Cossar, P. J. (2023) · Chemical Science · doi:10.1039/d3sc01732j · Cited by 27
Zhai, Z., Mavridou, D., Damian, M., Mutti, F. G., Schoenmakers, P. J., & Gargano, A. (2024) · Analytical Chemistry · doi:10.1021/acs.analchem.4c01760 · Cited by 27
Ventouri, I. K., Veelders, S., Passamonti, M., Endres, P., Roemling, R., Schoenmakers, P. J., Somsen, G. W., Haselberg, R., & Gargano, A. (2023) · Analytica Chimica Acta · doi:10.1016/j.aca.2023.341324 · Cited by 28
Translation is an emerging constraint on protein homeostasis in ageing
Llewellyn, J., Hubbard, S. J., & Swift, J. (2024) · Trends in Cell Biology · doi:10.1016/j.tcb.2024.02.001 · Cited by 26
Harvey, S. R., O’Neale, C. V. T., Schey, K. L., & Wysocki, V. H. (2022) · Analytical Chemistry · doi:10.1021/acs.analchem.1c04322 · Cited by 25
Probing heavy metal binding to phycobiliproteins
Bellamy‐Carter, J., Sound, J. K., & Leney, A. C. (2022) · FEBS Journal · doi:10.1111/febs.16396 · Cited by 27
Omics technologies for high-throughput-screening of cell–biomaterial interactions
Sari, B., Işık, M., Eylem, C. C., Bektas, C. K., Okesola, B. O., Karakaya, E., Emregül, E., Nemutlu, E., & Derkuş, B. (2022) · Molecular Omics · doi:10.1039/d2mo00060a · Cited by 25
Sisley, E. K., Hale, O. J., Hughes, J. W., & Cooper, H. J. (2023) · Journal of the American Chemical Society · doi:10.1021/jacs.3c03454 · Cited by 23
Jordan, J. S., Harper, C. C., Zhang, F., Kofman, E., Li, M., Sathiyamoorthy, K., Zaragoza, J. P. T., Fayadat‐Dilman, L., & Williams, E. R. (2024) · Journal of the American Chemical Society · doi:10.1021/jacs.4c05885 · Cited by 24
Membrane Protein Complexity Revealed Through Native Mass Spectrometry
Lawrence, S. A. S., Dolan, A., Miller, M. M., & Robinson, C. V. (2025) · Annual Review of Biochemistry · doi:10.1146/annurev-biochem-081424-044501 · Cited by 28
Woodland, B., Farrell, L. A., Brockbals, L., Rezcallah, M. C., Brennan, A., Sunnucks, E. J., Gould, S. T., Stanczak, A. M., O’Rourke, M. B., & Padula, M. P. (2025) · PROTEOMICS · doi:10.1002/pmic.13983 · Cited by 26
“Native statemassspectrometryandstructuralproteomicsseektoanalyse biomolecules in as close to their native state as possible, involving several techniques, including chemical crosslinking (XL-MS), cryogenic-electron microscopy and Limited Proteolysis (LiP-MS) [197, 198].”
Uncovering hidden protein modifications with native top-down mass spectrometry
Bennett, J. L., El‐Baba, T. J., Zouboulis, K., Kirschbaum, C., Song, H., Butroid, F. I., Benesch, J. L. P., Lutomski, C. A., & Robinson, C. V. (2025) · Nature Methods · doi:10.1038/s41592-025-02846-5 · Cited by 28
“9 and 10).”
Li, H., Jiao, J., Xie, W., Zhao, Y. C., Chen, L., Jiang, J., & Wang, L. (2023) · ACS Materials Letters · doi:10.1021/acsmaterialslett.3c00740 · Cited by 23
Dowling, P., Swandulla, D., & Ohlendieck, K. (2023) · Cells · doi:10.3390/cells12212560 · Cited by 22
Mass spectrometry in gene therapy: Challenges and opportunities for AAV analysis
Serrano, M. A. C., Furman, R., Chen, G., & Tao, L. (2022) · Drug Discovery Today · doi:10.1016/j.drudis.2022.103442 · Cited by 22
Wang, P., Ma, H., Yan, S., Lu, X., Tang, H., Xi, X.-H., Peng, X.-H., Huang, Y., Bao, Y., Cao, M., et al. (2022) · Chemical Science · doi:10.1039/d2sc04775f · Cited by 22
Cui, M., & Du, Y. (2024) · TrAC Trends in Analytical Chemistry · doi:10.1016/j.trac.2024.117701 · Cited by 22
Yin, V. C., Deslignière, E., Mokiem, N. J., Gazi, I., Lood, R., de Haas, C. J. C., Rooijakkers, S. H. M., & Heck, A. J. R. (2024) · Journal of the American Society for Mass Spectrometry · doi:10.1021/jasms.4c00094 · Cited by 24
Self-citationProtein structure and dynamics in the era of integrative structural biology
Grandori, R. (2023) · Frontiers in Biophysics · doi:10.3389/frbis.2023.1219843 · Cited by 22
“Native MS provides species distributions of conformers and supramolecular complexes upon gentle desolvation and ionization, yielding values of stoichiometry and solvent accessible surface area (Tamara et al., 2022).”
BackgroundHuray, K. I. P. L., Wörner, T. P., Moreira, T., Dembek, M., Reinhardt-Szyba, M., Devine, P. W. A., Bond, N. J., Fort, K. L., Makarov, A., & Sobott, F. (2024) · ACS Central Science · doi:10.1021/acscentsci.4c00462 · Cited by 26
Exploring the Impact of In Vitro-Transcribed mRNA Impurities on Cellular Responses
Camperi, J., Roper, B., Freund, E. C., Leylek, R. A., Nissenbaum, A., Galan, C., Caothien, R. H., Hu, Z., Ko, P., Lee, A., et al. (2024) · Analytical Chemistry · doi:10.1021/acs.analchem.4c04162 · Cited by 20
State-of-the-Art and Future Directions in Structural Proteomics
Happonen, L., & Varjosalo, M. T. (2025) · Molecular & Cellular Proteomics · doi:10.1016/j.mcpro.2025.101065 · Cited by 20
Cramer, D. A. T., Franc, V., Čaval, T., & Heck, A. J. R. (2022) · Analytical Chemistry · doi:10.1021/acs.analchem.2c02215 · Cited by 21
Self-citationStandardized workflow for multiplexed charge detection mass spectrometry on orbitrap analyzers
Su, P., McGee, J. P., Hollas, M. A. R., Fellers, R. T., Durbin, K. R., Greer, J. B., Early, B. P., Yip, P. F., Zabrouskov, V., Srzentić, K., et al. (2025) · Nature Protocols · doi:10.1038/s41596-024-01091-y · Cited by 23
“I 2 MS is advantageous for accurate mass measurements of larger proteins and their complexes (>50 kDa), which is increasingly challenging for traditional high-resolution MS as the protein size becomes larger 88 .”
Teng, F., Zhang, J., Huang, Y., Xu, W., Liu, W., Sun, L., Yan, M., Wu, J., Wang, R., Yang, S., et al. (2025) · Cell Reports Medicine · doi:10.1016/j.xcrm.2025.102238 · Cited by 20
Castel, J.-G., Delaux, S., Hernandez‐Alba, O., & Cianférani, S. (2023) · Journal of Pharmaceutical and Biomedical Analysis · doi:10.1016/j.jpba.2023.115696 · Cited by 21
The role of solvation on the conformational landscape of α-synuclein
Kit, M. C. S., Cropley, T. C., Bleiholder, C., Chouinard, C. D., Sobott, F., & Webb, I. K. (2023) · In Analysis · doi:10.1039/d3an01680c · Cited by 8
Mojumdar, A., Yoo, H.-J., Kim, D., Park, J., Park, S., Jeon, E., Choi, S., Choi, J. H., Park, M., Bang, G., et al. (2024) · Journal of Analytical Science & Technology · doi:10.1186/s40543-024-00437-1 · Cited by 19
“Although modern FT-ICR analyzers can be equipped with > 15 T mag-nets, for improvement in resolving power and reduction in electric and magnetic field imperfections, designs with multiple ICR cells have been proposed (Tamara et al. 2021).”
BackgroundMethodInfluentialHecht, E. S., Obiorah, E., Liu, X., Morrison, L. J., Shion, H., & Lauber, M. A. (2022) · Journal of Chromatography A · doi:10.1016/j.chroma.2022.463638 · Cited by 18
Isomer analysis by mass spectrometry in clinical science
Furuhashi, T., & Weckwerth, W. (2022) · TrAC Trends in Analytical Chemistry · doi:10.1016/j.trac.2022.116907 · Cited by 18
Lee, K. W., Salome, A. Z., Westphall, M. S., Grant, T., & Coon, J. J. (2023) · Journal of Proteome Research · doi:10.1021/acs.jproteome.2c00595 · Cited by 18
High-resolution separation of bioisomers using ion cloud profiling
Zhou, X., Wang, Z., Fan, J., & Ouyang, Z. (2023) · Nature Communications · doi:10.1038/s41467-023-37281-7 · Cited by 19
Tuning properties of biocatalysis using protein cage architectures
Wang, Y., & Douglas, T. (2023) · Journal of Materials Chemistry B · doi:10.1039/d3tb00168g · Cited by 18
Fragment-based drug discovery campaigns guided by native mass spectrometry
Sternicki, L. M., & Poulsen, S. (2024) · RSC Medicinal Chemistry · doi:10.1039/d4md00273c · Cited by 21
Ion–Ion Charge Reduction Addresses Multiple Challenges Common to Denaturing Intact Mass Analysis
Bailey, A. O., Huguet, R., Mullen, C., Syka, J. E. P., & Russell, W. K. (2022) · Analytical Chemistry · doi:10.1021/acs.analchem.1c04973 · Cited by 19
Aguinagalde, L., den Boer, M. A., Castenmiller, S. M., Zwarthoff, S. A., de Haas, C. J. C., Aerts, P. C., Beurskens, F. J. M., Schuurman, J., Heck, A. J. R., van Kessel, K. P. M., et al. (2023) · eLife · doi:10.7554/elife.80669 · Cited by 19
Self-citationKhalid, R., Tahir, M., Umar, M., Fang, P., & Li, Y. (2025) · Carbon Energy · doi:10.1002/cey2.70067 · Cited by 18
Probing differences among Aβ oligomers with two triangular trimers derived from Aβ
Kreutzer, A. G., Guaglianone, G., Yoo, S., Parrocha, C. M. T., Ruttenberg, S. M., Malonis, R. J., Tong, K., Lin, Y.-F., Nguyen, J. T., Howitz, W. J., et al. (2023) · Proceedings of the National Academy of Sciences · doi:10.1073/pnas.2219216120 · Cited by 18
“Native mass spectrometry has emerged as a powerful tool for studying protein and peptide complexes in the gas phase while preserving noncovalent interactions (100, 101).”
Li, X. (2023) · Journal of Pharmaceutical and Biomedical Analysis · doi:10.1016/j.jpba.2023.115581 · Cited by 18
Akyol, S., Ashrafi, N., Yılmaz, A., Türkoğlu, O., & Graham, S. F. (2023) · Metabolites · doi:10.3390/metabo13121203 · Cited by 20
“Nevertheless, proteomics studies also confirm rapid changes in cell proliferation and migration and can document not only the abundance of proteins but also dynamic protein–protein interactions [45].”
Makey, D. M., Gadkari, V. V., Kennedy, R. T., & Ruotolo, B. T. (2024) · Analytical Chemistry · doi:10.1021/acs.analchem.4c00477 · Cited by 18
Emerging affinity methods for protein-drug interaction analysis
Zheng, X., Zhu, H., Zhao, X., Wang, J., Li, Q., & Zhao, X. (2024) · Journal of Pharmaceutical and Biomedical Analysis · doi:10.1016/j.jpba.2024.116371 · Cited by 18
Campuzano, I. D. G., & Loo, J. A. (2025) · Journal of the American Society for Mass Spectrometry · doi:10.1021/jasms.4c00348 · Cited by 20
Chatterjee, S., Parson, K. F., Ruotolo, B. T., McCracken, J., Hu, J. P., & Hausinger, R. P. (2022) · Journal of Biological Chemistry · doi:10.1016/j.jbc.2022.102131 · Cited by 17
“Unidentified signals in our native MS likely correspond to buffer component LarETm adducts commonly observed in such data (40, 41).”
BackgroundJames, V. K., Sanders, J. D., Aizikov, K., Fort, K. L., Grinfeld, D., Makarov, A., & Brodbelt, J. S. (2023) · Analytical Chemistry · doi:10.1021/acs.analchem.3c00594 · Cited by 16
Metadata
- Authors
- Tamara, S., den Boer, M. A., & Heck, A. J. R.
- Affiliations
- Utrecht University (NL)
- Biomolecular Mass Spectrometry and Proteomics, Bijvoet Center for Biomolecular Research and Utrecht Institute for Pharmaceutical Sciences, University of Utrecht, Padualaan 8, 3584 CH Utrecht, The Netherlands
- Corresponding author
- Heck, Albert J. R.
- Venue
- Chemical Reviews
- Publisher
- American Chemical Society (ACS)
- Published
- 2021-08-20
- Volume
- 122
- Issue
- 8
- Pages
- 7269-7326
- ISSN
- 0009-2665 (ISSN-L)
- 1520-6890
- PMC
- PMC9052423
- OpenAlex
- W3194897413
- Cited by
- 511
- References
- 494
- Citations by year
- 2026: 95 · 2025: 138 · 2024: 123 · 2023: 95 · 2022: 54 · 2021: 6
- FWCI
- 7.75
- Type
- journal article
- Language
- en
- Open access
- hybrid
- doi.org
- Licence
- Locations
- Chemical Reviews (publishedVersion, cc-by-nc-nd)
- PubMed Central (publishedVersion, cc-by-nc-nd)
- PubMed (publishedVersion)
- Utrecht University Repository (Utrecht University) (submittedVersion, other-oa)
- Funders
- Nederlandse Organisatie voor Wetenschappelijk Onderzoek (NACTAR 16442, SPI.2017.028)
- Topics
- Physical Sciences › Chemistry › Spectroscopy › Mass Spectrometry Techniques and Applications
- Physical Sciences › Chemistry › Spectroscopy › Advanced Proteomics Techniques and Applications
- Life Sciences › Biochemistry, Genetics and Molecular Biology › Molecular Biology › Metabolomics and Mass Spectrometry Studies
- Keywords
- native mass spectrometry, high-resolution mass spectrometry, protein structure, protein complexes, protein assembly, biopharmaceuticals, plasma proteins, protein-ligand interactions, protein-lipid interactions, drug-protein interactions, carbohydrate-protein interactions, mass analyzers
- MeSH terms
- Ligands, Proteins, Mass Spectrometry, Macromolecular Substances
About these checks
Registry, retraction, Cites and statistics results are computed, not judged, with one exception: a printed reference that no index lists is read once by a model before it counts as a citation error. Claims are extracted by a model and kept only when their quote appears verbatim in the text; each cited source is then checked, with a model’s help, for whether it says what the claim relies on. Those verdicts can be wrong — read the claim’s quote and the cited source before relying on one.
Statistics and arithmetic are recomputed, not judged.
Confidence bands are shown only for fields calibrated on our annotated test set. None is calibrated yet, so no band is shown.
What counts as a claim ›How we measure confidence ›How we check this ›
Are you an author, or do you see a problem with this page? Request a review
