

The DOI matches its Crossref record; 425 of the 426 references it cites were found in a registry or an index.
Ultrasound-Responsive Systems as Components for Smart Materials
Open accessAbstract
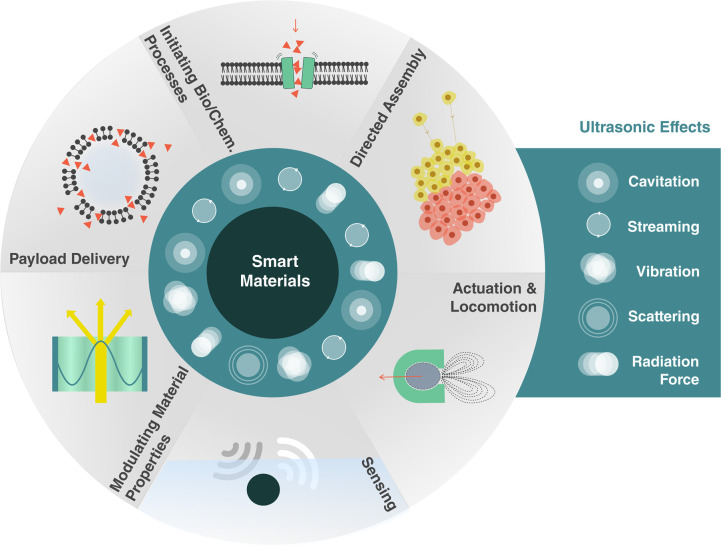
Smart materials can respond to stimuli and adapt their responses based on external cues from their environments. Such behavior requires a way to transport energy efficiently and then convert it for use in applications such as actuation, sensing, or signaling. Ultrasound can carry energy safely and with low losses through complex and opaque media. It can be localized to small regions of space and couple to systems over a wide range of time scales. However, the same characteristics that allow ultrasound to propagate efficiently through materials make it difficult to convert acoustic energy into other useful forms. Recent work across diverse fields has begun to address this challenge, demonstrating ultrasonic effects that provide control over physical and chemical systems with surprisingly high specificity. Here, we review recent progress in ultrasound-matter interactions, focusing on effects that can be incorporated as components in smart materials. These techniques build on fundamental phenomena such as cavitation, microstreaming, scattering, and acoustic radiation forces to enable capabilities such as actuation, sensing, payload delivery, and the initiation of chemical or biological processes. The diversity of emerging techniques holds great promise for a wide range of smart capabilities supported by ultrasound and poses interesting questions for further investigations.
Overview
The claims and statistics of this paper haven’t been checked yet.
Run the check — free, no account needed. It reads the open-access text and checks the sources it cites.
Integrity signals
Registry
Cites
Statistics
Figures
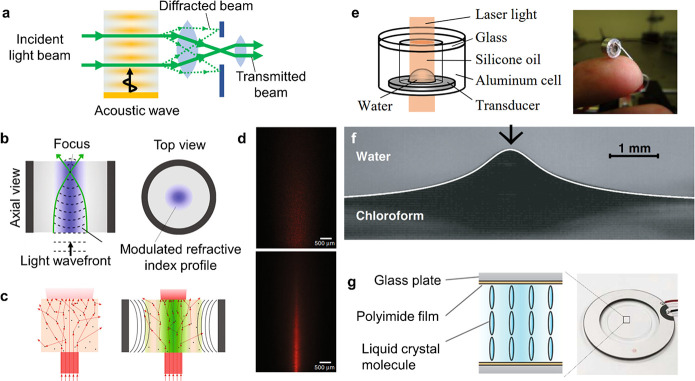
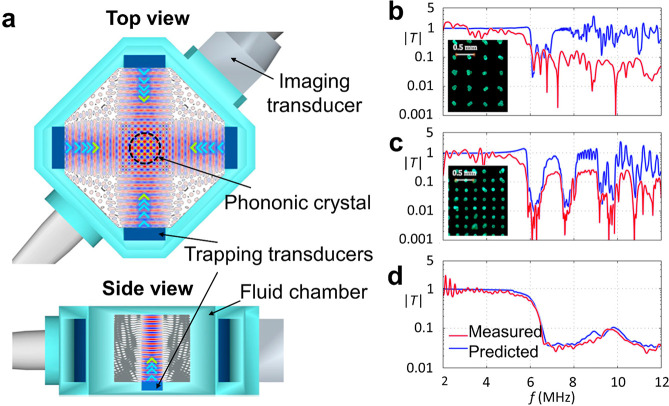
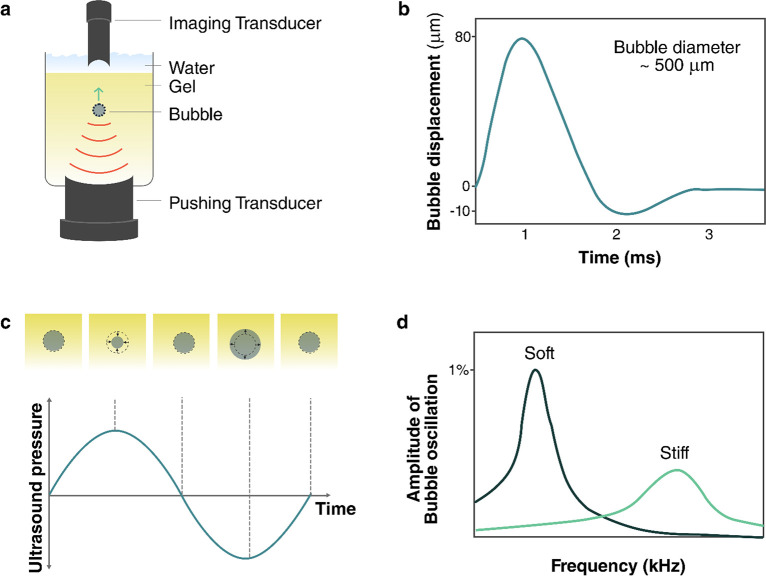
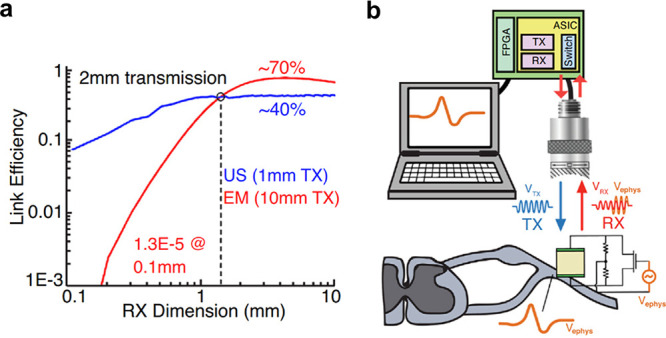
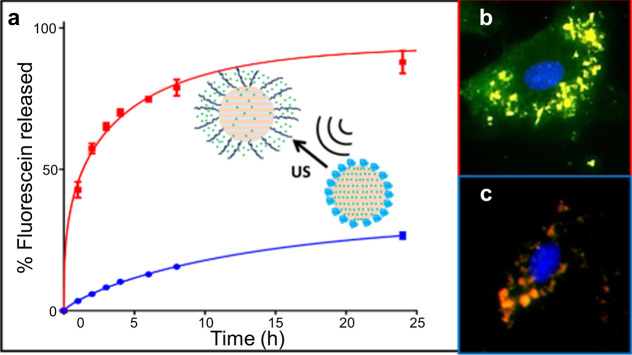
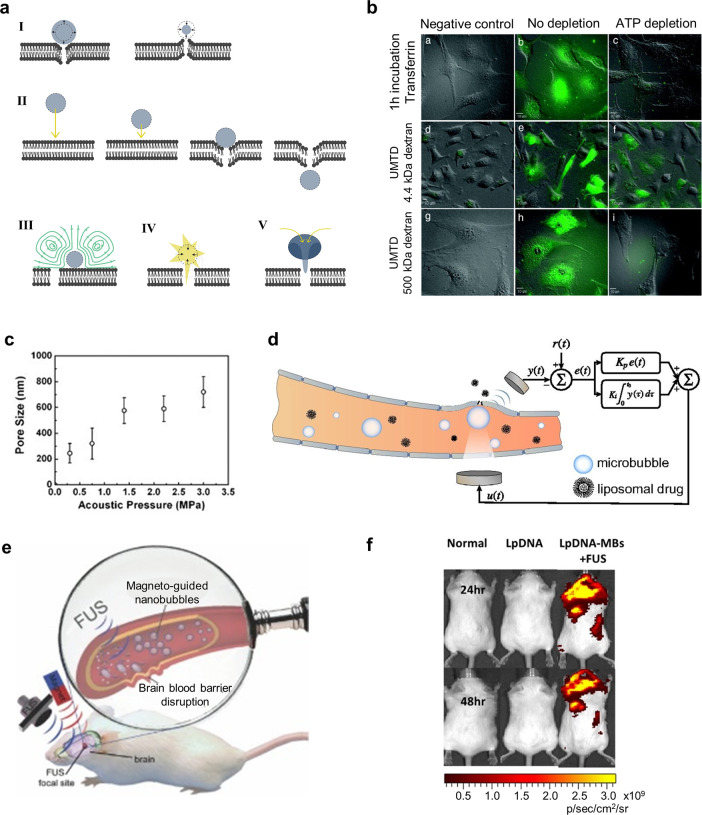
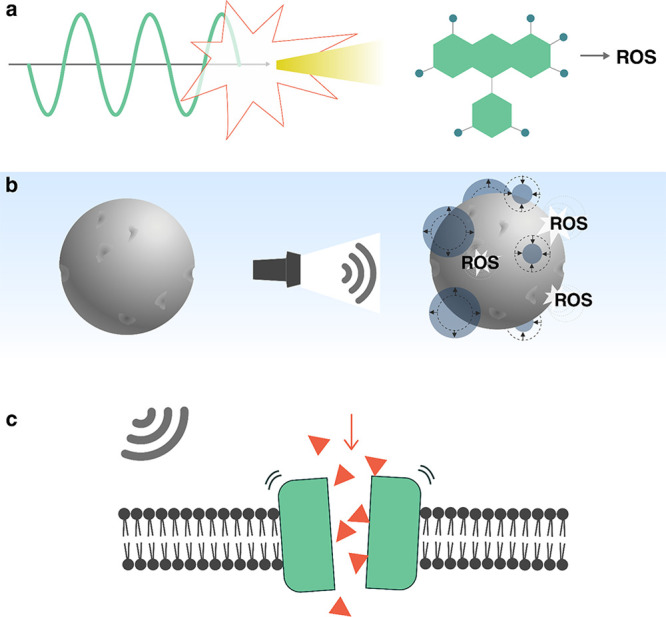
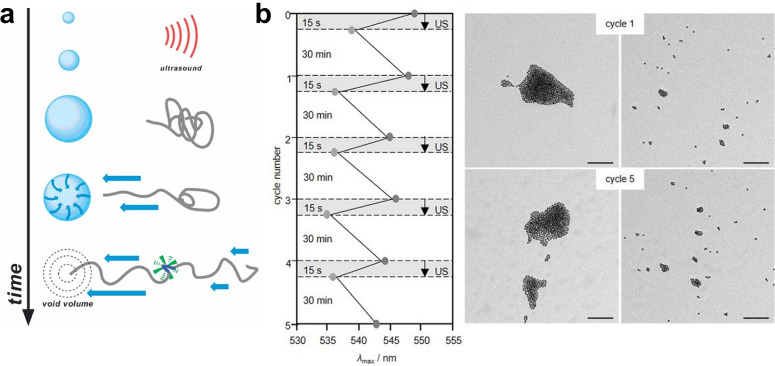
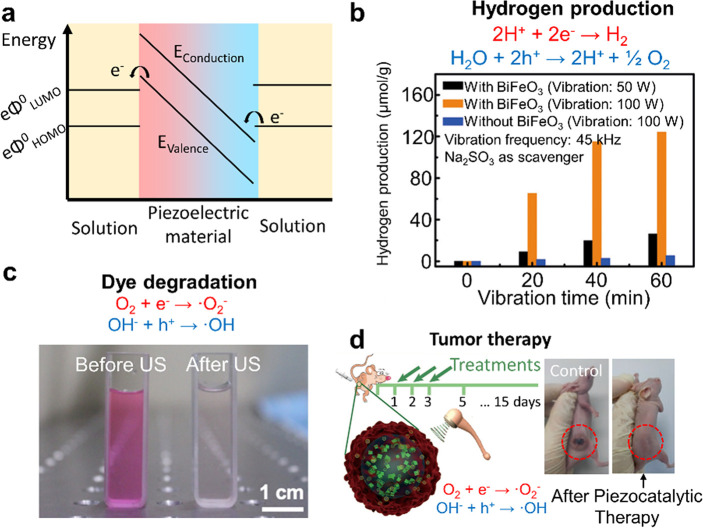
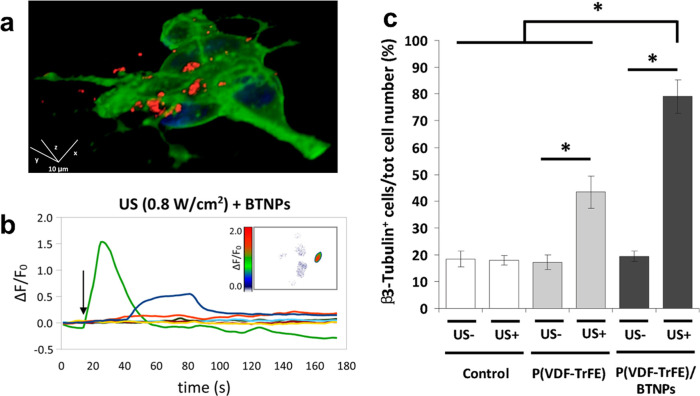
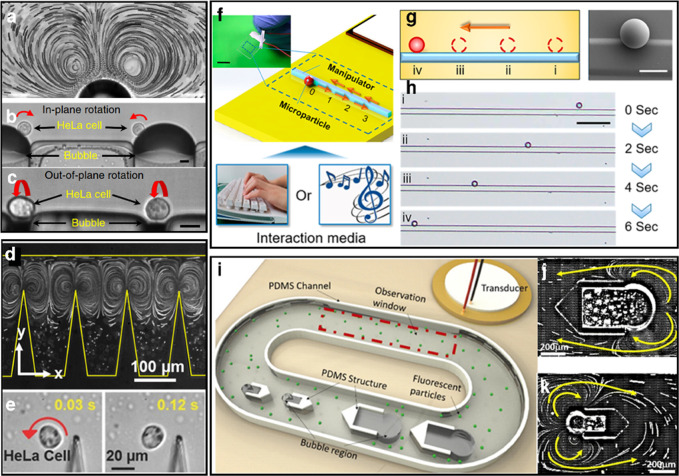
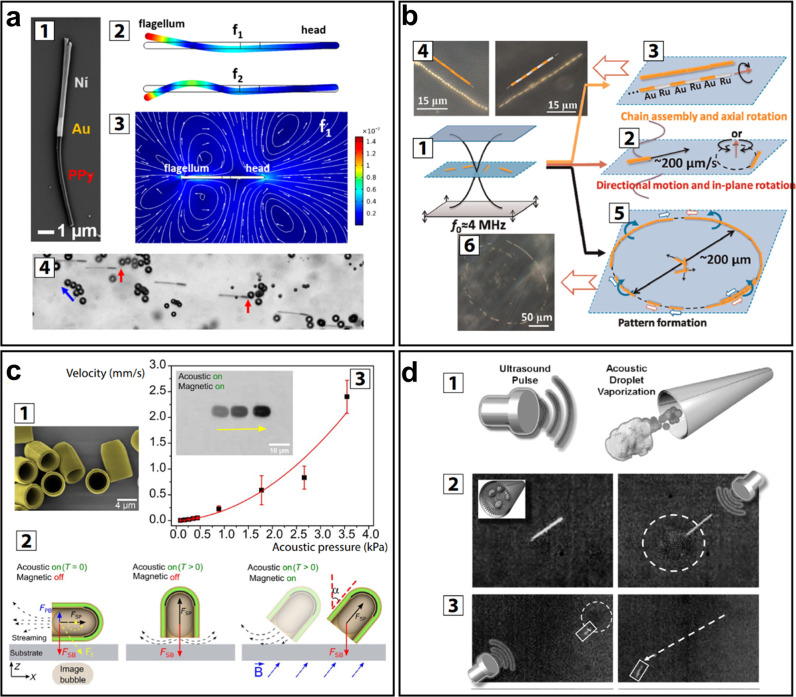
Verification
Claims the paper makes
The claims and statistics of this paper haven’t been checked yet.
Run the check — free, no account needed. It reads the open-access text and checks the sources it cites.
Claims other papers make about this one
Each is checked against this paper’s own text: does it say what the citing paper says it does?
The cited source says what the claim attributes to it.
In the citing paper
“This material converts the mechanical energy from the ultrasound waves into electrical energy, which powers the brain implant (Jiang et al., 2020; Athanassiadis et al., 2021; Birjis et al., 2022).”
From Comparative analysis of energy transfer mechanisms for neural implants (2024) · cites this paper as Athanassiadis et al., 2021
Self-check
Percentages, sums and reported differences re-computed from the paper’s own numbers.
The self-check needs the paper’s full text.
Citations
Cites
Engineering precision nanoparticles for drug delivery
Mitchell, M. J., Billingsley, M. M., Haley, R. M., Wechsler, M. E., Peppas, N. A., & Langer, R. (2021) · Nature Reviews Drug Discovery · doi:10.1038/s41573-020-0090-8 · Cited by 7,933
Regulation of transport pathways in tumor vessels: Role of tumor type and microenvironment
Hobbs, S. K., Monsky, W. L., Yuan, F., Roberts, W. G., Griffith, L., Torchilin, V. P., & Jain, R. K. (1998) · Proceedings of the National Academy of Sciences · doi:10.1073/pnas.95.8.4607 · Cited by 2,438
Imaging and Photodynamic Therapy: Mechanisms, Monitoring, and Optimization
Celli, J. P., Spring, B. Q., Rizvi, I., Evans, C. L., Samkoe, K. S., Verma, S., Pogue, B. W., & Hasan, T. G. (2010) · Chemical Reviews · doi:10.1021/cr900300p · Cited by 2,359
Controlling sound with acoustic metamaterials
Cummer, S. A., Christensen, J., & Alù, A. (2016) · Nature Reviews Materials · doi:10.1038/natrevmats.2016.1 · Cited by 2,216
Ultrasonic metamaterials with negative modulus
Fang, N. X., Xi, D., Xu, J., Ambati, M., Srituravanich, W., Sun, C., & Zhang, X. (2006) · Nature Materials · doi:10.1038/nmat1644 · Cited by 2,040
Microrobots for Minimally Invasive Medicine
Nelson, B. J., Kaliakatsos, I. K., & Abbott, J. J. (2010) · Annual Review of Biomedical Engineering · doi:10.1146/annurev-bioeng-010510-103409 · Cited by 1,967
Alzheimer's Disease and the Amyloid-β Peptide
Murphy, M. P., & LeVine, H. (2010) · Journal of Alzheimer's Disease · doi:10.3233/jad-2010-1221 · Cited by 1,750
APPLICATIONS OF ULTRASOUND TO MATERIALS CHEMISTRY
Suslick, K. S., & Price, G. J. (1999) · Annual Review of Materials Science · doi:10.1146/annurev.matsci.29.1.295 · Cited by 1,708
Nguyen, N., & Wu, Z. (2004) · Journal of Micromechanics and Microengineering · doi:10.1088/0960-1317/15/2/r01 · Cited by 1,701
Using the dynamic bond to access macroscopically responsive structurally dynamic polymers
Wojtecki, R. J., Meador, M. A., & Rowan, S. J. (2010) · Nature Materials · doi:10.1038/nmat2891 · Cited by 1,662
Research works printed but not linked: 9
- Leighton T. G., 1994, The Acoustic Bubble
- Yosioka K., 1955, Acta Acust. Acust., 5, 167
- Gor’kov L. P., 1962, Phys.-Dokl., 6, 773
- Doinikov A. A., 2003, Recent Research Developments in Acoustics, 1, 39
- Yariv, A. Quantum Electronics, 3rd ed. John Wiley & Sons, Inc.: New York, 1989; pp 325–338.
- Handbook of Optoelectronics; Dakin, J., Brown, R. G. W., Eds. Taylor & Francis: New York, 2006; pp 1380–1389.
- Naugol’nykh, K. A.; Ostrovskiĭ, L. A. Nonlinear Wave Processes in Acoustics; Cambridge Texts in Applied Mathematics; Cambridge University Press: New York, 1998; pp 245–291.
- Hamilton M. F., 1986, Nonlinear Wave Propagation in Mechanics
- Alekseev V., 1999, Acoust. Phys., 45, 535
Cited by
Sorted by citations
Current research trends of nanomedicines
Liu, Q., Zou, J., Chen, Z., He, W., & Wu, W. (2023) · Acta Pharmaceutica Sinica B · doi:10.1016/j.apsb.2023.05.018 · Cited by 223
Ultrasound-Based Micro-/Nanosystems for Biomedical Applications
Huang, H. F., Zheng, Y., Chang, M., Song, J., Xia, L., Wu, C., Jia, W., Ren, H., Feng, W., & Chen, Y. (2024) · Chemical Reviews · doi:10.1021/acs.chemrev.4c00009 · Cited by 187
Vijayakanth, T., Shankar, S., Finkelstein‐Zuta, G., Rencus‐Lazar, S., Gilead, S., & Gazit, E. (2023) · Chemical Society Reviews · doi:10.1039/d3cs00202k · Cited by 162
Ma, Q., Yang, H., Zhao, Y., Li, X., Ding, J., Qu, S., Liu, Q., Hu, Z., Li, R., Tao, Q., et al. (2025) · Advanced Science · doi:10.1002/advs.202405835 · Cited by 176
Ferroelectric materials toward next-generation electromechanical technologies
Li, F., Wang, B., Gao, X., Damjanović, D., Chen, L., & Zhang, S. J. (2025) · Science · doi:10.1126/science.adn4926 · Cited by 150
Ultrasound mechanisms and their effect on solid synthesis and processing: a review
Devos, C., Bampouli, A., Brozzi, E., Stefanidis, G. D., Dusselier, M., Gerven, T. V., & Kuhn, S. (2024) · Chemical Society Reviews · doi:10.1039/d4cs00148f · Cited by 146
Li, J., Liu, X., Zheng, Y., Cui, Z., Jiang, H., Li, Z., Zhu, S., & Wu, S. (2023) · Advanced Materials · doi:10.1002/adma.202210296 · Cited by 126
Dual-Responsive Triple-Synergistic Fe-MOF for Tumor Theranostics.
Chen, Z.-W., Sun, Y.-J., Wang, J., Zhou, X., Kong, X., Meng, J.-S., & Zhang, X.-C. (2023) · ACS Nano · doi:10.1021/acsnano.2c10310 · Cited by 109
Compact holographic sound fields enable rapid one-step assembly of matter in 3D
Melde, K., Kremer, H., Shi, M., Seneca, S., Frey, C., Platzman, I., Degel, C., Schmitt, D., Schölkopf, B., & Fischer, P. (2023) · Science Advances · doi:10.1126/sciadv.adf6182 · Cited by 122
Self-citationUltrasound technology and biomaterials for precise drug therapy
Zhao, Z., Saiding, Q., Cai, Z., Cai, M., & Cai, M. (2023) · Materials Today · doi:10.1016/j.mattod.2022.12.004 · Cited by 108
Ultrasound-Induced Drug Release from Stimuli-Responsive Hydrogels
Yeingst, T. J., Arrizabalaga, J. H., & Hayes, D. J. (2022) · Gels · doi:10.3390/gels8090554 · Cited by 93
Han, X., Chen, S., Cai, Z., Zhu, Y., Yi, W., Guan, M., Liao, B., Zhang, Y., Shen, J., Cui, W., et al. (2023) · Advanced Functional Materials · doi:10.1002/adfm.202213008 · Cited by 91
Wang, Y., Zang, P., Yang, D., Zhang, R., Gai, S., & Yang, P. (2023) · Materials Horizons · doi:10.1039/d2mh01221a · Cited by 89
Advanced supramolecular design for direct ink writing of soft materials
Tang, M., Zhong, Z., & Ke, C. (2023) · Chemical Society Reviews · doi:10.1039/d2cs01011a · Cited by 86
Bimetallic Organic Frameworks of High Piezovoltage for Sono‐Piezo Dynamic Therapy
Wang, Q., Tian, Y., Yao, M., Fu, J., Wang, L., & Zhu, Y. (2023) · Advanced Materials · doi:10.1002/adma.202301784 · Cited by 87
Hydrogel Fibers‐Based Biointerfacing
Chen, X., Feng, Y., Zhang, P., Ni, Z., Xue, Y., & Liu, J. (2024) · Advanced Materials · doi:10.1002/adma.202413476 · Cited by 93
Tough adhesion enhancing strategies for injectable hydrogel adhesives in biomedical applications
Ouyang, C., Yu, H., Wang, L., Ni, Z., Liu, X., Shen, D., Yang, J., Shi, K., & Wang, H. (2023) · Advances in Colloid and Interface Science · doi:10.1016/j.cis.2023.102982 · Cited by 82
Stimuli-responsive smart materials for biomedical applications
Lin, C. H., Yang, M., Zhang, F., Liu, Y., & JinSong, L. E. N. G. (2025) · Materials Science and Engineering R Reports · doi:10.1016/j.mser.2025.101126 · Cited by 82
Delivering Mechanical Stimulation to Cells: State of the Art in Materials and Devices Design
Zhang, Y., & Habibović, P. (2022) · Advanced Materials · doi:10.1002/adma.202110267 · Cited by 85
Ultrasound-responsive matters for biomedical applications
Huang, D., Wang, J., Song, C., & Zhao, Y. (2023) · The Innovation · doi:10.1016/j.xinn.2023.100421 · Cited by 74
Sun, Y., Chen, L., Fan, X., & Pang, J. (2022) · International Journal of Nanomedicine · doi:10.2147/ijn.s374247 · Cited by 76
Cai, L., Sun, T., Han, F., Zhang, H., Zhao, J., Hu, Q., Shi, T., Zhou, X., Cheng, F., Peng, C., et al. (2024) · Journal of the American Chemical Society · doi:10.1021/jacs.4c14489 · Cited by 70
Recent advances of smart materials for ocular drug delivery
Wang, X., Luan, F., Yue, H., Song, C., Wang, S., Feng, J., Zhang, X., Yang, W. H., Li, Y., Wei, W., et al. (2023) · Advanced Drug Delivery Reviews · doi:10.1016/j.addr.2023.115006 · Cited by 70
Ultrasound-responsive smart composite biomaterials in tissue repair
Han, X., Yi, W., Chen, S., Cai, Z., Zhu, Y., Wang, H., Guo, X., Shen, J., Cui, W., & Bai, D. (2023) · Nano Today · doi:10.1016/j.nantod.2023.101804 · Cited by 70
Towards precision medicine using biochemically triggered cleavable conjugation
Parshad, B., Arora, S., Singh, B., Pan, Y., Tang, J., Hu, Z., & Patra, H. K. (2025) · Communications Chemistry · doi:10.1038/s42004-025-01491-5 · Cited by 71
Chen, S., Han, X., Cao, Y., Yi, W., Zhu, Y., Ding, X., Li, K., Shen, J., Cui, W., & Bai, D. (2023) · Advanced Functional Materials · doi:10.1002/adfm.202308205 · Cited by 64
Ahmed, F., Hussain, M. M., Khan, W. U., & Xiong, H. (2023) · Coordination Chemistry Reviews · doi:10.1016/j.ccr.2023.215486 · Cited by 62
Metareview: a survey of active matter reviews
Vrugt, M. T., & Wittkowski, R. (2025) · The European Physical Journal E · doi:10.1140/epje/s10189-024-00466-z · Cited by 82
Small‐Scale Robotics with Tailored Wettability
Wang, B., Handschuh‐Wang, S., Shen, J., Zhou, X., Guo, Z., Liu, W., Pumera, M., & Zhang, L. (2022) · Advanced Materials · doi:10.1002/adma.202205732 · Cited by 60
Recent advances of hydrogels as smart dressings for diabetic wounds
Wang, X., Yang, Y., Zhao, W., Zhu, Z., & Pei, X. (2024) · Journal of Materials Chemistry B · doi:10.1039/d3tb02355a · Cited by 63
Ultrasound-assisted tissue engineering
Melde, K., Athanassiadis, A. G., Missirlis, D., Shi, M., Seneca, S., & Fischer, P. (2024) · Nature Reviews Bioengineering · doi:10.1038/s44222-024-00166-5 · Cited by 59
Self-citationResearch progress of stimuli-responsive ZnO-based nanomaterials in biomedical applications
Weng, Z., Xu, Y., Gao, J., & Wang, X. (2022) · Biomaterials Science · doi:10.1039/d2bm01460b · Cited by 59
Advances in ultrasound-responsive hydrogels for biomedical applications
Zhou, Y., Liu, G., & Guo, S. (2022) · Journal of Materials Chemistry B · doi:10.1039/d2tb00541g · Cited by 60
Newly developed gas-assisted sonodynamic therapy in cancer treatment
Pan, M., Hu, D., Yuan, L., Yu, Y., Li, Y., & Qian, Z. (2022) · Acta Pharmaceutica Sinica B · doi:10.1016/j.apsb.2022.12.021 · Cited by 59
He, J., Liu, Z., Zhu, X., Xia, H., Gao, H., & Lu, J. G. (2022) · Pharmaceutics · doi:10.3390/pharmaceutics14081642 · Cited by 56
Ultrasound Nanobubble Coupling Agent for Effective Noninvasive Deep‐Layer Drug Delivery
Han, X., Wang, F., Shen, J., Chen, S., Xiao, P., Zhu, Y., Yi, W., Zhao, Z., Cai, Z., Cui, W., et al. (2023) · Advanced Materials · doi:10.1002/adma.202306993 · Cited by 55
Engineering Stimuli‐Responsive Materials for Precision Medicine
Zheng, R., Chang, Y., Yao, D., Cai, M., Zhang, L., Ye, F., & Huang, X. (2024) · Small · doi:10.1002/smll.202406439 · Cited by 57
Zhang, L., Zhang, B., Liang, R., Ran, H., Zhu, D., Ren, J., Liu, L., Ma, A.-Q., & Cai, L. (2023) · ACS Nano · doi:10.1021/acsnano.2c11258 · Cited by 53
Han, X., Shen, J., Chen, S., Cai, Z., Zhu, Y., Yi, W., Li, K., Cai, W., Tao, B., Cui, W., et al. (2023) · Biomaterials · doi:10.1016/j.biomaterials.2023.122057 · Cited by 53
Zhuang, W., Zhang, Y., Luo, Q., Du, S., Wu, B., & Sui, M. (2024) · Chemical Engineering Journal · doi:10.1016/j.cej.2024.155956 · Cited by 52
Liu, Y., Yin, Q., Luo, Y., Huang, Z., Cheng, Q., Zhang, W., Zhou, B., Zhou, Y., & Ma, Z. (2023) · Ultrasonics Sonochemistry · doi:10.1016/j.ultsonch.2023.106441 · Cited by 51
Self-citationRecent Process in Microrobots: From Propulsion to Swarming for Biomedical Applications
Wu, R., Zhu, Y. F., Cai, X., Wu, S., Xu, L., & Yu, T. (2022) · Micromachines · doi:10.3390/mi13091473 · Cited by 51
Zhao, R., Zhu, H., Feng, L., Zhu, Y., Liu, B., Yu, C., Gai, S., & Yang, P. (2023) · Small · doi:10.1002/smll.202301349 · Cited by 49
Soft Bio‐Microrobots: Toward Biomedical Applications
Wang, Z., Klingner, A., Magdanz, V., Misra, S., & Khalil, I. S. M. (2023) · Advanced Intelligent Systems · doi:10.1002/aisy.202300093 · Cited by 49
Sonogenetics for Monitoring and Modulating Biomolecular Function by Ultrasound
Hahmann, J., Ishaqat, A., Lammers, T., & Herrmann, A. (2024) · Angewandte Chemie International Edition · doi:10.1002/anie.202317112 · Cited by 49
Perfluorocarbons: A perspective of theranostic applications and challenges
Kakaei, N., Amirian, R., Azadi, M., Mohammadi, G., & Izadi, Z. (2023) · Frontiers in Bioengineering and Biotechnology · doi:10.3389/fbioe.2023.1115254 · Cited by 47
Fu, J., Wu, S., Zhu, S., Zheng, Y., Jiang, H., Wang, D., Li, Z., Cui, Z., & Liu, X. (2023) · Advanced Functional Materials · doi:10.1002/adfm.202304162 · Cited by 47
Advanced Ultrasound Energy Transfer Technologies using Metamaterial Structures
Imani, I. M., Kim, H. S., Shin, J., Lee, D., Park, J., Vaidya, A., Kim, C., Baik, J. M., Zhang, Y. S., Kang, H., et al. (2024) · Advanced Science · doi:10.1002/advs.202401494 · Cited by 44
Acoustic Trapping: An Emerging Tool for Microfabrication Technology
Yin, C., Jiang, X., Mann, S., Tian, L., & Drinkwater, B. W. (2023) · Small · doi:10.1002/smll.202207917 · Cited by 41
Magnetically responsive nanofibrous ceramic scaffolds for on-demand motion and drug delivery
Zhang, Y., Li, J., & Habibović, P. (2022) · Bioactive Materials · doi:10.1016/j.bioactmat.2022.02.028 · Cited by 42
Super‐White Boron Nitride Aerogel‐Enabled High‐Energy Laser Irradiation Protection
Chai, Y., Li, G., Ji, X., & Zhang, X. (2023) · Advanced Functional Materials · doi:10.1002/adfm.202304355 · Cited by 40
A review on synthesis, capping and applications of superparamagnetic magnetic nanoparticles
Muthukumaran, T., & Philip, J. (2024) · Advances in Colloid and Interface Science · doi:10.1016/j.cis.2024.103314 · Cited by 43
Garg, A., Akkinepally, B., Sarkar, J., & Pattanayek, S. K. (2025) · Physics of Fluids · doi:10.1063/5.0278915 · Cited by 37
Application of Nanomaterial-Based Sonodynamic Therapy in Tumor Therapy
Yang, N., Li, J., Yu, S., Xia, G., Li, D., Yuan, L., Wang, Q., Ding, L., Fan, Z., & Li, J. (2024) · Pharmaceutics · doi:10.3390/pharmaceutics16050603 · Cited by 38
Hu, D., Liu, S., Qi, L., Liang, J., & Zhang, G. (2024) · Journal of environmental chemical engineering · doi:10.1016/j.jece.2024.114307 · Cited by 35
New opportunities of stimulus-responsive smart nanocarriers in cancer therapy
Liu, X., He, F., & Liu, M. (2024) · Nano Materials Science · doi:10.1016/j.nanoms.2024.10.013 · Cited by 35
Dong, L., Li, W., Luo, Y., Liu, C., Li, K., Chen, Y., & Hong, G. (2023) · Advanced Functional Materials · doi:10.1002/adfm.202302541 · Cited by 35
The advance of ultrasound-enabled diagnostics and therapeutics
Han, B., Liu, Y., Zhou, Q., Yu, Y., Liu, X., Guo, Y., Zheng, X., Zhou, M., Yu, H., & Wang, W. (2024) · Journal of Controlled Release · doi:10.1016/j.jconrel.2024.08.039 · Cited by 33
Polymer Mechanochemistry in Microbubbles
Xuan, M., Fan, J., Khiêm, V. N., Zou, M., Brenske, K., Mourran, A., Vinokur, R. A., Zheng, L., Itskov, M., Göstl, R., et al. (2023) · Advanced Materials · doi:10.1002/adma.202305130 · Cited by 31
Multistimuli-responsive microrobots: A comprehensive review
Shah, Z. H., Wu, B., & Das, S. (2022) · Frontiers in Robotics and AI · doi:10.3389/frobt.2022.1027415 · Cited by 31
Self-assembly of nanoparticles with stimulated responses at liquid interfaces
Fu, Y., Zhao, S., Chen, W., Zhang, Q., & Chai, Y. (2023) · Nano Today · doi:10.1016/j.nantod.2023.102073 · Cited by 31
Ultrasound-nanovesicles interplay for theranostics
Liu, J., You, Q., Liang, F., Ma, L., Zhu, L., Wang, C., & Yang, Y. (2024) · Advanced Drug Delivery Reviews · doi:10.1016/j.addr.2023.115176 · Cited by 29
Smart Bioorthogonal Nanozymes: From Rational Design to Appropriate Bioapplications
Zhang, B., Zhu, J., Ren, J., & Qu, X. (2024) · Advanced Materials · doi:10.1002/adma.202405318 · Cited by 29
Jiang, M., Fang, H., & Tian, H. (2025) · Journal of Controlled Release · doi:10.1016/j.jconrel.2025.01.063 · Cited by 30
Liu, J., Zhao, Z., Deng, C., Zanni, R., Weichselbaum, R. R., & Lin, W. (2025) · Journal of the American Chemical Society · doi:10.1021/jacs.5c06488 · Cited by 30
RetractedZhong, X., Li, X., Gu, L., Yang, H., Du, J., Wang, Q., Li, Y., & Miao, Y. (2024) · Journal of Colloid and Interface Science · doi:10.1016/j.jcis.2024.10.108 · Cited by 28
Intelligent Sonocatalytic Nanoagents for Energy Conversion‐Based Therapies
Feng, Z., Xiang, X., Huang, J., Wang, L., Zhu, B., Zhou, H., Pang, H., Cheng, C., Ma, L., & Qiu, L. (2023) · Advanced Functional Materials · doi:10.1002/adfm.202302579 · Cited by 27
Smart Materials and Devices for Enhanced Delivery of Extracellular Vesicles
You, Y., Liu, M., Yan, N. J., Zhu, D., Cheng, X., Hu, Y., Li, Y., Qin, Z., Zhu, Z., & Cheng, K. (2025) · Advanced Materials · doi:10.1002/adma.202501081 · Cited by 27
Effects of sound energy on proteins and their complexes
Kozell, A., Solomonov, A. V., & Shimanovich, U. (2023) · FEBS Letters · doi:10.1002/1873-3468.14755 · Cited by 28
Acoustic Cell Patterning for Structured Cell‐Laden Hydrogel Fibers/Tubules
Yin, Q., Luo, Y., Yu, X., Chen, K., Li, W., Huang, H., Zhang, L., Zhou, Y., Zhu, B., Ma, Z., et al. (2024) · Advanced Science · doi:10.1002/advs.202308396 · Cited by 26
Self-citationProgrammable materials: Current trends, challenges, and perspectives
Scalet, G. (2024) · Applied Materials Today · doi:10.1016/j.apmt.2024.102372 · Cited by 30
Sono-processes: Emerging systems and their applicability within the (bio-)medical field
Siebenmorgen, C. M., Poortinga, A. T., & van Rijn, P. (2023) · Ultrasonics Sonochemistry · doi:10.1016/j.ultsonch.2023.106630 · Cited by 26
Mechanochemical Activation of DNAzyme by Ultrasound
Rath, W. H., Göstl, R., & Herrmann, A. (2024) · Advanced Science · doi:10.1002/advs.202306236 · Cited by 25
Exploiting sound for emerging applications of extracellular vesicles
Wu, Z., Cai, H., Tian, C., Ao, Z., Jiang, L., & Guo, F. (2023) · Nano Research · doi:10.1007/s12274-023-5840-6 · Cited by 24
Massaro, A. S. (2023) · Electronics · doi:10.3390/electronics12183772 · Cited by 26
Advances in Nanomaterials for Immunotherapeutic Improvement of Cancer Chemotherapy
Liu, J., Li, B., Li, L., Ming, X., & Xu, Z. P. (2024) · Small · doi:10.1002/smll.202403024 · Cited by 23
Su, G.-L., Peng, Y., Ruan, H., Cheng, J., Deng, T., & Zhang, Y. (2025) · Materials Today Bio · doi:10.1016/j.mtbio.2025.101863 · Cited by 33
Antibubbles Enable Tunable Payload Release with Low‐Intensity Ultrasound
Moreno-Gómez, N., Athanassiadis, A. G., Poortinga, A. T., & Fischer, P. (2023) · Advanced Materials · doi:10.1002/adma.202305296 · Cited by 24
Self-citationShen, Q., Li, Z., Wang, Y., Meyer, M. D., Guzman, M. T. D., Lim, J. C., Xiao, H., Bouchard, R. R., & Lu, G. J. (2024) · Advanced Materials · doi:10.1002/adma.202307123 · Cited by 24
Sound Continuous Production of Thermosets
Yao, G., Xiang, H., Lucas, M., Gao, H., Zheng, L., Wu, D., Han, Z., Lai, J., & Wang, C. (2023) · Advanced Functional Materials · doi:10.1002/adfm.202312736 · Cited by 22
Zhang, J., Zhou, N., Dong, E., Zhang, C., Song, Z., Liu, S., Chen, Y., Su, X., Wang, S., & Zhang, Y. (2024) · Matter · doi:10.1016/j.matt.2024.06.048 · Cited by 22
Application of 4D printing and bioprinting in cardiovascular tissue engineering
Zhou, Z., Tang, W., Yang, J., & Fan, C. (2023) · Biomaterials Science · doi:10.1039/d3bm00312d · Cited by 22
Comparative analysis of energy transfer mechanisms for neural implants
Miziev, S., Pawlak, W. A., & Howard, N. (2024) · Frontiers in Neuroscience · doi:10.3389/fnins.2023.1320441 · Cited by 21
LIFU-unlocked endogenous H2S generation for enhancing atherosclerosis-specific gas-enzymatic therapy
An, H., Qiu, X., Wang, X., Du, C., Guo, X., Hou, S., Xu, M., Wang, J., Chen, C., Ran, H., et al. (2024) · Biomaterials · doi:10.1016/j.biomaterials.2024.122972 · Cited by 22
Yang, F., Lv, J., Huang, Y., Ma, W., & Yáng, Z. (2024) · Biomaterials · doi:10.1016/j.biomaterials.2024.123006 · Cited by 23
Site-Specific Transformable Nanostructures for Cancer Therapy and Diagnosis
Kim, J., Lee, Y., Kim, Y., Rha, H., Kim, D., Debnath, S., Pu, K., Kang, H., & Kim, J. S. (2025) · Chemical Reviews · doi:10.1021/acs.chemrev.5c00297 · Cited by 22
Cavitation bubble structures below a soft boundary in an ultrasonic field
Li, F., Huang, C., Zhang, X., Wang, C., Hu, J., Shi, C., Tian, H., Shen, Z.-Z., Guo, J., & Lin, S. (2023) · Ultrasonics Sonochemistry · doi:10.1016/j.ultsonch.2023.106500 · Cited by 21
Application of stimuli-responsive nanomedicines for the treatment of ischemic stroke
Zhan, Y., Dai, Y., Ding, Z., Lu, M., He, Z., Chen, Z., Liu, Y., Li, Z., Cheng, G., Peng, S., et al. (2024) · Frontiers in Bioengineering and Biotechnology · doi:10.3389/fbioe.2023.1329959 · Cited by 21
Sonochemical treatment for removal of aqueous organic pollutants: principles, overview and prospects
Hu, D., Liu, S., & Zhang, G. (2024) · Separation and Purification Technology · doi:10.1016/j.seppur.2024.128264 · Cited by 21
Rouhi, N., Chakeri, Z., Ghorbani Nejad, B., Rahimzadegan, M., Rafi Khezri, M., Kamali, H., & Nosrati, R. (2024) · Heliyon · doi:10.1016/j.heliyon.2024.e37533 · Cited by 20
Gonçalves, R. C., Oliveira, M. B., & Mano, J. F. (2024) · Materials Horizons · doi:10.1039/d4mh00431k · Cited by 20
Smart self-healing and self-reporting coatings – an overview
Saji, V. S. (2025) · Progress in Organic Coatings · doi:10.1016/j.porgcoat.2025.109318 · Cited by 20
Research Progress of Osteoarthritis Treatment by Low Intensity Pulsed Ultrasound
Guan, M., Zhang, X., Li, X., Liao, B., Wang, H., Tan, J., Wang, Z., Wang, L., Shen, J., Han, X., et al. (2025) · Smart Medicine · doi:10.1002/smmd.70003 · Cited by 22
Insulator-on-Conductor Fouling Amplifies Aqueous Electrolysis Rates
Rodriguez, H. M., Martyniuk, M. P., Iyer, K. S., & Ciampi, S. (2024) · Journal of the American Chemical Society · doi:10.1021/jacs.3c11238 · Cited by 20
Wu, G., Dou, W., Zheng, F., & Yang, H. (2024) · Coordination Chemistry Reviews · doi:10.1016/j.ccr.2024.216107 · Cited by 21
Ultrasound-activated mechanochemical reactions for controllable biomedical applications
Zuo, M., Xiao, R., Du, F., Cheng, C., Rodriguez, R. D. D., Ma, L., Zhu, B., & Qiu, L. (2024) · Smart Materials in Medicine · doi:10.1016/j.smaim.2024.09.001 · Cited by 19
Superselective embolic particle guidance in vessel networks via shape-adaptive acoustic manipulation
Luo, Y., Yin, Q., Chen, K., Deng, Z., Liu, X., Zhou, Y., Zhu, B., Zhang, W., & Ma, Z. (2025) · Nature Communications · doi:10.1038/s41467-024-55478-2 · Cited by 18
Self-citationZheng, S., Sun, D., & Zhu, Z. (2025) · Trends in Food Science & Technology · doi:10.1016/j.tifs.2025.105247 · Cited by 18
The Kirkwood–Bethe hypothesis for bubble dynamics, cavitation, and underwater explosions
Denner, F. (2024) · Physics of Fluids · doi:10.1063/5.0209167 · Cited by 18
Wang, L., Cao, L., Shao, K., Su, J., Li, G., Wang, C., Li, Q., Sun, J., Zhang, H., Liu, K., et al. (2025) · Advanced Materials · doi:10.1002/adma.202410559 · Cited by 18
Metadata
- Authors
- Athanassiadis, A. G., Ma, Z., Moreno-Gomez, N., Melde, K., Choi, E., Goyal, R., & Fischer, P.
- Affiliations
- Max Planck Institute for Intelligent Systems (DE)
- Micro, Nano, and Molecular Systems Group, Max Planck Institute for Intelligent Systems, Heisenbergstrasse 3, 70569 Stuttgart, Germany
- University of Stuttgart (DE)
- Corresponding author
- Athanassiadis, Athanasios G.
- Fischer, Peer
- ORCID
- Venue
- Chemical Reviews
- Publisher
- American Chemical Society (ACS)
- Published
- 2021-11-12
- Volume
- 122
- Issue
- 5
- Pages
- 5165-5208
- ISSN
- 0009-2665 (ISSN-L)
- 1520-6890
- PMC
- PMC8915171
- OpenAlex
- W3214480262
- Cited by
- 293
- References
- 426
- Citations by year
- 2026: 80 · 2025: 72 · 2024: 65 · 2023: 56 · 2022: 20
- FWCI
- 2.16
- Type
- journal article
- Language
- en
- Open access
- hybrid
- doi.org
- Locations
- Chemical Reviews (publishedVersion, cc-by)
- PubMed Central (publishedVersion, cc-by)
- PubMed (publishedVersion)
- Funders
- Alexander von Humboldt-Stiftung
- H2020 European Research Council (788296)
- Topics
- Physical Sciences › Physics and Astronomy › Acoustics and Ultrasonics › Ultrasound and Cavitation Phenomena
- Physical Sciences › Physics and Astronomy › Acoustics and Ultrasonics › Acoustic Wave Phenomena Research
- Physical Sciences › Engineering › Mechanics of Materials › Ultrasonics and Acoustic Wave Propagation
- Keywords
- smart materials, acoustic energy conversion, cavitation, microstreaming, acoustic scattering, acoustic radiation force, ultrasonic sensing, ultrasound-mediated drug delivery
- MeSH terms
- Smart Materials
About these checks
Registry, retraction, Cites and statistics results are computed, not judged, with one exception: a printed reference that no index lists is read once by a model before it counts as a citation error. Claims are extracted by a model and kept only when their quote appears verbatim in the text; each cited source is then checked, with a model’s help, for whether it says what the claim relies on. Those verdicts can be wrong — read the claim’s quote and the cited source before relying on one.
Statistics and arithmetic are recomputed, not judged.
Confidence bands are shown only for fields calibrated on our annotated test set. None is calibrated yet, so no band is shown.
What counts as a claim ›How we measure confidence ›How we check this ›
Are you an author, or do you see a problem with this page? Request a review
