

The DOI matches its Crossref record; 120 of the 120 references it cites were found in a registry or an index.
Surrogate Based Genetic Algorithm Method for Efficient Identification of Low-Energy Peptide Structures
Open accessPublished version of a preprint
Abstract
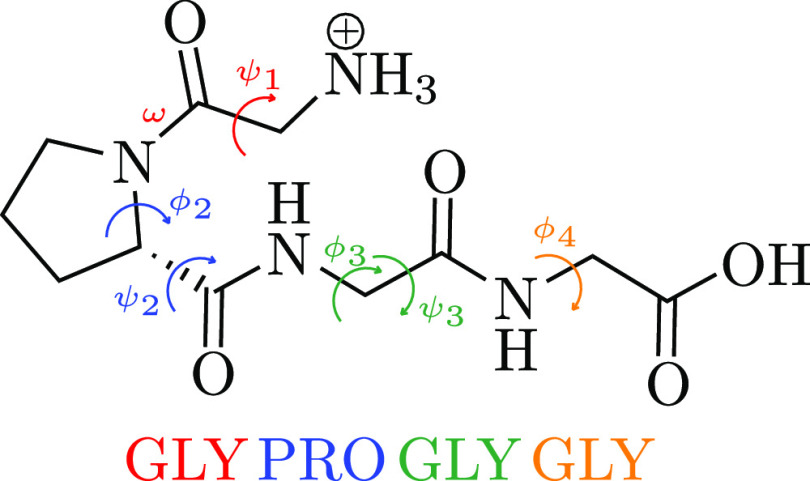
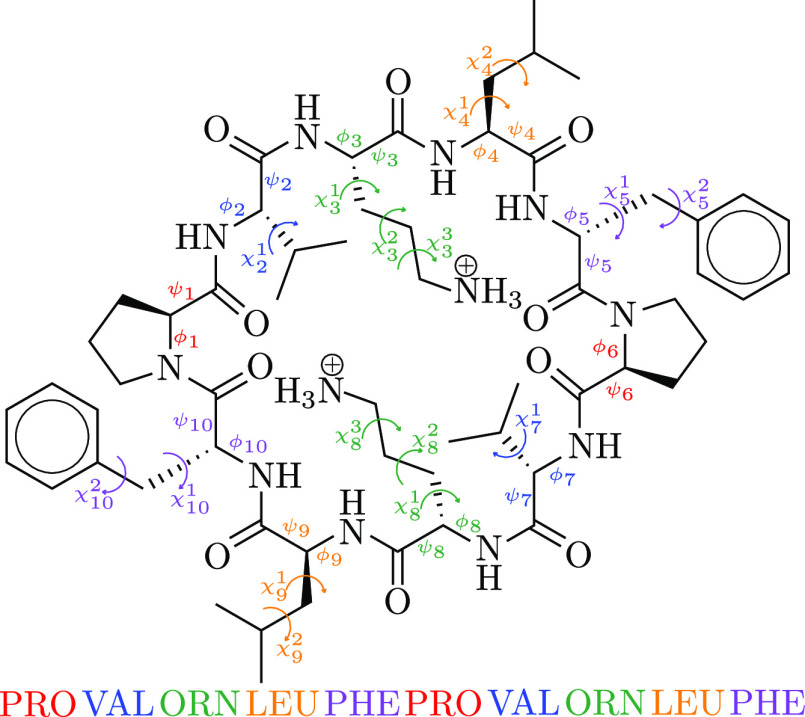
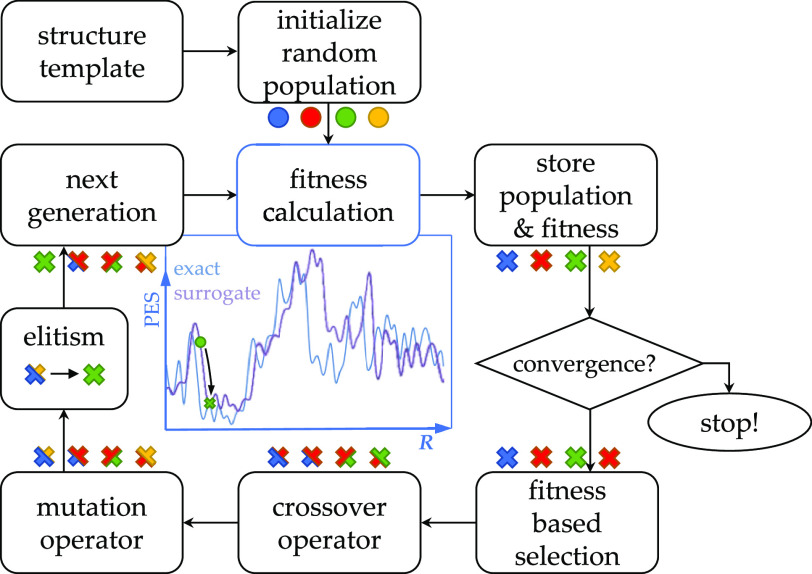
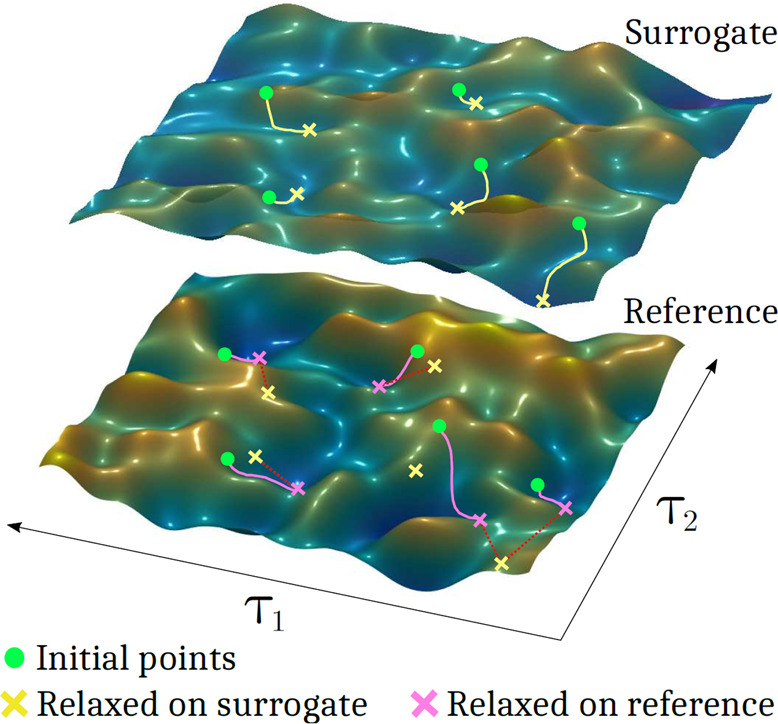
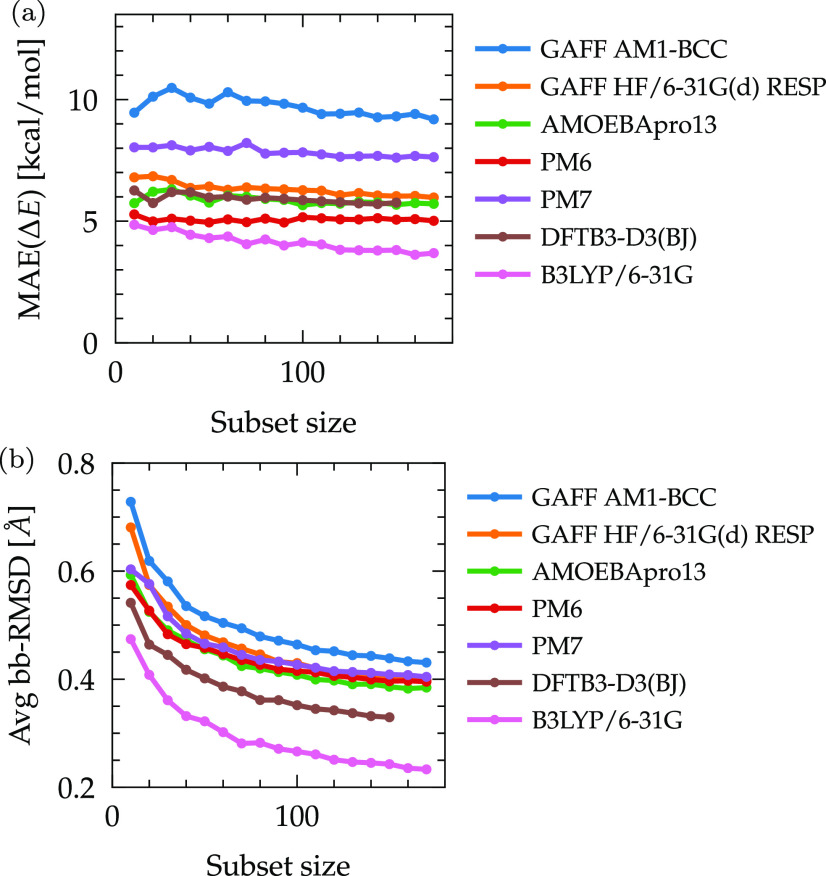
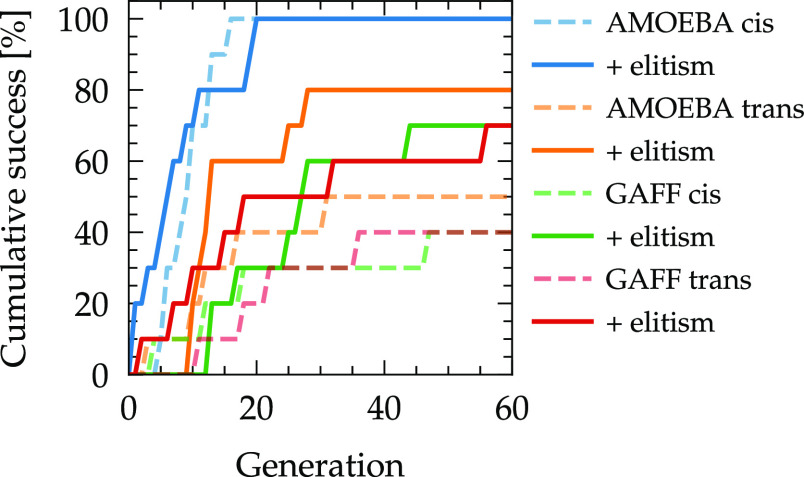
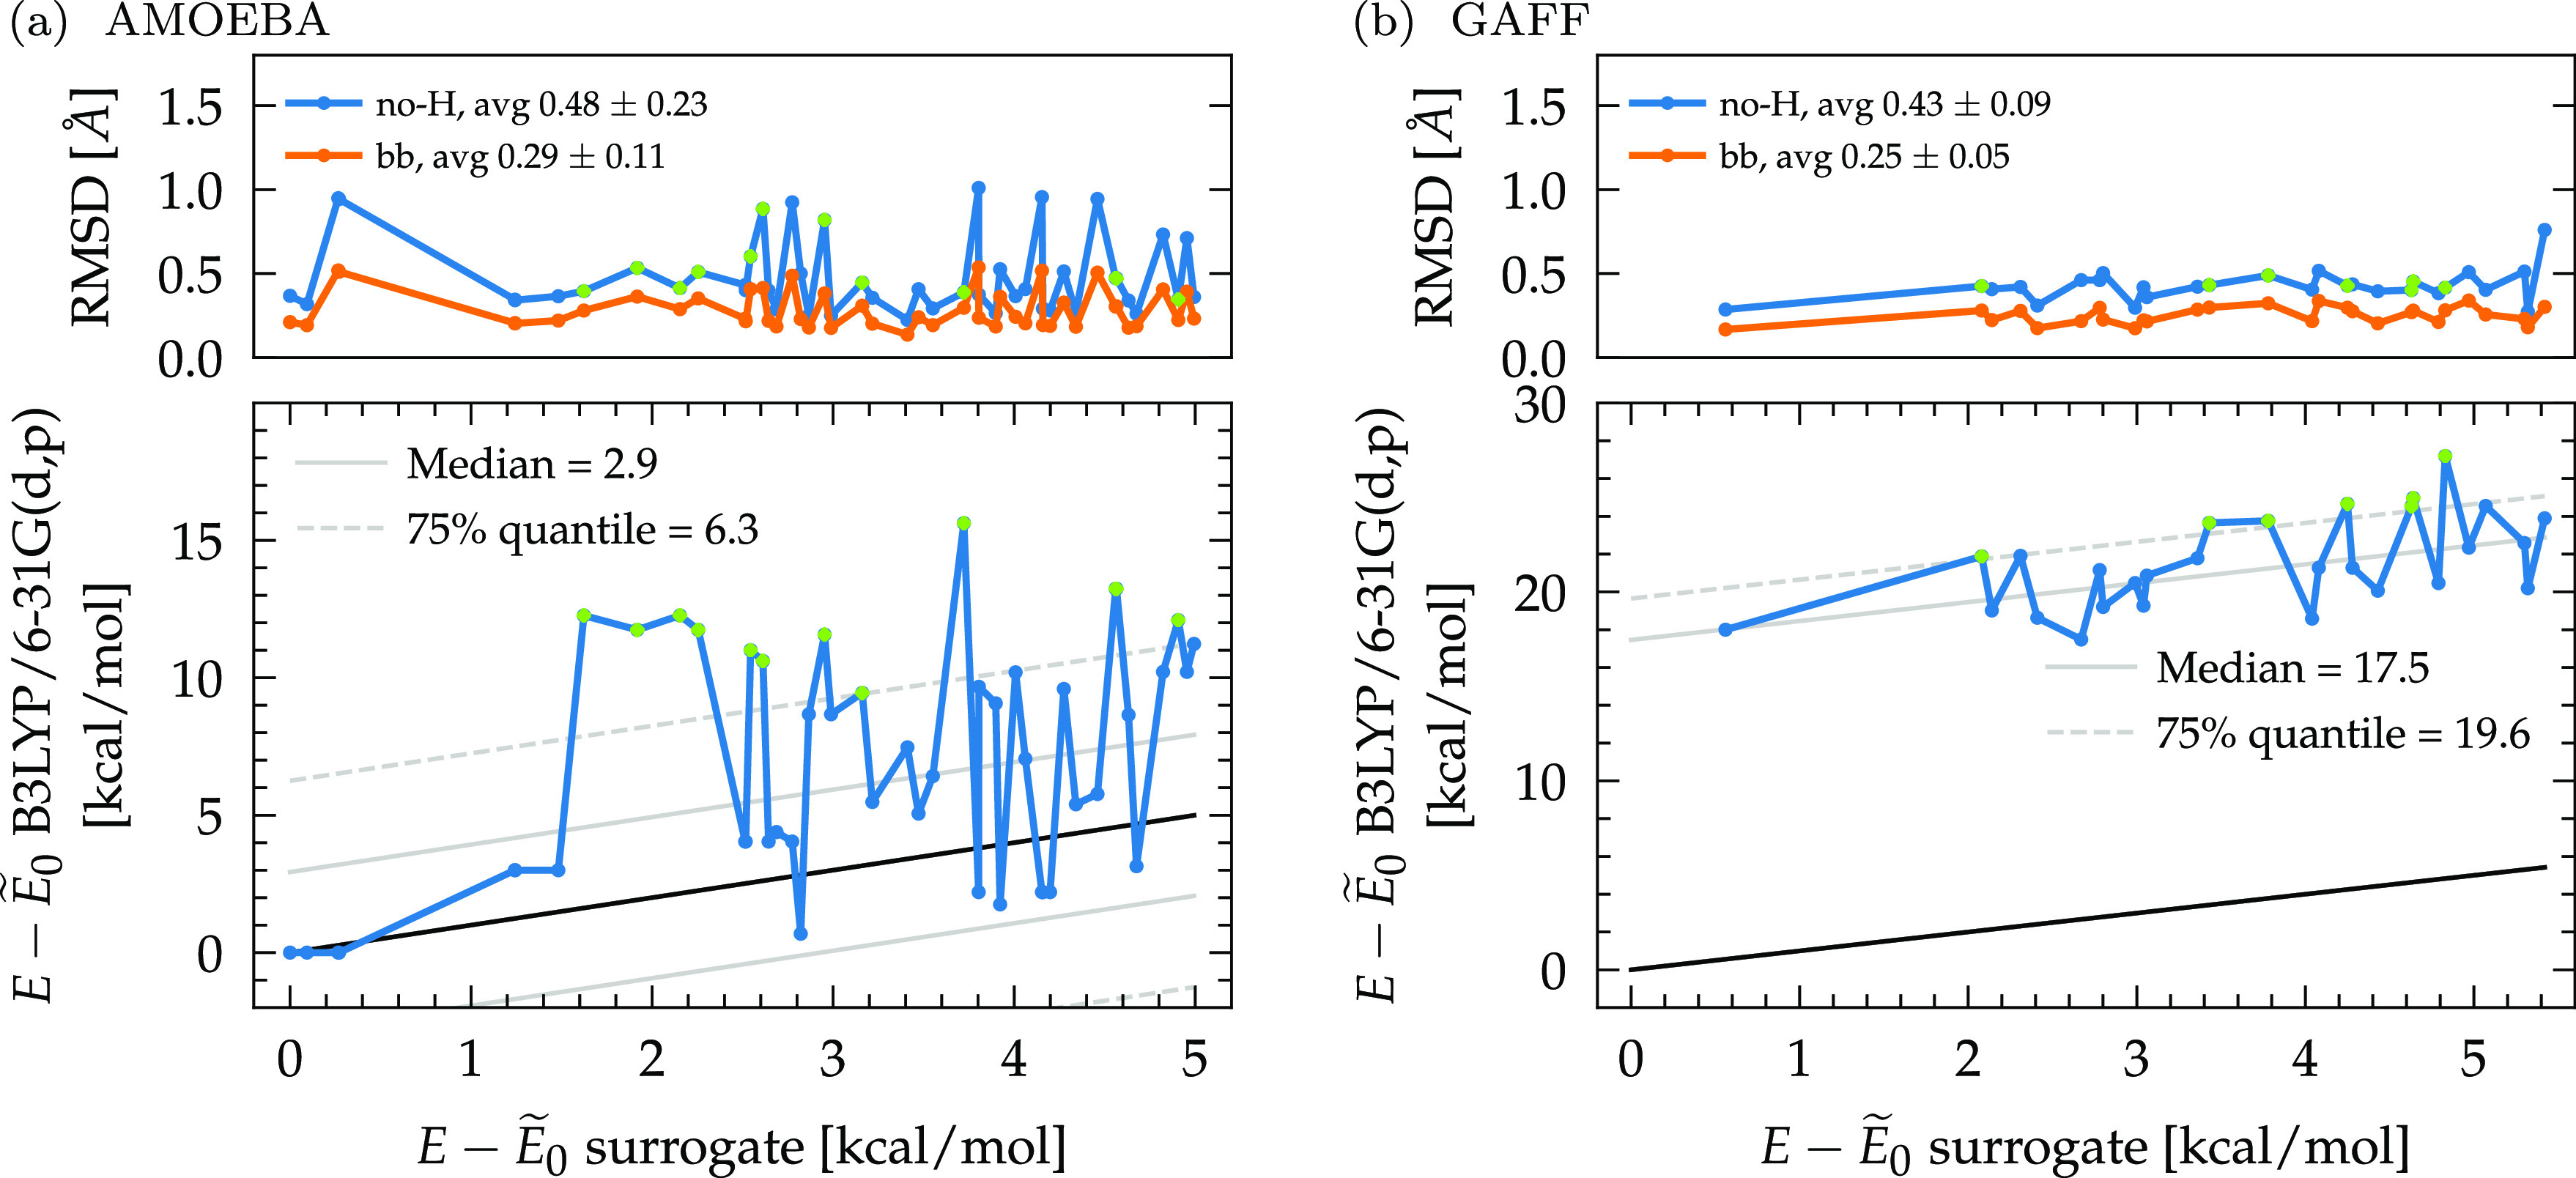
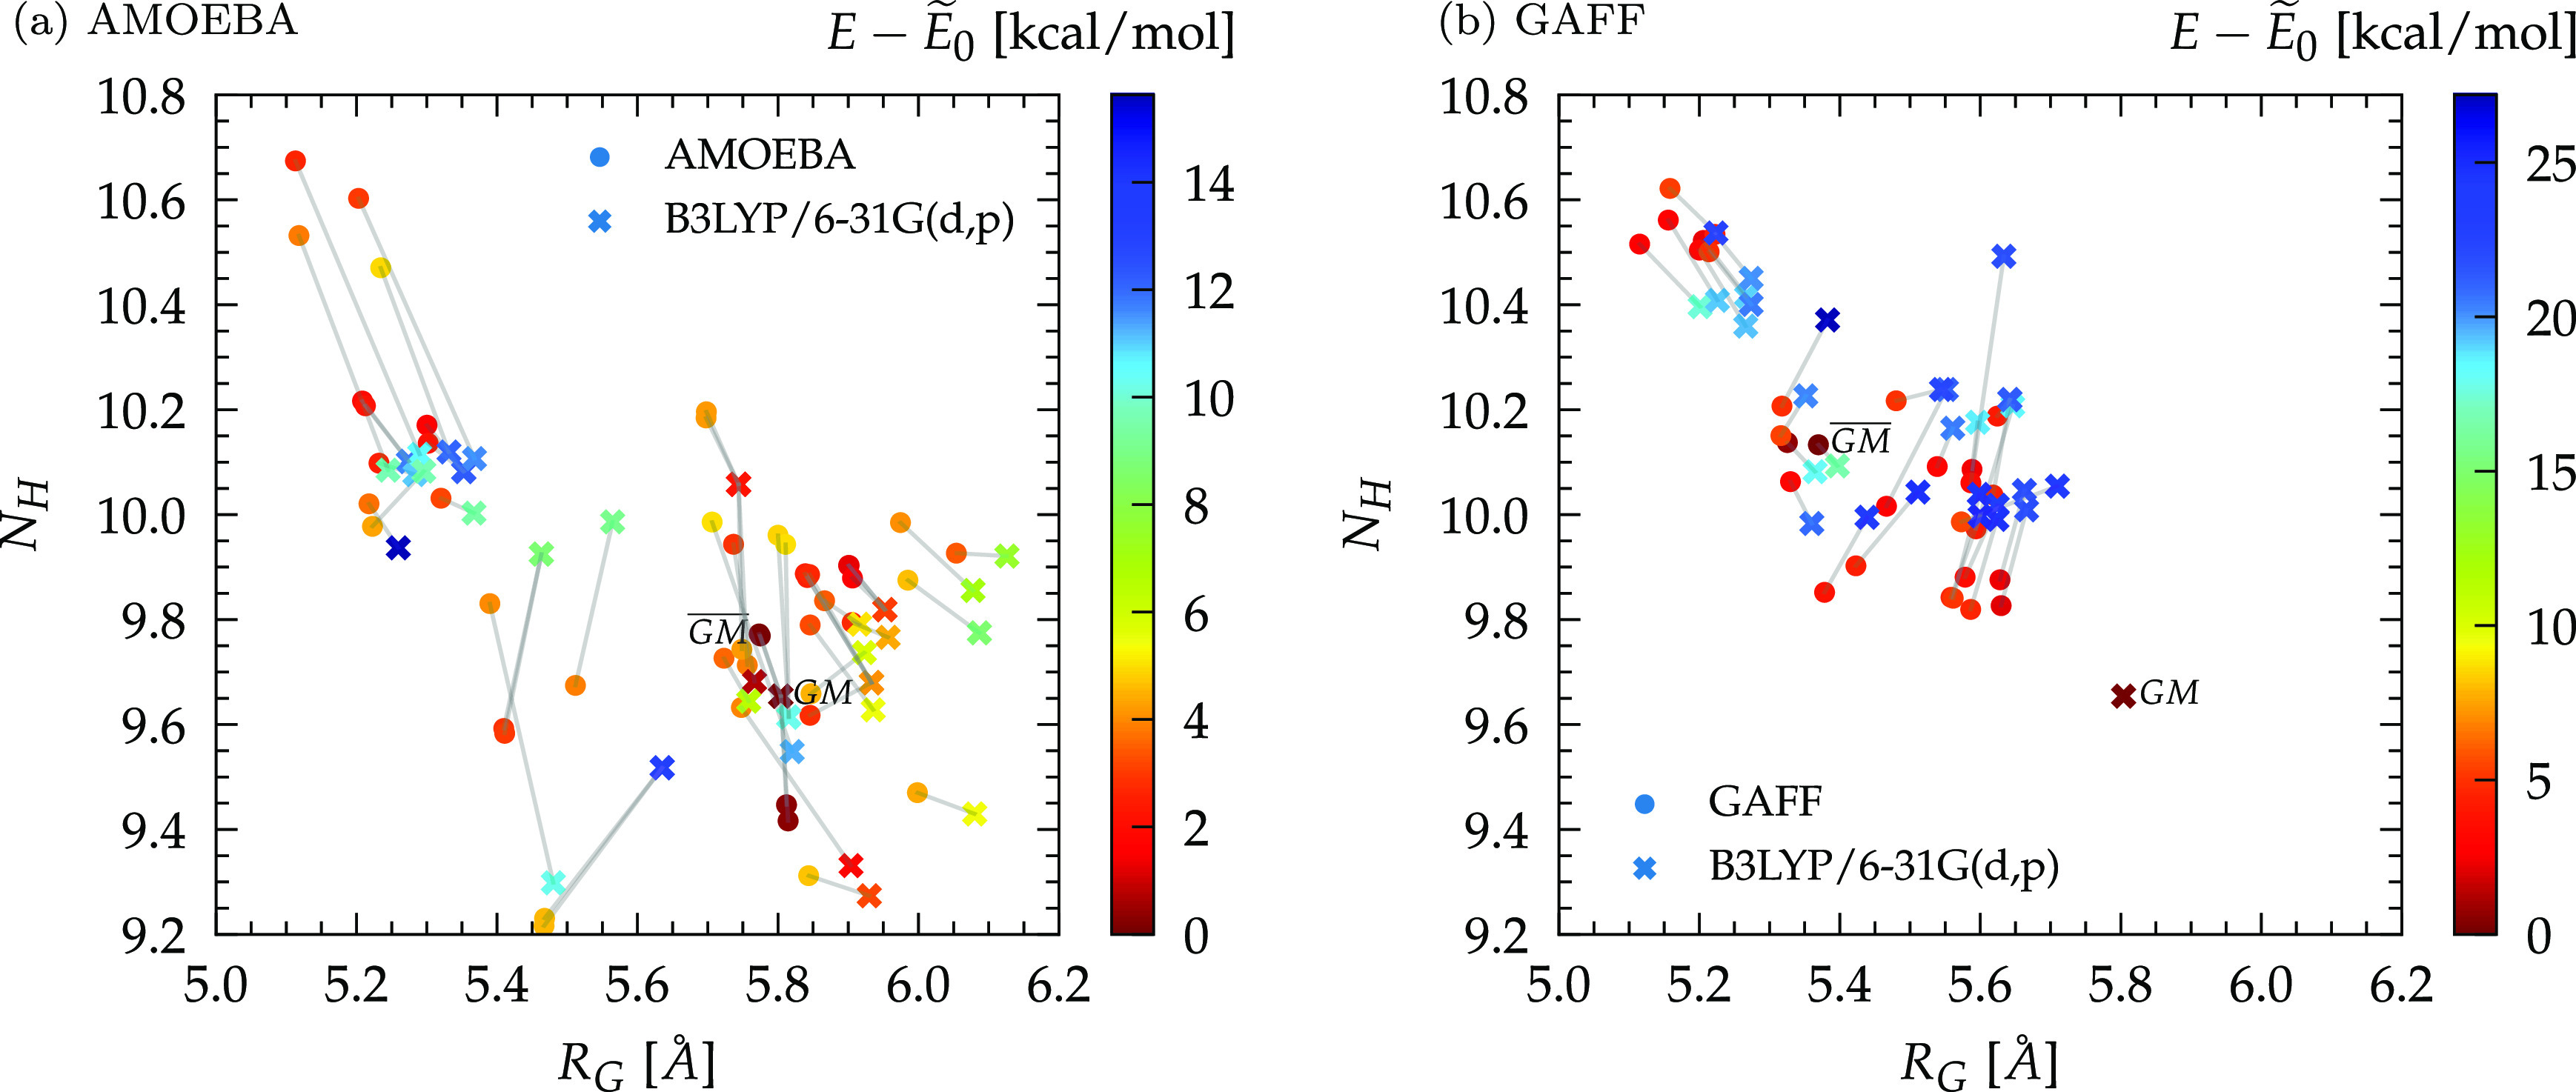
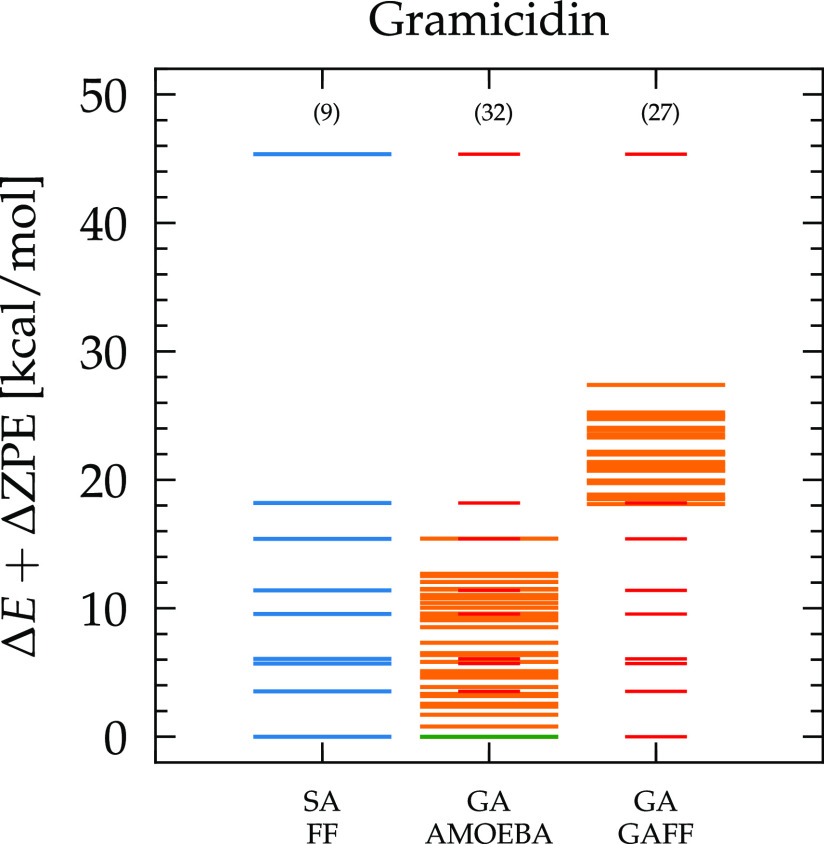
High Resolution Image Download MS PowerPoint Slide Identification of the most stable structure(s) of a system is a prerequisite for the calculation of any of its properties from first-principles. However, even for relatively small molecules, exhaustive explorations of the potential energy surface (PES) are severely hampered by the dimensionality bottleneck. In this work, we address the challenging task of efficiently sampling realistic low-lying peptide coordinates by resorting to a surrogate based genetic algorithm (GA)/density functional theory (DFT) approach (sGADFT) in which promising candidates provided by the GA are ultimately optimized with DFT. We provide a benchmark of several computational methods (GAFF, AMOEBApro13, PM6, PM7, DFTB3-D3(BJ)) as possible prescanning surrogates and apply sGADFT to two test case systems that are (i) two isomer families of the protonated Gly-Pro-Gly-Gly tetrapeptide ( Masson, A.; J. Am. Soc. Mass Spectrom. 2015, 26, 1444−1454) and (ii) the doubly protonated cyclic decapeptide gramicidin S ( Nagornova, N. S.; J. Am. Chem. Soc. 2010, 132, 4040−4041). We show that our GA procedure can correctly identify low-energy minima in as little as a few hours. Subsequent refinement of surrogate low-energy structures within a given energy threshold (≤10 kcal/mol (i), ≤5 kcal/mol (ii)) via DFT relaxation invariably led to the identification of the most stable structures as determined from high-resolution infrared (IR) spectroscopy at low temperature. The sGADFT method therefore constitutes a highly efficient route for the screening of realistic low-lying peptide structures in the gas phase as needed for instance for the interpretation and assignment of experimental IR spectra.
Overview
The claims and statistics of this paper haven’t been checked yet.
Run the check — free, no account needed. It reads the open-access text and checks the sources it cites.
Integrity signals
Registry
Cites
Statistics
Figures
Verification
Claims the paper makes
The claims and statistics of this paper haven’t been checked yet.
Run the check — free, no account needed. It reads the open-access text and checks the sources it cites.
Self-check
Percentages, sums and reported differences re-computed from the paper’s own numbers.
The self-check needs the paper’s full text.
Citations
Cites
Grimme, S., Antony, J., Ehrlich, S., & Krieg, H. (2010) · The Journal of Chemical Physics · doi:10.1063/1.3382344 · Cited by 59,686
Holland, J. H. (1992) · The MIT Press eBooks · doi:10.7551/mitpress/1090.001.0001 · Cited by 47,002
Highly accurate protein structure prediction with AlphaFold
Jumper, J., Evans, R., Pritzel, A., Green, T., Figurnov, M., Ronneberger, O., Tunyasuvunakool, K., Bates, R., Žídek, A., Potapenko, A., et al. (2021) · Nature · doi:10.1038/s41586-021-03819-2 · Cited by 43,764
Berman, H. M. (2000) · Nucleic Acids Research · doi:10.1093/nar/28.1.235 · Cited by 40,196
Effect of the damping function in dispersion corrected density functional theory
Grimme, S., Ehrlich, S., & Goerigk, L. (2011) · Journal of Computational Chemistry · doi:10.1002/jcc.21759 · Cited by 28,221
Stephens, P. J., Devlin, F. J., Chabalowski, C. F., & Frisch, M. J. (1994) · The Journal of Physical Chemistry · doi:10.1021/j100096a001 · Cited by 23,248
Development and testing of a general amber force field
Wang, J., Wolf, R. M., Caldwell, J. W., Kollman, P. A., & Case, D. A. (2004) · Journal of Computational Chemistry · doi:10.1002/jcc.20035 · Cited by 19,506
The Proceedings of the National Academy of Sciences
Richards, J. W. (1915) · Science · doi:10.1126/science.42.1074.161 · Cited by 13,983
An Introduction to Genetic Algorithms
Mitchell, M. (1996) · doi:10.7551/mitpress/3927.001.0001 · Cited by 11,340
Open Babel: An open chemical toolbox
O'Boyle, N. M., Banck, M., James, C. A., Morley, C., Vandermeersch, T., & Hutchison, G. R. (2011) · Journal of Cheminformatics · doi:10.1186/1758-2946-3-33 · Cited by 10,939
International Journal of Molecular Sciences
(2024) · International Journal of Molecular Sciences · doi:10.3390/ijms · Cited by 10,111
Antimicrobial peptides of multicellular organisms
Zasloff, M. (2002) · Nature · doi:10.1038/415389a · Cited by 8,457
Bayly, C. I., Cieplak, P., Cornell, W. D., & Kollman, P. A. (1993) · The Journal of Physical Chemistry · doi:10.1021/j100142a004 · Cited by 8,152
Comparison of multiple Amber force fields and development of improved protein backbone parameters
Horn̆ák, V., Abel, R., Okur, A., Strockbine, B., Roitberg, A. E., & Simmerling, C. L. (2006) · Proteins Structure Function and Bioinformatics · doi:10.1002/prot.21123 · Cited by 7,028
Antimicrobial peptides: pore formers or metabolic inhibitors in bacteria?
Brogden, K. A. (2005) · Nature Reviews Microbiology · doi:10.1038/nrmicro1098 · Cited by 5,829
Angewandte Chemie International Edition
Vazdar, K., Kunetskiy, R. A., Saame, J., Kaupmees, K., Leito, I., & Jahn, U. (2006) · Angewandte Chemie International Edition · doi:10.1002/(issn)1521-3773 · Cited by 5,242
The atomic simulation environment—a Python library for working with atoms
Hjorth Larsen, A., Jørgen Mortensen, J., Blomqvist, J., Castelli, I. E., Christensen, R., Dułak, M., Friis, J., Groves, M. N., Hammer, B., Hargus, C., et al. (2017) · Journal of Physics: Condensed Matter · doi:10.1088/1361-648x/aa680e · Cited by 4,464
Antimicrobial and host-defense peptides as new anti-infective therapeutic strategies
Hancock, R. E. W., & Sahl, H. (2006) · Nature Biotechnology · doi:10.1038/nbt1267 · Cited by 4,314
Elstner, M., Porezag, D. V., Jungnickel, G., Elsner, J., Haugk, M., Frauenheim, T., Suhai, S., & Seifert, G. (1998) · Physical review. B, Condensed matter · doi:10.1103/physrevb.58.7260 · Cited by 4,151
Stereochemistry of polypeptide chain configurations
Ramachandran, G. N., Ramakrishnan, C., & Sasisekharan, V. (1963) · Journal of Molecular Biology · doi:10.1016/s0022-2836(63)80023-6 · Cited by 3,678
Stewart, J. J. P. (2007) · Journal of Molecular Modeling · doi:10.1007/s00894-007-0233-4 · Cited by 3,652
Jakalian, A., Jack, D. B., & Bayly, C. I. (2002) · Journal of Computational Chemistry · doi:10.1002/jcc.10128 · Cited by 3,426
Fabrication of novel biomaterials through molecular self-assembly
Zhang, S. (2003) · Nature Biotechnology · doi:10.1038/nbt874 · Cited by 3,347
Peptide therapeutics: current status and future directions
Fosgerau, K., & Hoffmann, T. (2014) · Drug Discovery Today · doi:10.1016/j.drudis.2014.10.003 · Cited by 3,185
Evolution strategies – A comprehensive introduction
Beyer, H.-G., & Schwefel, H. (2002) · Natural Computing · doi:10.1023/a:1015059928466 · Cited by 2,810
OpenMM 7: Rapid development of high performance algorithms for molecular dynamics
Eastman, P., Swails, J., Chodera, J. D., McGibbon, R. T., Zhao, Y., Beauchamp, K. A., Wang, L.-P., Simmonett, A. C., Harrigan, M. P., Stern, C. D., et al. (2017) · PLOS Computational Biology · doi:10.1371/journal.pcbi.1005659 · Cited by 2,748
Nature Reviews Molecular Cell Biology
(2019) · Nature Reviews Molecular Cell Biology · doi:10.1038/41580.1471-0080 · Cited by 2,564
Physical Chemistry Chemical Physics
(2026) · Physical Chemistry Chemical Physics · doi:10.1039/1463-9084/1999 · Cited by 2,170
Peptide Folding: When Simulation Meets Experiment
Daura, X., Gademann, K., Jaun, B., Seebàch, D., van Gunsteren, W. F., & Mark, A. E. (1999) · Angewandte Chemie International Edition · doi:10.1002/(sici)1521-3773(19990115)38:1/2<236::aid-anie236>3.0.co;2-m · Cited by 2,093
Stewart, J. J. P. (2012) · Journal of Molecular Modeling · doi:10.1007/s00894-012-1667-x · Cited by 2,054
Fast, efficient generation of high-quality atomic charges. AM1-BCC model: I. Method
Jakalian, A., Bush, B. L., Jack, D. B., & Bayly, C. I. (2000) · Journal of Computational Chemistry · doi:10.1002/(sici)1096-987x(20000130)21:2<132::aid-jcc5>3.0.co;2-p · Cited by 1,678
Unke, O. T., Chmiela, S., Sauceda, H. E., Gastegger, M., Poltavsky, I., Schütt, K. T., Tkatchenko, A., & Müller, K.-R. (2021) · Chemical Reviews · doi:10.1021/acs.chemrev.0c01111 · Cited by 1,647
JOURNAL OF CHEMICAL INFORMATION AND MODELING
(2005) · Chemical & Engineering News · doi:10.1021/cen-v083n019.p031 · Cited by 1,534
Journal of Chemical Theory and Computation
(2008) · Journal of Chemical Theory and Computation · doi:10.1021/issn.1549-9618 · Cited by 1,193
Hourahine, B., Aradi, B., Blum, V., Bonafé, F., Buccheri, A., Camacho, C., Cevallos, C., Deshaye, M. Y., Dumitrică, T., Dominguez, A., et al. (2020) · The Journal of Chemical Physics · doi:10.1063/1.5143190 · Cited by 1,180
HH-suite3 for fast remote homology detection and deep protein annotation
Steinegger, M., Meier, M., Mirdita, M., Vöhringer, H., Haunsberger, S. J., & Söding, J. (2019) · BMC Bioinformatics · doi:10.1186/s12859-019-3019-7 · Cited by 1,145
Molecular Geometry Optimization with a Genetic Algorithm
Deaven, D. M., & Ho, K. M. (1995) · Physical Review Letters · doi:10.1103/physrevlett.75.288 · Cited by 1,136
DFTB3: Extension of the Self-Consistent-Charge Density-Functional Tight-Binding Method (SCC-DFTB)
Gaus, M., Cui, Q., & Elstner, M. (2011) · Journal of Chemical Theory and Computation · doi:10.1021/ct100684s · Cited by 1,118
Parametrization and Benchmark of DFTB3 for Organic Molecules
Gaus, M., Goez, A., & Elstner, M. (2013) · Journal of Chemical Theory and Computation · doi:10.1021/ct300849w · Cited by 1,015
Proteins: Structure, Function, and Bioinformatics
(2006) · Proteins Structure Function and Bioinformatics · doi:10.1002/(issn)1097-0134 · Cited by 943
Current opinion in structural biology
(1992) · Current Opinion in Structural Biology · doi:10.1016/0959-440x(92)90120-v · Cited by 933
Ufimtsev, I. S., & Martinez, T. J. (2009) · Journal of Chemical Theory and Computation · doi:10.1021/ct9003004 · Cited by 916
IEEE Transactions on Evolutionary Computation
(2009) · IEEE Computational Intelligence Magazine · doi:10.1109/mci.2009.5190921 · Cited by 797
Polarizable Atomic Multipole-Based AMOEBA Force Field for Proteins
Shi, Y., Xia, Z., Zhang, J., Best, R. B., Wu, C., Ponder, J. W., & Ren, P. Y. (2013) · Journal of Chemical Theory and Computation · doi:10.1021/ct4003702 · Cited by 719
Simultaneous determination of protein structure and dynamics
Lindorff‐Larsen, K., Best, R. B., DePristo, M. A., Dobson, C. M., & Vendruscolo, M. (2005) · Nature Cell Biology · doi:10.1038/nature03199 · Cited by 715
Venkatraman, J., Shankaramma, S. C., & Balaram, P. (2001) · Chemical Reviews · doi:10.1021/cr000053z · Cited by 701
A Comprehensive Review on Current Advances in Peptide Drug Development and Design
Lee, A. C.-L., Harris, J. L., Khanna, K. K., & Hong, J.-H. (2019) · International Journal of Molecular Sciences · doi:10.3390/ijms20102383 · Cited by 686
DL-FIND: An Open-Source Geometry Optimizer for Atomistic Simulations
Kästner, J., Carr, J. M., Keal, T. W., Thiel, W., Wander, A., & Sherwood, P. (2009) · The Journal of Physical Chemistry A · doi:10.1021/jp9028968 · Cited by 658
International Journal of Quantum Chemistry
(2006) · International Journal of Quantum Chemistry · doi:10.1002/(issn)1097-461x · Cited by 631
Predicting protein function from sequence and structure
Lee, D., Redfern, O., & Orengo, C. (2007) · Nature Reviews Molecular Cell Biology · doi:10.1038/nrm2281 · Cited by 583
Krämer, O. (2017) · Studies in computational intelligence · doi:10.1007/978-3-319-52156-5 · Cited by 555
Annual Review of Biomedical Engineering
(2017) · Annual Review of Biomedical Engineering · doi:10.1146/bioeng.685 · Cited by 553
Genetic Algorithms for Protein Folding Simulations
Unger, R., & Moult, J. (1993) · Journal of Molecular Biology · doi:10.1006/jmbi.1993.1258 · Cited by 522
Free-Energy Landscape for β Hairpin Folding from Combined Parallel Tempering and Metadynamics
Bussi, G., Gervasio, F. L., Laio, A., & Parrinello, M. (2006) · Journal of the American Chemical Society · doi:10.1021/ja062463w · Cited by 505
Li, X., & Frisch, M. J. (2006) · Journal of Chemical Theory and Computation · doi:10.1021/ct050275a · Cited by 483
Generating Conformer Ensembles Using a Multiobjective Genetic Algorithm
Vainio, M. J., & Johnson, M. S. (2007) · Journal of Chemical Information and Modeling · doi:10.1021/ci6005646 · Cited by 418
Generating Efficient Quantum Chemistry Codes for Novel Architectures
Titov, A. V., Ufimtsev, I. S., Luehr, N., & Martinez, T. J. (2013) · Journal of Chemical Theory and Computation · doi:10.1021/ct300321a · Cited by 402
Exploring chemical compound space with quantum-based machine learning
von Lilienfeld, O. A., Müller, K.-R., & Tkatchenko, A. (2020) · Nature Reviews Chemistry · doi:10.1038/s41570-020-0189-9 · Cited by 369
Wyttenbach, T., & Bowers, M. T. (2011) · The Journal of Physical Chemistry B · doi:10.1021/jp206867a · Cited by 346
Journal of The American Society for Mass Spectrometry
(2020) · Journal of the American Society for Mass Spectrometry · doi:10.1007/13361.1879-1123 · Cited by 344
Hoaglund‐Hyzer, C. S., Counterman, A. E., & Clemmer, D. E. (1999) · Chemical Reviews · doi:10.1021/cr980139g · Cited by 320
Elitism-based compact genetic algorithms
Ahn, C. W., & Ramakrishna, R. S. (2003) · IEEE Transactions on Evolutionary Computation · doi:10.1109/tevc.2003.814633 · Cited by 294
Peptidomimetic therapeutics: scientific approaches and opportunities
Qvit, N., Rubin, S. J. S., Urban, T. J., Mochly‐Rosen, D., & Gross, E. R. (2016) · Drug Discovery Today · doi:10.1016/j.drudis.2016.11.003 · Cited by 288
A Review on Bioactive Peptides: Physiological Functions, Bioavailability and Safety
Bhandari, D., Rafiq, S., Gat, Y., Gat, P., Waghmare, R., & Kumar, V. (2020) · International Journal of Peptide Research and Therapeutics · doi:10.1007/s10989-019-09823-5 · Cited by 284
Journal of Chemical Information and Computer Sciences
(2008) · Journal of Chemical Information and Computer Sciences · doi:10.1021/issn.0095-2338 · Cited by 261
sGDML: Constructing accurate and data efficient molecular force fields using machine learning
Chmiela, S., Sauceda, H. E., Poltavsky, I., Müller, K., & Tkatchenko, A. (2019) · Computer Physics Communications · doi:10.1016/j.cpc.2019.02.007 · Cited by 257
Peptide conformation and protein folding
Dyson, H. J., & Wright, P. E. (1993) · Current Opinion in Structural Biology · doi:10.1016/0959-440x(93)90203-w · Cited by 235
Brandenburg, J. G., & Grimme, S. (2014) · The Journal of Physical Chemistry Letters · doi:10.1021/jz500755u · Cited by 199
Acta Crystallographica Section D: Biological Crystallography
Baker, E. N., & Dauter, Z. (2008) · Acta Crystallographica Section A Foundations of Crystallography · doi:10.1107/s0108767308094609 · Cited by 195
Gas-Phase IR Spectroscopy and Structure of Biological Molecules
Rijs, A. M., & Oomens, J. (2015) · Topics in current chemistry · doi:10.1007/978-3-319-19204-8 · Cited by 191
Wang, Z., Zhang, W., Wu, C. F., Lei, H., Cieplak, P., & Duan, Y. (2006) · Journal of Computational Chemistry · doi:10.1002/jcc.20386 · Cited by 187
Molden 2.0: quantum chemistry meets proteins
Schaftenaar, G., Vlieg, E., & Vriend, G. (2017) · Journal of Computer-Aided Molecular Design · doi:10.1007/s10822-017-0042-5 · Cited by 160
Dor, O., & Zhou, Y. (2006) · Proteins Structure Function and Bioinformatics · doi:10.1002/prot.21298 · Cited by 146
Protein folding simulations with genetic algorithms and a detailed molecular description
Pedersen, J. T., & Moult, J. (1997) · Journal of Molecular Biology · doi:10.1006/jmbi.1997.1010 · Cited by 141
Genetic algorithms for protein structure prediction
Pedersen, J. T., & Moult, J. (1996) · Current Opinion in Structural Biology · doi:10.1016/s0959-440x(96)80079-0 · Cited by 120
First-Principles Molecular Structure Search with a Genetic Algorithm
Supady, A., Blüm, V., & Baldauf, C. (2015) · Journal of Chemical Information and Modeling · doi:10.1021/acs.jcim.5b00243 · Cited by 115
Analysis of the genetic algorithm method of molecular conformation determination
McGarrah, D. B., & Judson, R. (1993) · Journal of Computational Chemistry · doi:10.1002/jcc.540141115 · Cited by 113
Hünig, I., & Kleinermanns, K. (2004) · Physical Chemistry Chemical Physics · doi:10.1039/b316295h · Cited by 108
International Journal of Peptide Research and Therapeutics
(2013) · International Journal of Peptide Research and Therapeutics · doi:10.1007/10989.1573-3904 · Cited by 107
Folding Structures of Isolated Peptides as Revealed by Gas‐Phase Mid‐Infrared Spectroscopy
Bakker, J. M., Plützer, C., Hünig, I., Häber, T., Compagnon, I., von Helden, G., Meijer, G., & Kleinermanns, K. (2005) · ChemPhysChem · doi:10.1002/cphc.200400345 · Cited by 106
Conformational searching methods for small molecules. II. Genetic algorithm approach
Judson, R., Jaeger, E. P., Treasurywala, A. M., & Peterson, M. L. (1993) · Journal of Computational Chemistry · doi:10.1002/jcc.540141117 · Cited by 106
Proteins: Structure and Function
Lazar, T. A. (2006) · Microbe Magazine · doi:10.1128/microbe.1.442.2 · Cited by 92
Highly Resolved Spectra of Gas-Phase Gramicidin S: A Benchmark for Peptide Structure Calculations
Nagornova, N. S., Rizzo, T. R., & Boyarkin, O. V. (2010) · Journal of the American Chemical Society · doi:10.1021/ja910118j · Cited by 86
Genetic Optimization of Training Sets for Improved Machine Learning Models of Molecular Properties
Browning, N. J., Ramakrishnan, R., von Lilienfeld, O. A., & Röthlisberger, U. (2017) · The Journal of Physical Chemistry Letters · doi:10.1021/acs.jpclett.7b00038 · Cited by 83
The Structure of the Protonated Serine Octamer
Scutelnic, V., Perez, M. A. S., Marianski, M., Warnke, S., Gregor, A., Röthlisberger, U., Bowers, M. T., Baldauf, C., von Helden, G., Rizzo, T. R., et al. (2018) · Journal of the American Chemical Society · doi:10.1021/jacs.8b02118 · Cited by 83
Chin, W., Dognon, J., Piuzzi, F., Tardivel, B., Dimicoli, I., & Mons, M. (2004) · Journal of the American Chemical Society · doi:10.1021/ja045251c · Cited by 81
Gas-Phase Infrared Spectroscopy of Neutral Peptides: Insights from the Far-IR and THz Domain
Bakels, S., Gaigeot, M., & Rijs, A. M. (2020) · Chemical Reviews · doi:10.1021/acs.chemrev.9b00547 · Cited by 81
Infrared Spectroscopy of Mobility-Selected H + -Gly-Pro-Gly-Gly (GPGG)
Masson, A., Kamrath, M. Z., Perez, M. A. S., Glover, M. S., Röthlisberger, U., Clemmer, D. E., & Rizzo, T. R. (2015) · Journal of the American Society for Mass Spectrometry · doi:10.1007/s13361-015-1172-4 · Cited by 74
First-Principles Molecular Structure Search with a Genetic Algorithm
Supady, A., Blum, V., & Baldauf, C. (2015) · Max Planck Digital Library · Cited by 73
Prediction of peptide structure: How far are we?
Thomas, A., Deshayes, S., Decaffmeyer, M., Eyck, M. H. V., Charloteaux, B., & Brasseur, R. (2006) · Proteins Structure Function and Bioinformatics · doi:10.1002/prot.21151 · Cited by 72
The Genetic Algorithm Approach to Protein Structure Prediction
Unger, R. (2004) · Structure and bonding · doi:10.1007/b13936 · Cited by 72
Elitism and Distance Strategy for Selection of Evolutionary Algorithms
Du, H., Wang, Z., Zhan, W., & Guo, J. (2018) · IEEE Access · doi:10.1109/access.2018.2861760 · Cited by 71
Cold‐Ion Spectroscopy Reveals the Intrinsic Structure of a Decapeptide
Nagornova, N. S., Guglielmi, M., Doemer, M., Tavernelli, I., Röthlisberger, U., Rizzo, T. R., & Boyarkin, O. V. (2011) · Angewandte Chemie International Edition · doi:10.1002/anie.201100702 · Cited by 68
Neutral Peptides in the Gas Phase: Conformation and Aggregation Issues
Gloaguen, E., Mons, M., Schwing, K., & Gerhards, M. (2020) · Chemical Reviews · doi:10.1021/acs.chemrev.0c00168 · Cited by 63
Ab initio structure prediction for small polypeptides and protein fragments using genetic algorithms
Pedersen, J. T., & Moult, J. (1995) · Proteins Structure Function and Bioinformatics · doi:10.1002/prot.340230319 · Cited by 61
The application of the genetic algorithm to the minimization of potential energy functions
Grand, S. M. L., & Merz, K. M. (1993) · Journal of Global Optimization · doi:10.1007/bf01100239 · Cited by 59
Genetic Algorithms in Conformational Analysis
Nair, N. U., & Goodman, J. M. (1998) · Journal of Chemical Information and Computer Sciences · doi:10.1021/ci970433u · Cited by 59
Llamas-Saiz, A. L., Grotenbreg, G. M., Overhand, M., & van Raaij, M. J. (2007) · Acta Crystallographica Section D Biological Crystallography · doi:10.1107/s0907444906056435 · Cited by 55
Design of Catalytic Peptides and Proteins Through Rational and Combinatorial Approaches
Maeda, Y., Makhlynets, O. V., Matsui, H., & Korendovych, I. V. (2016) · Annual Review of Biomedical Engineering · doi:10.1146/annurev-bioeng-111215-024421 · Cited by 52
Schubert, F., Rossi, M., Baldauf, C., Pagel, K., Warnke, S., von Helden, G., Filsinger, F., Kupser, P., Meijer, G., Salwiczek, M., et al. (2015) · Physical Chemistry Chemical Physics · doi:10.1039/c4cp05541a · Cited by 51
Improving sample and feature selection with principal covariates regression
Cersonsky, R. K., Helfrecht, B. A., Engel, E. A., Kliavinek, S., & Ceriotti, M. (2021) · Machine Learning Science and Technology · doi:10.1088/2632-2153/abfe7c · Cited by 46
Validation Challenge of Density-Functional Theory for Peptides—Example of Ac-Phe-Ala 5 -LysH +
Rossi, M., Chutia, S., Scheffler, M., & Blüm, V. (2014) · The Journal of Physical Chemistry A · doi:10.1021/jp412055r · Cited by 43
Hao, G., Xu, W., Yang, S., & Yang, G. (2015) · Scientific Reports · doi:10.1038/srep15568 · Cited by 39
Mid- and Near-Infrared Spectra of Conformers of H-Pro-Trp-OH
Häber, T., Seefeld, K. A., & Kleinermanns, K. (2007) · The Journal of Physical Chemistry A · doi:10.1021/jp070571e · Cited by 35
Genetic Algorithms and Protein Folding
Schulze-Kremer, S. (2003) · Humana Press eBooks · doi:10.1385/1-59259-368-2:175 · Cited by 34
Jaeqx, S., Du, W., Meijer, E. J., Oomens, J., & Rijs, A. M. (2012) · The Journal of Physical Chemistry A · doi:10.1021/jp3053339 · Cited by 32
Loquais, Y., Gloaguen, E., Habka, S., Vaquero-Vara, V., Brenner, V., Tardivel, B., & Mons, M. (2014) · The Journal of Physical Chemistry A · doi:10.1021/jp509494c · Cited by 32
Optimization of a genetic algorithm for searching molecular conformer space
Brain, Z. E., & Addicoat, M. A. (2011) · The Journal of Chemical Physics · doi:10.1063/1.3656323 · Cited by 30
Energy minimization of peptide analogues using genetic algorithms
Herrmann, F., & Suhai, S. (1995) · Journal of Computational Chemistry · doi:10.1002/jcc.540161112 · Cited by 29
How Reliable Are Modern Density Functional Approximations to Simulate Vibrational Spectroscopies?
Sitkiewicz, S. P., Zaleśny, R., Ramos‐Cordoba, E., Luis, J. M., & Matito, E. (2022) · The Journal of Physical Chemistry Letters · doi:10.1021/acs.jpclett.2c01278 · Cited by 29
Pedersen, J. T., & Moult, J. (1997) · Proteins Structure Function and Bioinformatics · Cited by 27
Damsbo, M., Kinnear, B. S., Hartings, M. R., Ruhoff, P. T., Jarrold, M. F., & Ratner, M. A. (2004) · Proceedings of the National Academy of Sciences · doi:10.1073/pnas.0401659101 · Cited by 26
Bozkurt, E., Perez, M. A. S., Hovius, R., Browning, N. J., & Röthlisberger, U. (2018) · Journal of the American Chemical Society · doi:10.1021/jacs.7b10660 · Cited by 21
Mancini, G., Fusè, M., Lazzari, F., & Barone, V. (2022) · Digital Discovery · doi:10.1039/d2dd00070a · Cited by 21
The Genetic Algorithm and the Conformational Search of Polypeptides and Proteins
Grand, S. M. L., & Merz, K. M. (1994) · Molecular Simulation · doi:10.1080/08927029408021995 · Cited by 20
Doemer, M., Guglielmi, M., Athri, P., Nagornova, N. S., Rizzo, T. R., Boyarkin, O. V., Tavernelli, I., & Röthlisberger, U. (2012) · International Journal of Quantum Chemistry · doi:10.1002/qua.24085 · Cited by 14
On Potential Energy Models for EA-based Ab Initio Protein Structure Prediction
Mijajlovic, M., Biggs, M. J., & Djurdjevic, D. P. (2010) · Evolutionary Computation · doi:10.1162/evco.2010.18.2.18204 · Cited by 8
Aseev, O. S., Perez, M. A. S., Röthlisberger, U., & Rizzo, T. R. (2015) · The Journal of Physical Chemistry Letters · doi:10.1021/acs.jpclett.5b01088 · Cited by 5
Genetic‐Algorithm‐Based Optimization of a Peptidic Scaffold for Sequestration and Hydration of CO2
Brunk, E., Perez, M. A. S., Athri, P., & Röthlisberger, U. (2016) · ChemPhysChem · doi:10.1002/cphc.201601034 · Cited by 4
Applications of Artificial Intelligence to Computational Chemistry
Browning, N. J. (2019) · Infoscience (Ecole Polytechnique Fédérale de Lausanne) · doi:10.5075/epfl-thesis-9645 · Cited by 4
Research works printed but not linked: 2
- 10.1002/(SICI)1097-0134(1997)1+<179::AID-PROT23>3.0.CO;2-K · DOI
- Deb K., 1995, Complex Syst., 9, 115
Metadata
- Authors
- Villard, J., Kılıç, M., & Rothlisberger, U.
- Affiliations
- École Polytechnique Fédérale de Lausanne (CH)
- Laboratory of Computational Chemistry and Biochemistry, Institute of Chemical Sciences and Engineering, École Polytechnique Fédérale de Lausanne (EPFL), CH-1015Lausanne, Switzerland
- Venue
- Journal of Chemical Theory and Computation
- Publisher
- American Chemical Society (ACS)
- Published
- 2023-01-24
- Volume
- 19
- Issue
- 3
- Pages
- 1080-1097
- ISSN
- 1549-9618 (ISSN-L)
- 1549-9626
- PMC
- PMC9933449
- OpenAlex
- W4317867555
- Cited by
- 19
- References
- 120
- Citations by year
- 2026: 12 · 2025: 2 · 2024: 3 · 2023: 2
- FWCI
- 2.21
- Type
- journal article
- Language
- en
- Open access
- hybrid
- doi.org
- Licence
- Locations
- Journal of Chemical Theory and Computation (publishedVersion, cc-by-nc-nd)
- ChemRxiv (acceptedVersion, cc-by)
- PubMed Central (publishedVersion, cc-by-nc-nd)
- PubMed (publishedVersion)
- Infoscience (Ecole Polytechnique Fédérale de Lausanne) (submittedVersion, cc-by-nc-nd)
- Funders
- Schweizerischer Nationalfonds zur Förderung der Wissenschaftlichen Forschung (200020_185092)
- Topics
- Physical Sciences › Physics and Astronomy › Atomic and Molecular Physics, and Optics › Advanced Chemical Physics Studies
- Physical Sciences › Chemistry › Spectroscopy › Mass Spectrometry Techniques and Applications
- Life Sciences › Biochemistry, Genetics and Molecular Biology › Molecular Biology › Protein Structure and Dynamics
- Keywords
- density functional theory, gramicidin S, infrared spectroscopy, GAFF, amoebae, PM6, PM7
- MeSH terms
- Algorithms, Gramicidin, Peptides
About these checks
Registry, retraction, Cites and statistics results are computed, not judged, with one exception: a printed reference that no index lists is read once by a model before it counts as a citation error. Claims are extracted by a model and kept only when their quote appears verbatim in the text; each cited source is then checked, with a model’s help, for whether it says what the claim relies on. Those verdicts can be wrong — read the claim’s quote and the cited source before relying on one.
Statistics and arithmetic are recomputed, not judged.
Confidence bands are shown only for fields calibrated on our annotated test set. None is calibrated yet, so no band is shown.
What counts as a claim ›How we measure confidence ›How we check this ›
Are you an author, or do you see a problem with this page? Request a review
Data sources
Bibliographic data: Semantic Scholar, OpenAlex, Crossref.
Contains information from the Semantic Scholar Academic Graph Datasets, made available under the ODC Attribution License (ODC-BY 1.0).
Semantic Scholar’s data is described in: Kinney, R., et al. (2023). The Semantic Scholar Open Data Platform. arXiv:2301.10140.
