Cited by 174

The DOI matches its Crossref record; 4 of the 4 references it cites were found in a registry or an index.

Reprogramming Dysfunctional Dendritic Cells by a Versatile Catalytic Dual Oxide Antigen-Captured Nanosponge for Remotely Enhancing Lung Metastasis Immunotherapy

Chiang, Min-Ren, Hsu, Chin-Wei, Pan, Wan-Chi, Tran, Ngoc-Tri, Lee, Yu-Sheng, Chiang, Wen-Hsuan, Liu, Yu-Chen, Chen, Ya-Wen, Chiou, Shih-Hwa, Hu, Shang-Hsiu·2025·ACS Nano

Overview

The claims and statistics of this paper haven’t been checked yet.

Run the check — free, no account needed. It reads the open-access text and checks the sources it cites.

A few free checks a day · papers already verified open instantly · results are public

Integrity signals

Registry

Crossref · 10.1021/acsnano.4c09525

Cites

4 of 4 references verified0 citation errors · 0 not checkable

Statistics

Figures

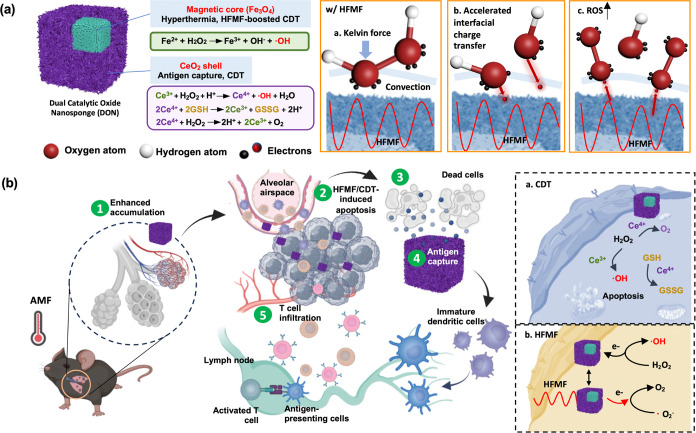
Figure 1 Schematic illustration of dual catalytic oxide nanosponge (DON) a dual catalyst and an inducer of T cell infiltration to program immune therapy. (a) DON consisting of cerium oxide nanozyme (CeO2), iron based-MOF, and iron oxide nanocubes (IO) as agents to promote the cycle between Fe3+/Fe2+ and Ce3+/Ce4+ as well as to decompose H2O2 upon a high-frequency magnetic fields (HFMF) irradiation. (b) The hyperthermia and chemodynamic therapy (CDT) via redox reactions promoted cancer cell apoptosis and release TAAs. Porous DON enhances the retention of antigen release, facilitating sustained immune stimulation and inhibiting tumor metastasis.
Figure 1 Schematic illustration of dual catalytic oxide nanosponge (DON) a dual catalyst and an inducer of T cell infiltration to program immune therapy. (a) DON consisting of cerium oxide nanozyme (CeO2), iron based-MOF, and iron oxide nanocubes (IO) as agents to promote the cycle between Fe3+/Fe2+ and Ce3+/Ce4+ as well as to decompose H2O2 upon a high-frequency magnetic fields (HFMF) irradiation. (b) The hyperthermia and chemodynamic therapy (CDT) via redox reactions promoted cancer cell apoptosis and release TAAs. Porous DON enhances the retention of antigen release, facilitating sustained immune stimulation and inhibiting tumor metastasis.CC BY · PubMed Central
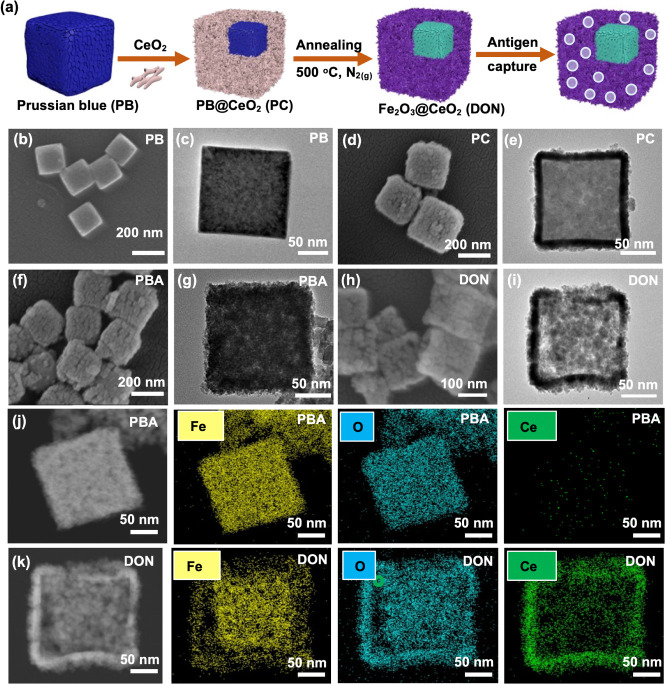
Figure 2 Synthesis and characterizations of PB, PC, and DON. (a) Schematic representation showing the synthesis of DON for HFMF-enhanced catalytic therapy. SEM and TEM images of (b,c) PB, (d,e) PC, (f,g) PBA, and (h,i) DON. (j,k) Element mapping analysis of PBA and DON.
Figure 2 Synthesis and characterizations of PB, PC, and DON. (a) Schematic representation showing the synthesis of DON for HFMF-enhanced catalytic therapy. SEM and TEM images of (b,c) PB, (d,e) PC, (f,g) PBA, and (h,i) DON. (j,k) Element mapping analysis of PBA and DON.CC BY · PubMed Central
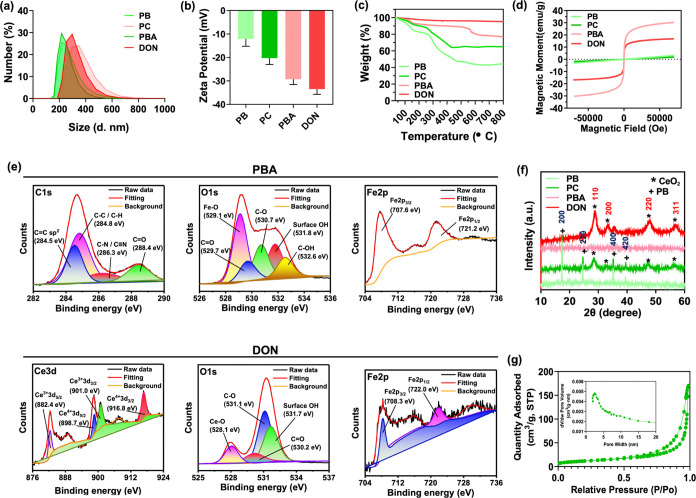
Figure 3 Physicochemical characterization of PB, PC, PBA, and DON. (a) Size distributions and (b) surface charges of PB, PC, PBA, and DON. (c) Thermogravimetric analysis curves and (d) field-dependent magnetization curves of PB, PC, PBA, and DON. (e) XPS spectrum of C 1s, O 1s, and Fe 2p of PBA and DON. (f) XRD spectrum of PB, PC, PBA, and DON. (g) BET analysis of N2 adsorption–desorption isotherms of DON.
Figure 3 Physicochemical characterization of PB, PC, PBA, and DON. (a) Size distributions and (b) surface charges of PB, PC, PBA, and DON. (c) Thermogravimetric analysis curves and (d) field-dependent magnetization curves of PB, PC, PBA, and DON. (e) XPS spectrum of C 1s, O 1s, and Fe 2p of PBA and DON. (f) XRD spectrum of PB, PC, PBA, and DON. (g) BET analysis of N2 adsorption–desorption isotherms of DON.CC BY · PubMed Central
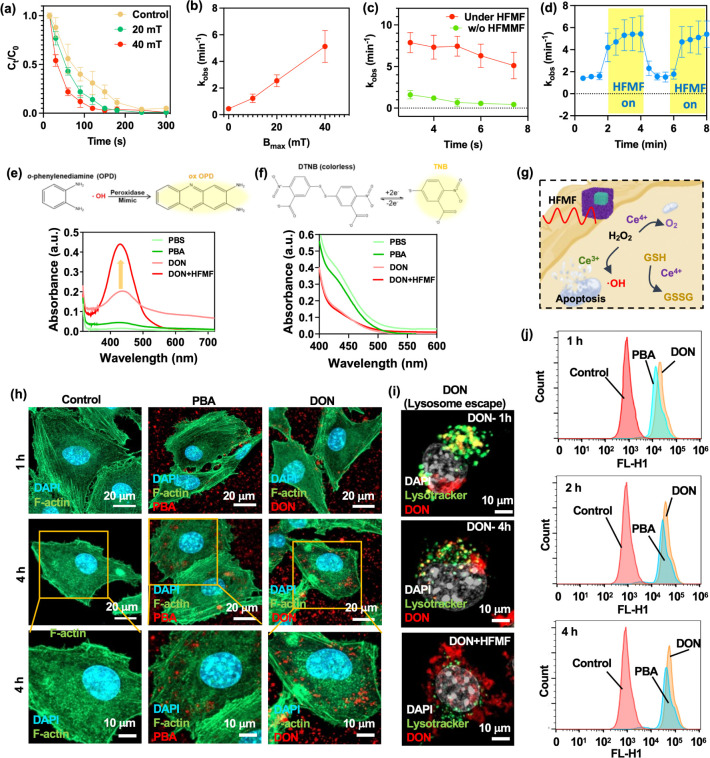
Figure 4 (a) Degradation patterns of rhodamine B (RhB) under an HFMF with the magnetic strengths of 0, 20, and 40 mT. RhB concentration: 10 mg/L; H2O2 concentration: 5 mM; pH: 7.4. Statistical significance was assessed using one-way ANOVA. Data represent mean ± SEM, n = 5. (b) Relationship between magnetic strength and reaction kinetic rate. Statistical significance was assessed using one-way ANOVA. Data represent mean ± SEM, n = 5. (c) Comparing the observed reaction kinetic rates (kobs) in the presence and absence of an HFMF across different pH values, while maintaining a constant dosage of 5 mL of H2O2. Statistical significance was assessed using one-way ANOVA. Data represent mean ± SEM, n = 5. (d) Monitoring the change in reaction kinetic rate upon activation and deactivation of the HFMF. Statistical significance was assessed using one-way ANOVA. Data represent mean ± SEM, n = 6. (e) The peroxidase mimic catalytic activity of PBA and DON. UV–vis absorption spectra of catalyzed oxidation of OPD (ox OPD) in an acid environment. (f) The GSH depletion of PBA and DON. (g) Mechanism of peroxidase mimic catalytic process and GSH depletion test of nanoparticles. (h) CLSM images of B16F10 cells incubated with PBA and DON. Blue, green and red represents nucleus stained with DAPI, cytoskeleton with F-Actin, and particles stained with QD, respectively. (i) CLSM images of B16F10 cells incubated with DON to evaluate the lysosomal escape effect of DON after HFMF irradiation. (j) Flow cytometry analysis of PBA and DON.
Figure 4 (a) Degradation patterns of rhodamine B (RhB) under an HFMF with the magnetic strengths of 0, 20, and 40 mT. RhB concentration: 10 mg/L; H2O2 concentration: 5 mM; pH: 7.4. Statistical significance was assessed using one-way ANOVA. Data represent mean ± SEM, n = 5. (b) Relationship between magnetic strength and reaction kinetic rate. Statistical significance was assessed using one-way ANOVA. Data represent mean ± SEM, n = 5. (c) Comparing the observed reaction kinetic rates (kobs) in the presence and absence of an HFMF across different pH values, while maintaining a constant dosage of 5 mL of H2O2. Statistical significance was assessed using one-way ANOVA. Data represent mean ± SEM, n = 5. (d) Monitoring the change in reaction kinetic rate upon activation and deactivation of the HFMF. Statistical significance was assessed using one-way ANOVA. Data represent mean ± SEM, n = 6. (e) The peroxidase mimic catalytic activity of PBA and DON. UV–vis absorption spectra of catalyzed oxidation of OPD (ox OPD) in an acid environment. (f) The GSH depletion of PBA and DON. (g) Mechanism of peroxidase mimic catalytic process and GSH depletion test of nanoparticles. (h) CLSM images of B16F10 cells incubated with PBA and DON. Blue, green and red represents nucleus stained with DAPI, cytoskeleton with F-Actin, and particles stained with QD, respectively. (i) CLSM images of B16F10 cells incubated with DON to evaluate the lysosomal escape effect of DON after HFMF irradiation. (j) Flow cytometry analysis of PBA and DON.CC BY · PubMed Central
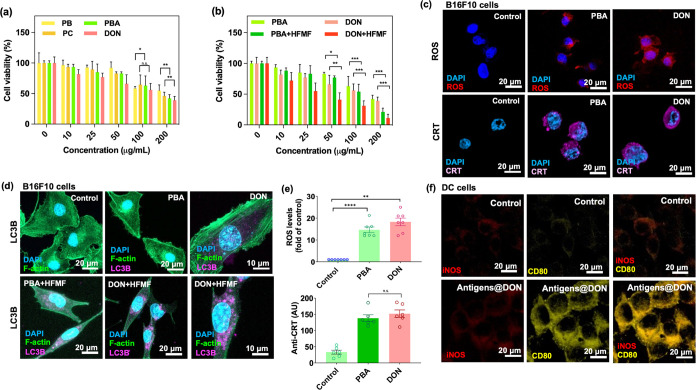
Figure 5 (a,b) Cell viability of B16F10 treated with PB, PC, PBA, and DON at various concentrations with and without subjecting to HFMF. Statistical significance was assessed using one-way ANOVA. Data represent mean ± SEM, n = 6. *p < 0.05, **p < 0.01, ***p < 0.005. (c) CLSM images of in vitro assessments of the intracellular hydroxyl radical ROS generation and anti-CRT via the catalysis of PBA and DON nanoparticles. (d) CLSM images of autophagy activation through the LC3B protein expression of B16F10 cells incubated with PBA, DON, PBA+HFMF, and DON+HFMF. Purple fluorescence indicates LC3B expression, serving as a measure of autophagosome abundance. (e) Quantitative levels of ROS and anti-CRT are expressed as the percentage of hydroxyl identified in control cells. Statistical significance was assessed using one-way ANOVA. Data represent mean ± SEM, n = 6. **p < 0.01, ****p < 0.001. (f) CLSM images of DC 2.4 cells treated with antigen@DON for 24 h.
Figure 5 (a,b) Cell viability of B16F10 treated with PB, PC, PBA, and DON at various concentrations with and without subjecting to HFMF. Statistical significance was assessed using one-way ANOVA. Data represent mean ± SEM, n = 6. *p < 0.05, **p < 0.01, ***p < 0.005. (c) CLSM images of in vitro assessments of the intracellular hydroxyl radical ROS generation and anti-CRT via the catalysis of PBA and DON nanoparticles. (d) CLSM images of autophagy activation through the LC3B protein expression of B16F10 cells incubated with PBA, DON, PBA+HFMF, and DON+HFMF. Purple fluorescence indicates LC3B expression, serving as a measure of autophagosome abundance. (e) Quantitative levels of ROS and anti-CRT are expressed as the percentage of hydroxyl identified in control cells. Statistical significance was assessed using one-way ANOVA. Data represent mean ± SEM, n = 6. **p < 0.01, ****p < 0.001. (f) CLSM images of DC 2.4 cells treated with antigen@DON for 24 h.CC BY · PubMed Central
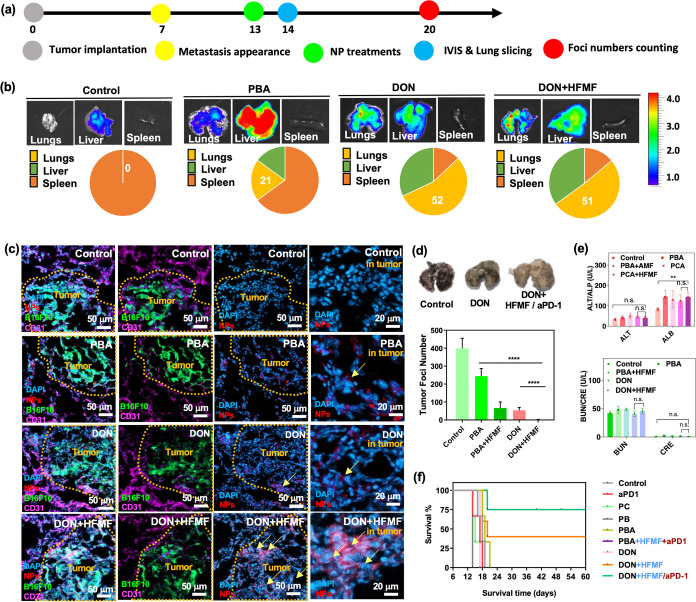
Figure 6 In vivo study. (a) Animal treatment schedule. (b) In vivo IVIS organ biodistribution images of control, PBA, DON, and DON+HFMF-treated mice at 24 h post-treatment. (c) CLSM images of mice bearing GFP-B16F10 lung metastases after treatment with PBA, DON, and DON+HFMF, respectively, after 24 h of treatment. (d) The number of foci in dissected lung metastases treated with PBS (control), PBA, PBA+HFMF, DON, and DON+HFMF intravenously at 14 days postinjection was quantified using ImageJ. Statistical significance was assessed using one-way ANOVA. Data represent mean ± SEM, n = 5. ****p < 0.001. (e) Biochemical indices of liver and kidney after 24 h of treatment. Statistical significance was assessed using one-way ANOVA. Data represent mean ± SEM, n = 3. (f) Survival patterns of animals with lung metastases following treatment with PBS (control), PBA+HFMF, DON, DON+HFMF, and DON+HFMF+αPD-1 (n = 6).
Figure 6 In vivo study. (a) Animal treatment schedule. (b) In vivo IVIS organ biodistribution images of control, PBA, DON, and DON+HFMF-treated mice at 24 h post-treatment. (c) CLSM images of mice bearing GFP-B16F10 lung metastases after treatment with PBA, DON, and DON+HFMF, respectively, after 24 h of treatment. (d) The number of foci in dissected lung metastases treated with PBS (control), PBA, PBA+HFMF, DON, and DON+HFMF intravenously at 14 days postinjection was quantified using ImageJ. Statistical significance was assessed using one-way ANOVA. Data represent mean ± SEM, n = 5. ****p < 0.001. (e) Biochemical indices of liver and kidney after 24 h of treatment. Statistical significance was assessed using one-way ANOVA. Data represent mean ± SEM, n = 3. (f) Survival patterns of animals with lung metastases following treatment with PBS (control), PBA+HFMF, DON, DON+HFMF, and DON+HFMF+αPD-1 (n = 6).CC BY · PubMed Central
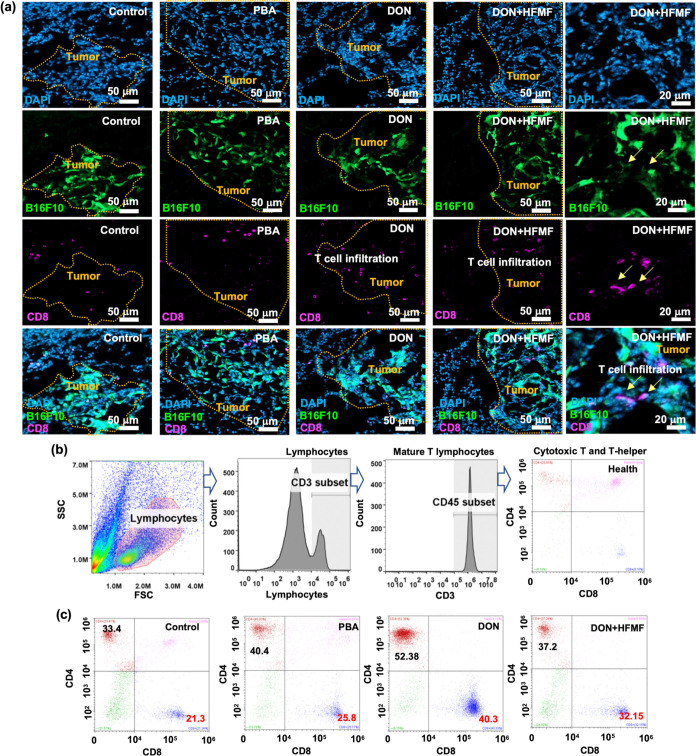
Figure 7 T cell infiltration in metastasis. (a) CLSM images of the lungs 24 h postintravenous injection of particles, along with measurements of CD4+ and CD8+ T cells. (b) Flow cytometry gating strategy for T cells. The lymphocyte population was selected based on SSC and FSC properties. Fluorescence gating for CD3, CD45, CD4, and CD8 was performed using fluorescence minus one (FMO) controls and single-staining compensation. The CD3+ population within the lymphocytes represents mature T lymphocytes, and further gating on CD45+ cells identify the cytotoxic T and T-helper cells. (c) Quantification of in vivo CD4+ and CD8+ T cells via flow cytometry analysis 24 h after control, PBA, DON, and DON+HFMF treatments.
Figure 7 T cell infiltration in metastasis. (a) CLSM images of the lungs 24 h postintravenous injection of particles, along with measurements of CD4+ and CD8+ T cells. (b) Flow cytometry gating strategy for T cells. The lymphocyte population was selected based on SSC and FSC properties. Fluorescence gating for CD3, CD45, CD4, and CD8 was performed using fluorescence minus one (FMO) controls and single-staining compensation. The CD3+ population within the lymphocytes represents mature T lymphocytes, and further gating on CD45+ cells identify the cytotoxic T and T-helper cells. (c) Quantification of in vivo CD4+ and CD8+ T cells via flow cytometry analysis 24 h after control, PBA, DON, and DON+HFMF treatments.CC BY · PubMed Central
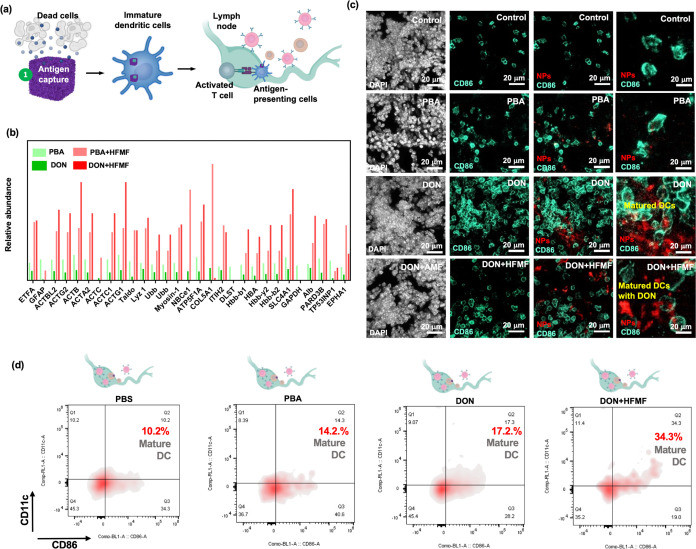
Figure 8 In vivo study of particle treatment in mice bearing B16F10 lung metastases. (a) The scheme of mechanism by which DON captures antigen and delivers it to antigen-presenting cells (APCs) such as dendritic cells (DCs). DCs then transport the antigen to lymph nodes, where they activate the immune system to induce a T-cell immune response. (b) Comparison of the percentage of antigen captured by PBA and DON, respectively. (c) CLSM image of dissected lymph node tissue 24 after injection. White, green, and red fluorescence represent nuclei stained with DAPI, DCs labeled with CD86, and nanoparticles labeled with QDs, respectively. (d) In vivo flow cytometry analysis of LN tissue dissected after 24 h post-treatment by PBA, DON, and DON+HFMF.
Figure 8 In vivo study of particle treatment in mice bearing B16F10 lung metastases. (a) The scheme of mechanism by which DON captures antigen and delivers it to antigen-presenting cells (APCs) such as dendritic cells (DCs). DCs then transport the antigen to lymph nodes, where they activate the immune system to induce a T-cell immune response. (b) Comparison of the percentage of antigen captured by PBA and DON, respectively. (c) CLSM image of dissected lymph node tissue 24 after injection. White, green, and red fluorescence represent nuclei stained with DAPI, DCs labeled with CD86, and nanoparticles labeled with QDs, respectively. (d) In vivo flow cytometry analysis of LN tissue dissected after 24 h post-treatment by PBA, DON, and DON+HFMF.CC BY · PubMed Central
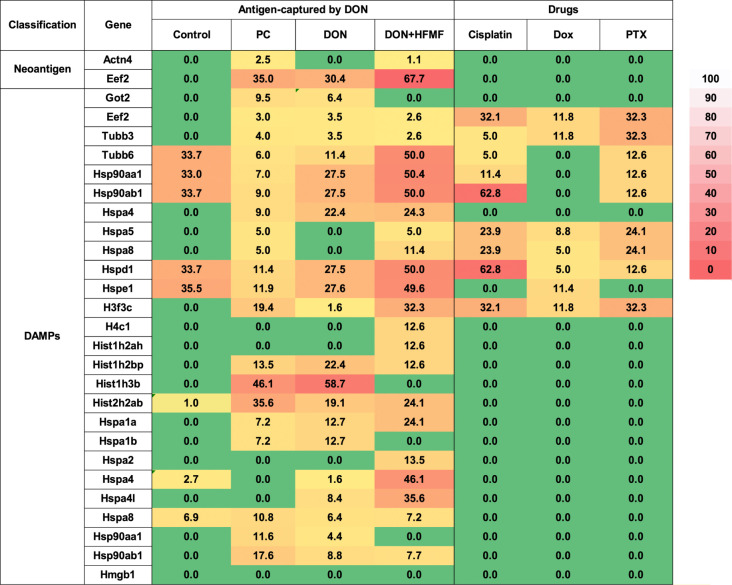
Figure 9 Antigen release after PC, DON, DON+HFMF, and chemodrug-treated cells.
Figure 9 Antigen release after PC, DON, DON+HFMF, and chemodrug-treated cells.CC BY · PubMed Central

Verification

Claims the paper makes

The claims and statistics of this paper haven’t been checked yet.

Run the check — free, no account needed. It reads the open-access text and checks the sources it cites.

A few free checks a day · papers already verified open instantly · results are public

Claims other papers make about this one

Each is checked against this paper’s own text: does it say what the citing paper says it does?

Self-check

Percentages, sums and reported differences re-computed from the paper’s own numbers.

The self-check needs the paper’s full text.

Citations

Cites

Show all 4 references

Research works printed but not linked: 75

  1. 10.3322/caac.21654 · DOI · Paper page
  2. 10.1021/acsnano.3c03980 · DOI
  3. 10.1021/acsnano.3c00901 · DOI
  4. 10.1002/advs.202309857 · DOI
  5. 10.1021/acsnano.4c04022 · DOI
  6. 10.1126/sciimmunol.add1153 · DOI
  7. 10.1002/advs.202304971 · DOI
  8. 10.1021/acsnano.4c06183 · DOI · Paper page
  9. 10.1021/acsnano.3c11174 · DOI · Paper page
  10. 10.1002/advs.202305382 · DOI
  11. 10.1038/s41423-023-00990-6 · DOI
  12. 10.1016/j.nantod.2022.101618 · DOI
  13. 10.3389/fimmu.2021.613492 · DOI
  14. 10.1016/S2665-9913(23)00064-4 · DOI
  15. 10.1016/j.biomaterials.2023.122443 · DOI
  16. 10.1126/scitranslmed.abm5663 · DOI
  17. 10.1038/s41565-022-01098-0 · DOI
  18. 10.1002/advs.202305769 · DOI
  19. 10.1126/science.abg2752 · DOI
  20. 10.1016/j.ijbiomac.2024.131359 · DOI
  21. 10.1021/acsnano.7b04955 · DOI
  22. 10.1002/adma.202309860 · DOI
  23. 10.1021/acsnano.0c09514 · DOI
  24. 10.1002/advs.202310309 · DOI
  25. 10.1021/acsnano.3c10623 · DOI
  26. 10.1016/j.biomaterials.2023.122089 · DOI
  27. 10.1002/adfm.202210644 · DOI
  28. 10.1002/adfm.202401806 · DOI
  29. 10.1002/advs.202300110 · DOI · Paper page
  30. 10.1002/advs.202303566 · DOI
  31. 10.1016/j.biomaterials.2022.121920 · DOI
  32. 10.1002/adfm.202315442 · DOI
  33. 10.1021/acsnano.6b07843 · DOI
  34. 10.1002/adhm.202302315 · DOI
  35. 10.1016/j.nantod.2023.101935 · DOI
  36. 10.1016/j.biomaterials.2023.122090 · DOI
  37. 10.1021/acsnano.2c10251 · DOI
  38. 10.1016/j.addr.2022.114401 · DOI
  39. 10.1021/acsnano.9b08320 · DOI
  40. 10.1002/advs.201902933 · DOI
  41. 10.1021/acsnano.1c09601 · DOI
  42. 10.1016/j.biomaterials.2023.122145 · DOI
  43. 10.1021/acs.nanolett.0c02684 · DOI
  44. 10.1021/acsnano.0c10396 · DOI
  45. 10.1039/D1NR05512G · DOI
  46. 10.1016/j.jconrel.2023.06.033 · DOI
  47. 10.1021/nn405356r · DOI
  48. 10.1002/anie.201105190 · DOI
  49. 10.1016/j.biomaterials.2016.05.027 · DOI
  50. 10.1038/nature14426 · DOI · Paper page
  51. 10.1002/advs.202201734 · DOI
  52. 10.1002/advs.202305275 · DOI
  53. 10.1016/j.jhazmat.2020.122863 · DOI
  54. 10.1007/s11356-021-15498-7 · DOI
  55. 10.1021/acsnano.3c09092 · DOI
  56. 10.1021/acs.analchem.0c03725 · DOI
  57. 10.1021/ja401727n · DOI
  58. 10.1039/C9RA07080J · DOI
  59. Farahmandjou M., 2016, Rev. Mex. Fis., 62, 496
  60. 10.1021/acsnano.6b05858 · DOI
  61. 10.1021/acsnano.3c10994 · DOI
  62. 10.1021/acsnano.2c02832 · DOI
  63. 10.1002/sia.2686 · DOI
  64. 10.1021/acs.analchem.2c04218 · DOI
  65. 10.1039/D2TA06216J · DOI
  66. 10.1021/nn205125e · DOI
  67. 10.1039/C9MH01730E · DOI
  68. 10.1021/acs.nanolett.0c04122 · DOI
  69. 10.1016/j.jconrel.2023.05.028 · DOI
  70. 10.1016/j.pdpdt.2022.102915 · DOI
  71. 10.1007/s12291-013-0408-y · DOI
  72. 10.1016/j.mcat.2022.112226 · DOI
  73. 10.3390/ma14143914 · DOI
  74. 10.21037/tcr-21-1367 · DOI
  75. 10.7554/eLife.19662 · DOI · Paper page

Cited by

Sorted by citations

Metadata

Authors
Chiang, M.-R., Hsu, C.-W., Pan, W.-C., Tran, N.-T., Lee, Y.-S., Chiang, W.-H., Liu, Y.-C., Chen, Y.-W., Chiou, S.-H., & Hu, S.-H.
Venue
ACS Nano
Published
2024-12-31
Volume
19
Issue
2
Pages
2117-2135
ISSN
  • 1936-0851
  • 1936-086X
Cited by
174
References
4
Language
en
Funders
  • National Health Research Institutes (EX112-11111EI)
  • National Tsing Hua University (111F7MELE1, 111Q2715E1)
  • Taipei Veterans General Hospital (VGHUST113-G1-5-2)
  • University System of Taiwan (VGHUST113-G1-5-2)
  • National Science and Technology Council (MOST 111-2636-B-007-007, MOST 111-2636-E-007-021, MOST-110-2634-F-007-025, NSTC 111-2321-B-A49-009, NSTC 112-2314-B-007-005-MY3, NSTC 112-2321-B-007-003, NSTC 112-2321-B-A49-007, NSTC 112-2326-B-007-006)

About these checks

Registry, retraction, Cites and statistics results are computed, not judged, with one exception: a printed reference that no index lists is read once by a model before it counts as a citation error. Claims are extracted by a model and kept only when their quote appears verbatim in the text; each cited source is then checked, with a model’s help, for whether it says what the claim relies on. Those verdicts can be wrong — read the claim’s quote and the cited source before relying on one.

Statistics and arithmetic are recomputed, not judged.

Confidence bands are shown only for fields calibrated on our annotated test set. None is calibrated yet, so no band is shown.

What counts as a claim ›How we measure confidence ›How we check this ›

Are you an author, or do you see a problem with this page? Request a review