Cited by 122

The DOI matches its Crossref record; 2 of the 2 references it cites were found in a registry or an index.

Reprogramming Immunodeficiency in Lung Metastases via PD-L1 siRNA Delivery and Antigen Capture of Nanosponge-Mediated Dendritic Cell Modulation

Huynh, Thi My Hue, Huang, Pin-Xuan, Wang, Kang-Li, Tran, Ngoc-Tri, Iao, Hoi Man, Pan, Wan-Chi, Chang, Yun-Hsuan, Lien, Hui-Wen, Lee, Alan Yueh-Luen, Chou, Tsu-Chin, Chiang, Wen-Hsuan, Hu, Shang-Hsiu·2025·ACS Nano

Overview

The claims and statistics of this paper haven’t been checked yet.

Run the check — free, no account needed. It reads the open-access text and checks the sources it cites.

A few free checks a day · papers already verified open instantly · results are public

Integrity signals

Registry

Crossref · 10.1021/acsnano.5c05395

Cites

2 of 2 references verified0 citation errors · 0 not checkable

Statistics

Figures

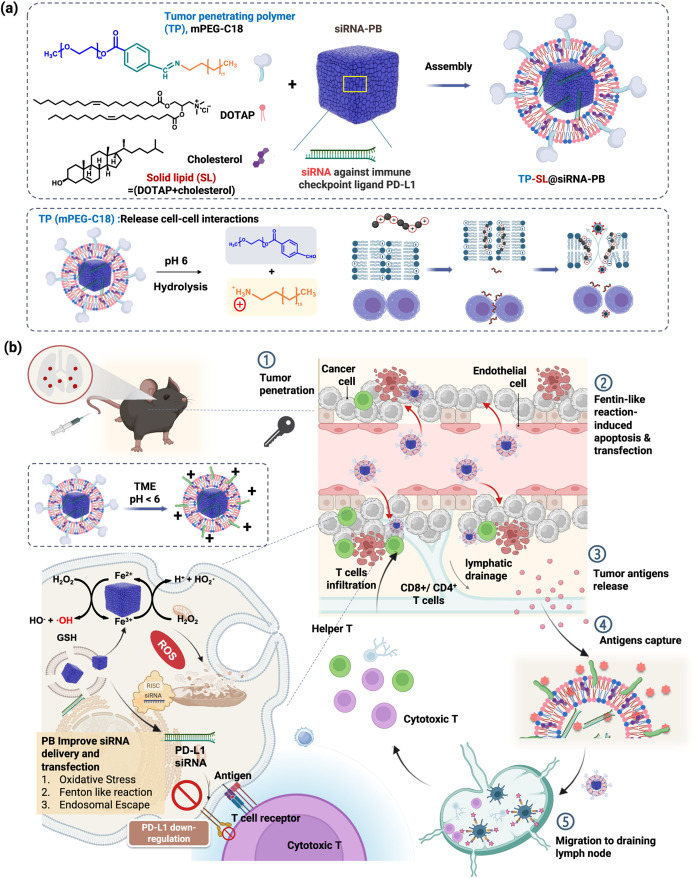
1 Schematic illustration of a pH-responsive lung metastatic-targeted catalysts containing the tumor penetration polymer (TP)/solid lipids (SL)-coated Prussian blue (TP-SL@PB)-enhanced PD-L1 siRNA delivery and self-cascade antigen capture for reprogramming immunodeficiency. (a) Preparation of TP-SL@PB as a lung metastatic-targeted catalyst. TP as agents by pH-responsive tumor accumulation and released cell–cell interaction; SL as a transfection and organ-selection agents. (b) After intravenous injection, TP-SL@PB accumulated in the blood vessel-poor lung metastases via the organ-selective targeting and charge conversion of TP. The catalytic and tumor-penetrating effects for promoting PD-L1 siRNA delivery and chemodynamic therapy. The induced neoantigens and damage-associated molecular (DAMPs) stimulate the uptake of tumor-associated antigens (TAAs) by phagocytic cells and activate CD4+ and CD8+ T cells.
1 Schematic illustration of a pH-responsive lung metastatic-targeted catalysts containing the tumor penetration polymer (TP)/solid lipids (SL)-coated Prussian blue (TP-SL@PB)-enhanced PD-L1 siRNA delivery and self-cascade antigen capture for reprogramming immunodeficiency. (a) Preparation of TP-SL@PB as a lung metastatic-targeted catalyst. TP as agents by pH-responsive tumor accumulation and released cell–cell interaction; SL as a transfection and organ-selection agents. (b) After intravenous injection, TP-SL@PB accumulated in the blood vessel-poor lung metastases via the organ-selective targeting and charge conversion of TP. The catalytic and tumor-penetrating effects for promoting PD-L1 siRNA delivery and chemodynamic therapy. The induced neoantigens and damage-associated molecular (DAMPs) stimulate the uptake of tumor-associated antigens (TAAs) by phagocytic cells and activate CD4+ and CD8+ T cells.CC BY · PubMed Central
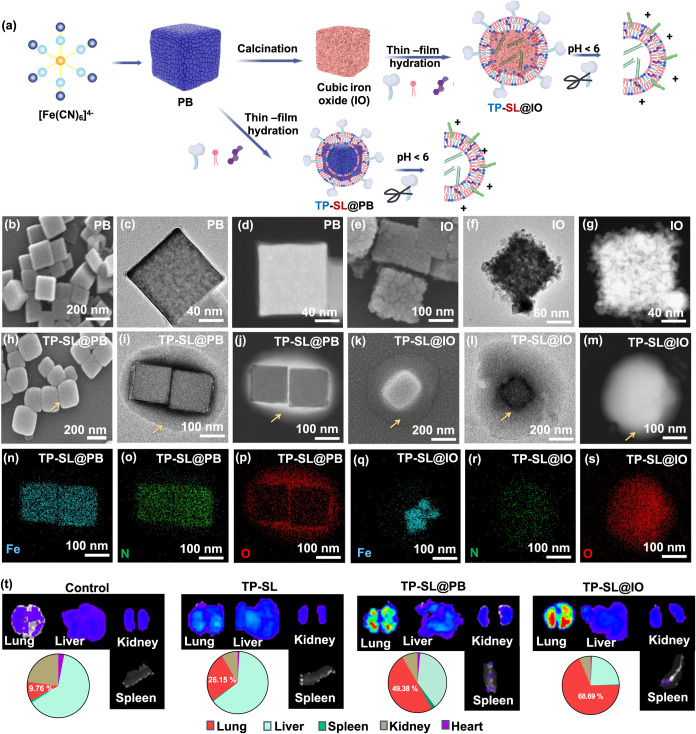
2 Synthesis and characterization of TP-SL@PB. (a) Schematic illustration of the preparation of TP-SL@PB and TP-SL@IO with siRNA. (b–m) SEM and TEM images of PB, IO, TP-SL@PB, and TP-SL@IO, respectively. (n–s) EDS elemental mapping analysis of TP-SL@PB and TP-SL@IO. (t) In vivo IVIS images of the main clearance organs from mice 24 h after treatment with TP-SL, TP-SL@PB, and TP-SL@IO.
2 Synthesis and characterization of TP-SL@PB. (a) Schematic illustration of the preparation of TP-SL@PB and TP-SL@IO with siRNA. (b–m) SEM and TEM images of PB, IO, TP-SL@PB, and TP-SL@IO, respectively. (n–s) EDS elemental mapping analysis of TP-SL@PB and TP-SL@IO. (t) In vivo IVIS images of the main clearance organs from mice 24 h after treatment with TP-SL, TP-SL@PB, and TP-SL@IO.CC BY · PubMed Central
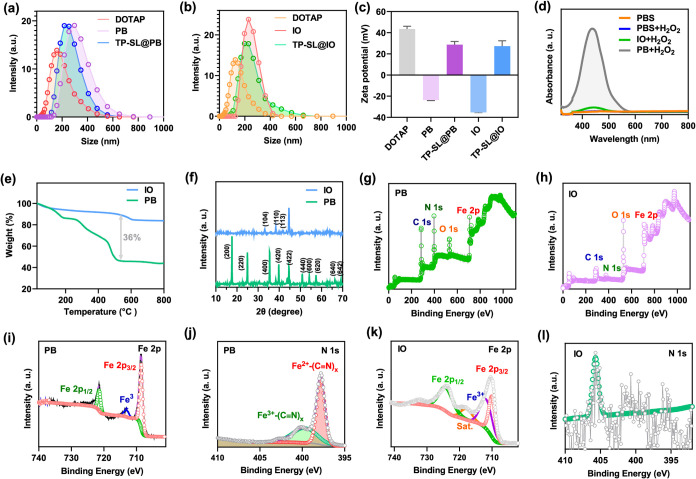
3 Physicochemical characterization of TP-SL@PB and TP-SL@IO. (a, b) Size distribution and (c) ζ-potential of PB, DOTAP LNP, TP-SL@PB, and TP-SL@IO. (d) UV–vis adsorption spectra of catalyzed oxidation of o-phenylenediamine (OPD) after treating with PBS (control), PB, and IO. (e) Thermogravimetric analysis (TGA) of PB and IO. (f) X-ray diffraction patterns of PB and IO. (g, h) XPS spectra of PB and IO. (i–l) High-resolution XPS spectra of Fe 2p and N 1s of PB and IO.
3 Physicochemical characterization of TP-SL@PB and TP-SL@IO. (a, b) Size distribution and (c) ζ-potential of PB, DOTAP LNP, TP-SL@PB, and TP-SL@IO. (d) UV–vis adsorption spectra of catalyzed oxidation of o-phenylenediamine (OPD) after treating with PBS (control), PB, and IO. (e) Thermogravimetric analysis (TGA) of PB and IO. (f) X-ray diffraction patterns of PB and IO. (g, h) XPS spectra of PB and IO. (i–l) High-resolution XPS spectra of Fe 2p and N 1s of PB and IO.CC BY · PubMed Central
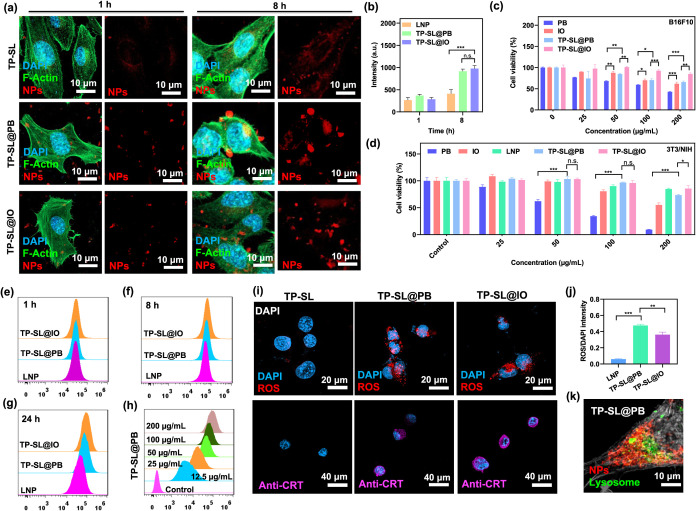
4 In vitro studies and ROS generation of TP-SL@PB. (a) CLSM images of B16F10 cells after incubation with particles for 8 h and (b) quantification of cellular uptake. Blue, green, and red displayed nucleus stained with DAPI, cytoskeleton with F-Actin, and NPs stained with cy5-siRNA, respectively. Error bars represent mean ± SEM, n = 6; ***p < 0.001 compared with the group by one-way ANOVA with Tukey’s multiple comparison test. The cytotoxicity after 24 h of incubation with (c) B16F10 and (d) 3T3NIH cell lines. Error bars represent mean ± SEM, n = 6; *p < 0.5, **p < 0.01, and ***p < 0.001 compared with the group by one-way ANOVA with Tukey’s multiple comparison test. Flow cytometry analysis of TP-SL, TP-SL@PB, and TP-SL@IO in the B16F10 cell line after incubation for (e) 1 h, (f) 8 h, and (g) 24 h. (h) Flow cytometry analysis of TP-SL@IO in B16F10 cell line after incubation at various concentrations. (i) CLSM images and (j) quantification of ROS generation of the B16F10 cell line after treatment with TP-SL, TP-SL@PB, and TP-SL@IO. Error bars represent mean ± SEM, n = 5; **p < 0.01, and ***p < 0.001 compared with the group by one-way ANOVA with Tukey’s multiple comparison test. All data are presented as the mean ± SEM. One-way ANOVA with Tukey’s multiple comparison test and an unpaired two-tailed t test was used to assess statistical significance P values, which are NS, not significant; *P < 0.05, **P < 0.01, ***P < 0.001, ****P < 0.0001. (k) CLSM images of mitochondria of B16F10 cells after treatment with TP-SL@PB.
4 In vitro studies and ROS generation of TP-SL@PB. (a) CLSM images of B16F10 cells after incubation with particles for 8 h and (b) quantification of cellular uptake. Blue, green, and red displayed nucleus stained with DAPI, cytoskeleton with F-Actin, and NPs stained with cy5-siRNA, respectively. Error bars represent mean ± SEM, n = 6; ***p < 0.001 compared with the group by one-way ANOVA with Tukey’s multiple comparison test. The cytotoxicity after 24 h of incubation with (c) B16F10 and (d) 3T3NIH cell lines. Error bars represent mean ± SEM, n = 6; *p < 0.5, **p < 0.01, and ***p < 0.001 compared with the group by one-way ANOVA with Tukey’s multiple comparison test. Flow cytometry analysis of TP-SL, TP-SL@PB, and TP-SL@IO in the B16F10 cell line after incubation for (e) 1 h, (f) 8 h, and (g) 24 h. (h) Flow cytometry analysis of TP-SL@IO in B16F10 cell line after incubation at various concentrations. (i) CLSM images and (j) quantification of ROS generation of the B16F10 cell line after treatment with TP-SL, TP-SL@PB, and TP-SL@IO. Error bars represent mean ± SEM, n = 5; **p < 0.01, and ***p < 0.001 compared with the group by one-way ANOVA with Tukey’s multiple comparison test. All data are presented as the mean ± SEM. One-way ANOVA with Tukey’s multiple comparison test and an unpaired two-tailed t test was used to assess statistical significance P values, which are NS, not significant; *P < 0.05, **P < 0.01, ***P < 0.001, ****P < 0.0001. (k) CLSM images of mitochondria of B16F10 cells after treatment with TP-SL@PB.CC BY · PubMed Central
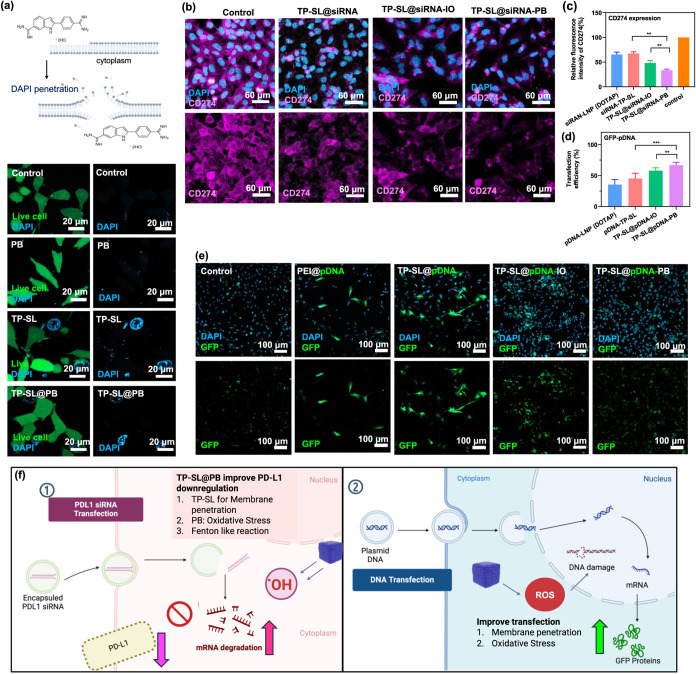
5 (a) Membrane disruption in TP-SL and TP-SL@PB evaluated using DAPI staining visualization and LIVE cytotoxicity kit to assess membrane disruption indicators and cell morphology, respectively. (b) CLMS images of the expression of PD-L1 siRNA-mediated protein knockdown, CD247, after 24 h coculturing with TP-SL, TP-SL@PB, and TP-SL@IO. Quantification of expression of (c) CD247 and (d) GFP-pDNA after various treatments. Error bars represent mean ± SEM, n = 3; **p < 0.01, and ***p < 0.001 compared with the group by one-way ANOVA with Tukey’s multiple comparison test. (e) CLSM images of GFP expression after treatment with GFP-pDNA-loaded with particles incubated with B16F10 cells. (f) The scheme of the mechanism of TP-SL@PB for enhancing PD-L1 siRNA and GFP-pDNA transfection.
5 (a) Membrane disruption in TP-SL and TP-SL@PB evaluated using DAPI staining visualization and LIVE cytotoxicity kit to assess membrane disruption indicators and cell morphology, respectively. (b) CLMS images of the expression of PD-L1 siRNA-mediated protein knockdown, CD247, after 24 h coculturing with TP-SL, TP-SL@PB, and TP-SL@IO. Quantification of expression of (c) CD247 and (d) GFP-pDNA after various treatments. Error bars represent mean ± SEM, n = 3; **p < 0.01, and ***p < 0.001 compared with the group by one-way ANOVA with Tukey’s multiple comparison test. (e) CLSM images of GFP expression after treatment with GFP-pDNA-loaded with particles incubated with B16F10 cells. (f) The scheme of the mechanism of TP-SL@PB for enhancing PD-L1 siRNA and GFP-pDNA transfection.CC BY · PubMed Central
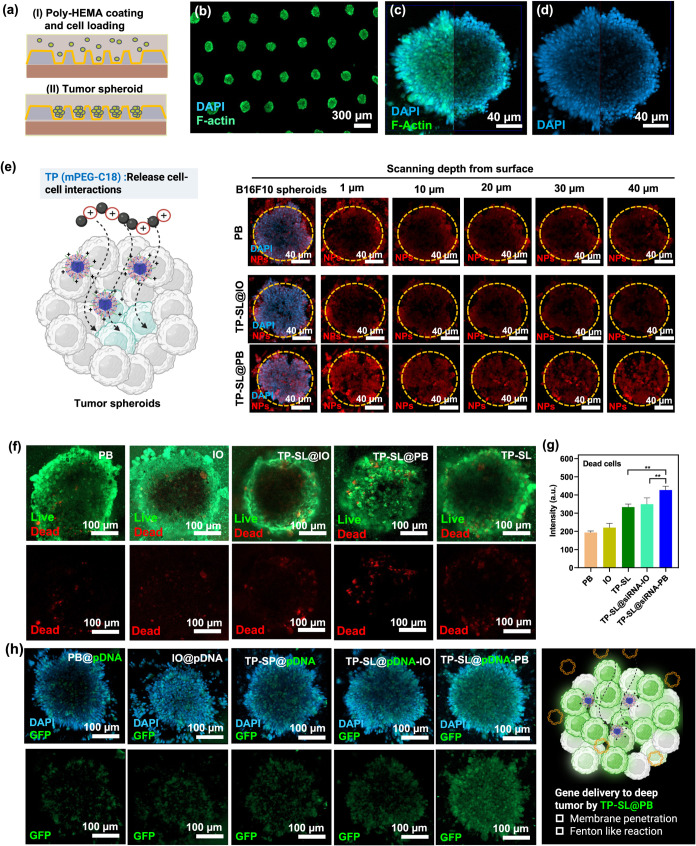
6 (a) Schematic illustration of multicellular tumor spheroid (MTS) preparation on a microfluidic chip through coculturing B16F10 and NIH/3T3 cells. (b–d) CLSM images of untreated MTSs, with nuclei in blue and F-actin in green. (e) CLSM images of MTSs treated with PB, TP-SL@IO, and TP-SL@PB, with Cy5-siRNA-labeled particles shown in red fluorescence. (f) Live/dead images and (g) qualification of fluorescence intensity of MTS after treatment with PB, IO, TP-SL@PB, TP-SL@IO, and TP-SL@PB. Error bars represent mean ± SEM, n = 6; **p < 0.01 compared with the group by one-way ANOVA with Tukey’s multiple comparison test. (h) CLSM images of GFP-pDNA expression in MTS after treatment with various particles.
6 (a) Schematic illustration of multicellular tumor spheroid (MTS) preparation on a microfluidic chip through coculturing B16F10 and NIH/3T3 cells. (b–d) CLSM images of untreated MTSs, with nuclei in blue and F-actin in green. (e) CLSM images of MTSs treated with PB, TP-SL@IO, and TP-SL@PB, with Cy5-siRNA-labeled particles shown in red fluorescence. (f) Live/dead images and (g) qualification of fluorescence intensity of MTS after treatment with PB, IO, TP-SL@PB, TP-SL@IO, and TP-SL@PB. Error bars represent mean ± SEM, n = 6; **p < 0.01 compared with the group by one-way ANOVA with Tukey’s multiple comparison test. (h) CLSM images of GFP-pDNA expression in MTS after treatment with various particles.CC BY · PubMed Central
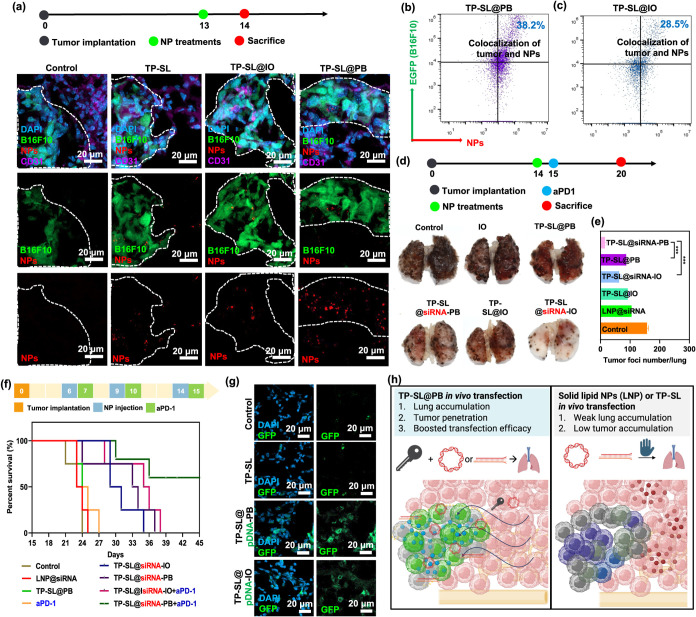
7 (a) CLSM images of GFP-B16F10 lung metastases administered with cy5-siRNA-labeled TP-SL, TP-SL@PB, and TP-SL@IO at 24 h after injection. (b, c) Representative quantification of colocalization between B16F10 lung metastases and cy5-siRNA-labeled TP-SL@PB, and TP-SL@IO by flow cytometry analysis. (d) Lung tumor suppression images treated with PBS (control), IO, TP-SL@PB, TP-SL@siRNA-PB, TP-SL@IO, and TP-SL@siRNA-IO. (e) Tumor foci numbers after various treatments. Error bars represent mean ± SEM, n = 6; ***p < 0.001 compared with the group by one-way ANOVA with Tukey’s multiple comparison test. (f) Survival curves of animals with lung metastases following different treatments (n = 6). (g) CLSM images of GFP expression in lung metastases following different treatments. (h) The mechanism of TP-SL@PB for enhancing gene delivery in vivo.
7 (a) CLSM images of GFP-B16F10 lung metastases administered with cy5-siRNA-labeled TP-SL, TP-SL@PB, and TP-SL@IO at 24 h after injection. (b, c) Representative quantification of colocalization between B16F10 lung metastases and cy5-siRNA-labeled TP-SL@PB, and TP-SL@IO by flow cytometry analysis. (d) Lung tumor suppression images treated with PBS (control), IO, TP-SL@PB, TP-SL@siRNA-PB, TP-SL@IO, and TP-SL@siRNA-IO. (e) Tumor foci numbers after various treatments. Error bars represent mean ± SEM, n = 6; ***p < 0.001 compared with the group by one-way ANOVA with Tukey’s multiple comparison test. (f) Survival curves of animals with lung metastases following different treatments (n = 6). (g) CLSM images of GFP expression in lung metastases following different treatments. (h) The mechanism of TP-SL@PB for enhancing gene delivery in vivo.CC BY · PubMed Central
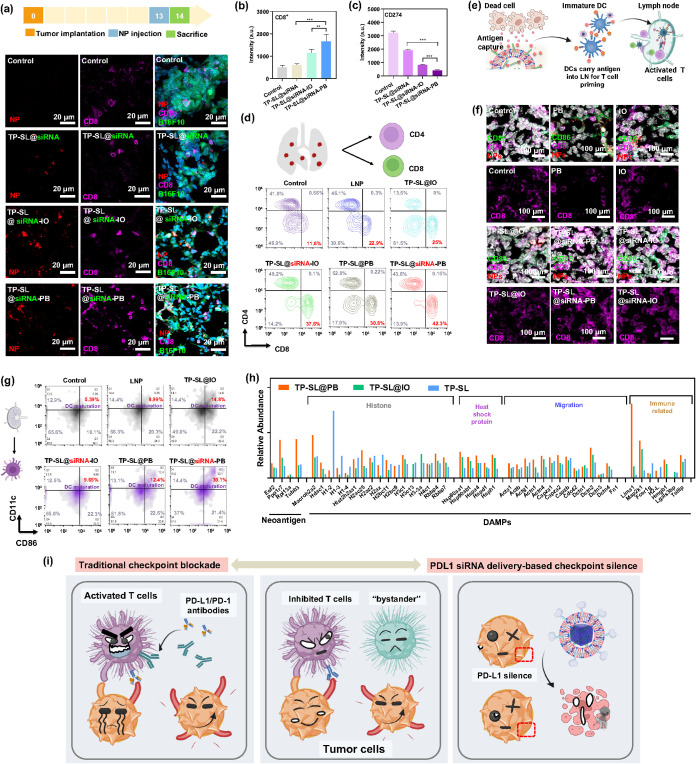
8 (a) CLSM images of lung metastases treated with TP-SL@siRNA, TP-SL@siRNA-IO, and TP-SL@siRNA-PB at 24 h postinjection, respectively. The quantification of fluorescence images of (b) CD8+ T cells and (c) expression of CD274 after various treatments. Error bars represent mean ± SEM, n = 3; **p < 0.01, and ***p < 0.001 compared with the group by one-way ANOVA with Tukey’s multiple comparison test. (d) In vivo immune response study in lung models by using flow cytometry analysis. (e) Illustration of antigen capture and stimulation for immunotherapy in the lymph node (LN). (f) CLSM images of lymph nodes. White, green, and purple fluorescence represent nucleus staining with DAPI, DCs with CD86, and T cells with CD8. (g) In vivo flow cytometry analysis of dissected LN tissue (CD11c and CD86) 24 h post-treatment. (h) Percentage of antigen capture and typical chemokine secretion in B16F10 cell line after TP-SL@PB treatment, quantified by LC-MS/MS. (i) Schematic illustration comparing the conventional checkpoint blockade strategy with the RNAi-driven tumor-targeted checkpoint nanoblocker.
8 (a) CLSM images of lung metastases treated with TP-SL@siRNA, TP-SL@siRNA-IO, and TP-SL@siRNA-PB at 24 h postinjection, respectively. The quantification of fluorescence images of (b) CD8+ T cells and (c) expression of CD274 after various treatments. Error bars represent mean ± SEM, n = 3; **p < 0.01, and ***p < 0.001 compared with the group by one-way ANOVA with Tukey’s multiple comparison test. (d) In vivo immune response study in lung models by using flow cytometry analysis. (e) Illustration of antigen capture and stimulation for immunotherapy in the lymph node (LN). (f) CLSM images of lymph nodes. White, green, and purple fluorescence represent nucleus staining with DAPI, DCs with CD86, and T cells with CD8. (g) In vivo flow cytometry analysis of dissected LN tissue (CD11c and CD86) 24 h post-treatment. (h) Percentage of antigen capture and typical chemokine secretion in B16F10 cell line after TP-SL@PB treatment, quantified by LC-MS/MS. (i) Schematic illustration comparing the conventional checkpoint blockade strategy with the RNAi-driven tumor-targeted checkpoint nanoblocker.CC BY · PubMed Central

Verification

Claims the paper makes

The claims and statistics of this paper haven’t been checked yet.

Run the check — free, no account needed. It reads the open-access text and checks the sources it cites.

A few free checks a day · papers already verified open instantly · results are public

Claims other papers make about this one

Each is checked against this paper’s own text: does it say what the citing paper says it does?

Self-check

Percentages, sums and reported differences re-computed from the paper’s own numbers.

The self-check needs the paper’s full text.

Citations

Cites

Show all 2 references

Research works printed but not linked: 60

  1. 10.1038/s41565-023-01580-3 · DOI · Paper page
  2. 10.1021/acsnano.2c07607 · DOI
  3. 10.1021/acsnano.3c03980 · DOI
  4. 10.1038/s41565-024-01800-4 · DOI
  5. 10.1021/acsnano.4c09525 · DOI · Paper page
  6. 10.1002/adfm.202007149 · DOI
  7. 10.1021/acsnano.4c09190 · DOI
  8. 10.1002/smll.202406178 · DOI
  9. 10.1021/acsnano.3c08875 · DOI
  10. 10.1002/smll.202406790 · DOI
  11. 10.1021/acsnano.3c11260 · DOI
  12. 10.1021/acsnano.4c06183 · DOI · Paper page
  13. 10.1038/s41392-024-01765-9 · DOI
  14. 10.1021/acsnano.1c09601 · DOI
  15. 10.1186/s12943-022-01696-5 · DOI
  16. 10.1002/jgm.3733 · DOI
  17. 10.1038/s41576-021-00439-4 · DOI · Paper page
  18. 10.1021/acsnano.0c10180 · DOI
  19. 10.1002/adfm.202009768 · DOI
  20. 10.1016/j.nantod.2023.101935 · DOI
  21. 10.1002/adma.202301770 · DOI
  22. 10.1002/adfm.202100386 · DOI
  23. 10.1021/acsnano.4c11259 · DOI
  24. 10.1016/j.biomaterials.2023.122443 · DOI
  25. 10.1002/adma.202500650 · DOI
  26. 10.1021/acsnano.4c08922 · DOI
  27. 10.1038/s41467-023-43798-8 · DOI
  28. 10.1016/j.jconrel.2023.06.033 · DOI
  29. 10.1021/nn3024688 · DOI
  30. 10.1002/adfm.202401806 · DOI
  31. 10.1021/acsnano.4c06183 · DOI · Paper page
  32. 10.1016/j.ijbiomac.2024.131359 · DOI
  33. 10.1002/adfm.202402692 · DOI
  34. 10.1002/adfm.202210644 · DOI
  35. 10.1002/adfm.202107195 · DOI
  36. 10.1016/j.biomaterials.2017.11.031 · DOI
  37. 10.1002/adhm.202303543 · DOI
  38. 10.1016/j.biomaterials.2023.122443 · DOI
  39. 10.1016/j.jconrel.2023.05.028 · DOI
  40. 10.1038/s41392-025-02148-4 · DOI
  41. 10.1038/nrc3380 · DOI · Paper page
  42. 10.1002/advs.202504786 · DOI
  43. 10.1007/s10616-020-00440-5 · DOI
  44. 10.1002/adma.202404608 · DOI
  45. 10.1002/adma.202007356 · DOI
  46. 10.1016/j.nantod.2025.102838 · DOI · Paper page
  47. 10.1038/s41467-024-50020-w · DOI
  48. 10.1038/s41423-023-01042-9 · DOI
  49. 10.1038/s41392-023-01723-x · DOI
  50. 10.1038/s41598-025-85670-3 · DOI
  51. 10.1038/s41392-023-01576-4 · DOI
  52. 10.1038/s41467-025-56147-8 · DOI
  53. 10.1016/j.biomaterials.2021.120974 · DOI
  54. 10.1038/nrc.2016.154 · DOI · Paper page
  55. 10.1038/s41467-022-32645-x · DOI
  56. 10.1038/s41467-024-54810-0 · DOI
  57. 10.1038/s12276-020-00540-4 · DOI
  58. 10.1002/pmic.201800483 · DOI
  59. 10.1161/HYPERTENSIONAHA.119.13472 · DOI
  60. 10.1038/s41598-019-41093-5 · DOI

Cited by

Sorted by citations

Metadata

Authors
Huynh, T. M. H., Huang, P.-X., Wang, K.-L., Tran, N.-T., Iao, H. M., Pan, W.-C., Chang, Y.-H., Lien, H.-W., Lee, A. Y.-L., Chou, T.-C., Chiang, W.-H., & Hu, S.-H.
Venue
ACS Nano
Published
2025-07-05
Volume
19
Issue
27
Pages
25134-25153
ISSN
  • 1936-0851
  • 1936-086X
Cited by
122
References
2
Language
en
Funders
  • National Health Research Institutes (NHRI-EX113-11111EI)
  • National Tsing Hua University (112F7MDHE1, 112F7MDKE1, 112Q2715E1)
  • National Science and Technology Council (MOST 111-2314-B-007 -003 -MY3, NSTC 112-2314-B-007 -005 -MY3, NSTC 112-2321-B-007-003 -)

About these checks

Registry, retraction, Cites and statistics results are computed, not judged, with one exception: a printed reference that no index lists is read once by a model before it counts as a citation error. Claims are extracted by a model and kept only when their quote appears verbatim in the text; each cited source is then checked, with a model’s help, for whether it says what the claim relies on. Those verdicts can be wrong — read the claim’s quote and the cited source before relying on one.

Statistics and arithmetic are recomputed, not judged.

Confidence bands are shown only for fields calibrated on our annotated test set. None is calibrated yet, so no band is shown.

What counts as a claim ›How we measure confidence ›How we check this ›

Are you an author, or do you see a problem with this page? Request a review