

The DOI matches its Crossref record; 6 of the 6 references it cites were found in a registry or an index.
Benchmarking HelixFold3-Predicted Holo Structures for Relative Free Energy Perturbation Calculations
Open accessPublished version of a preprint
Abstract
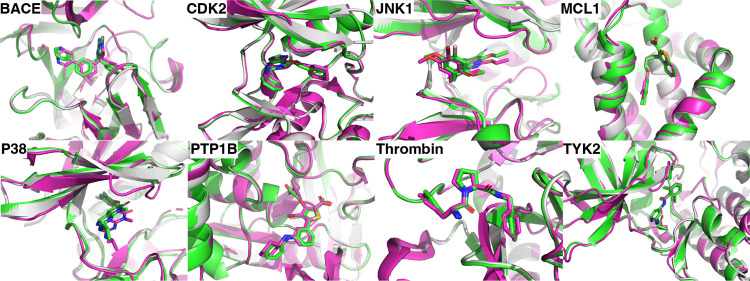
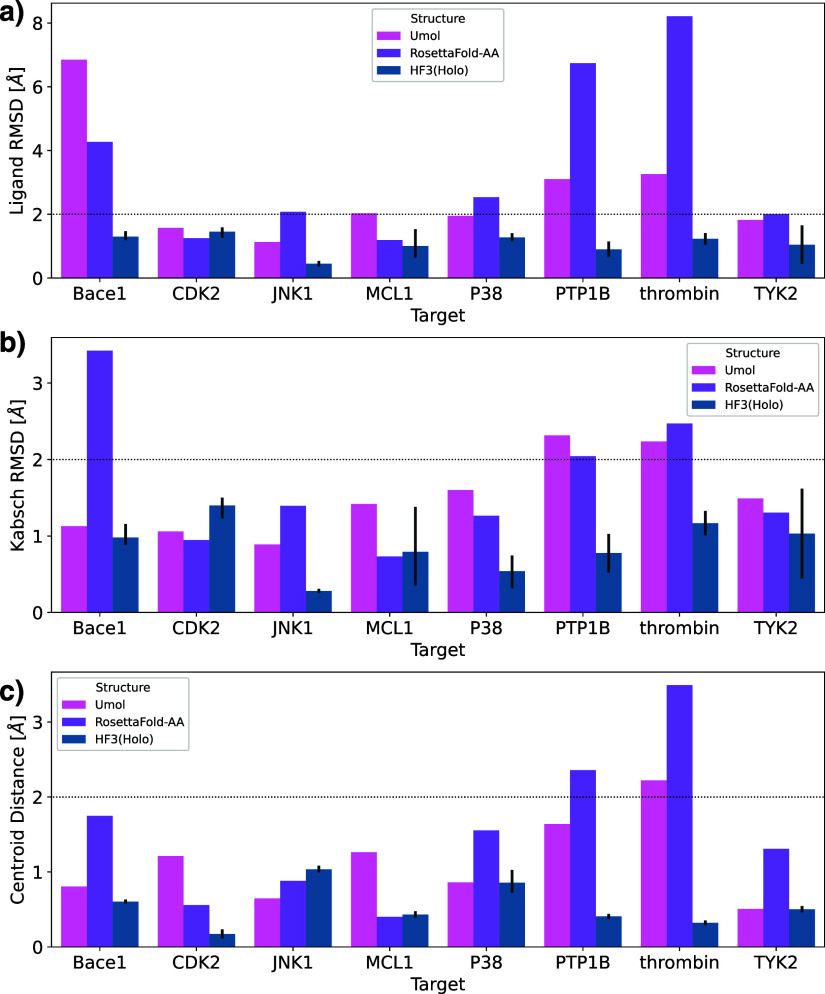
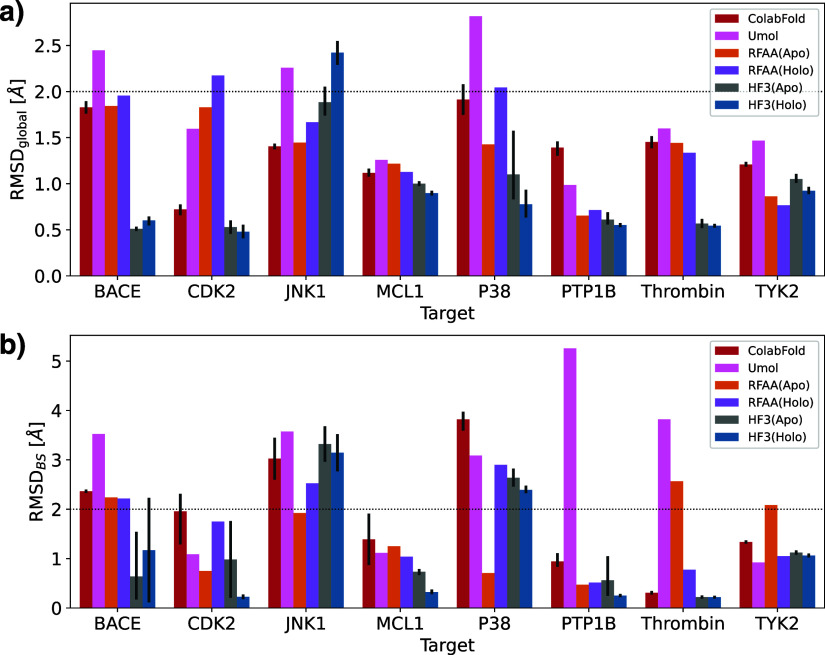
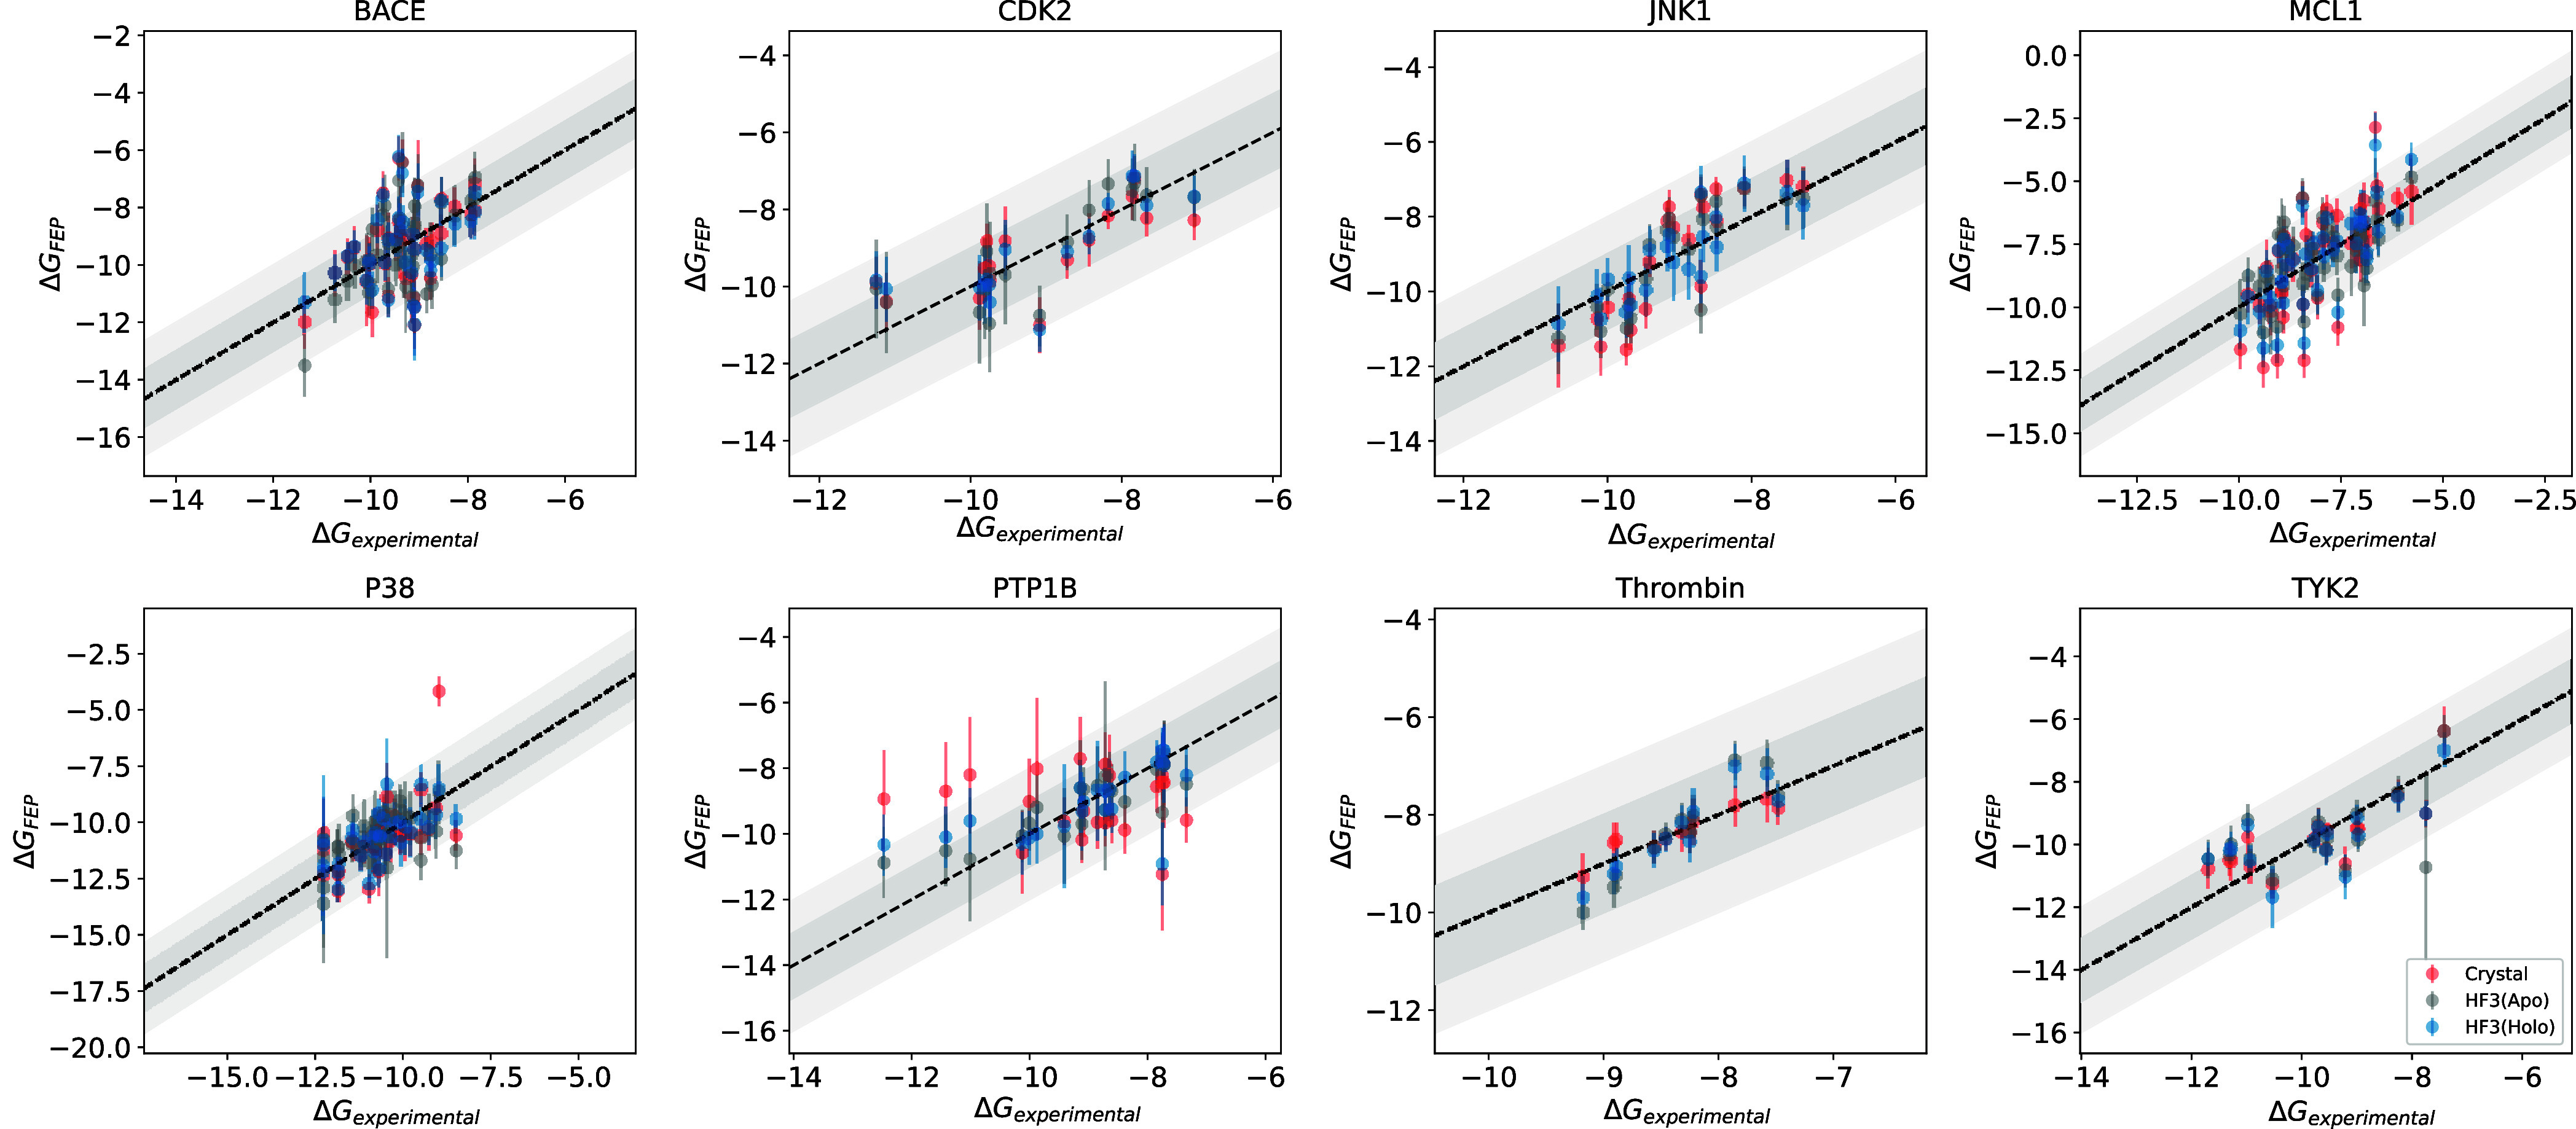
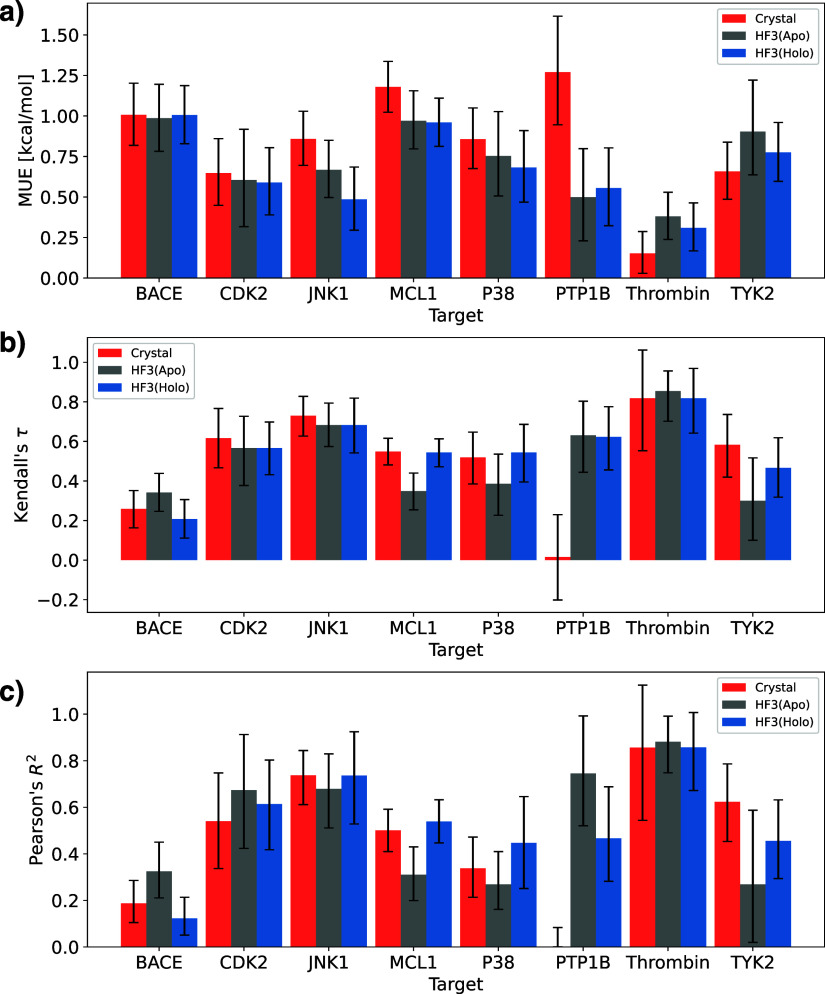
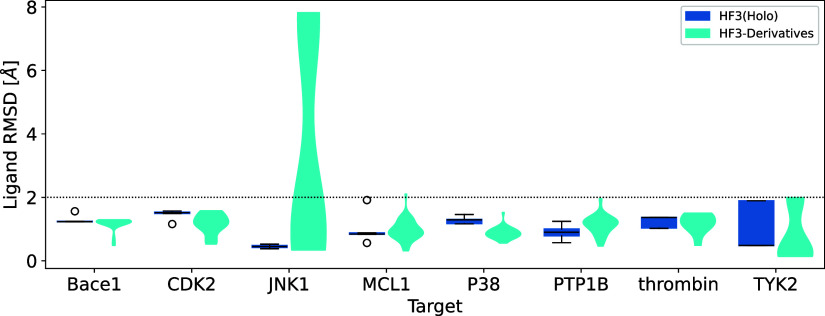
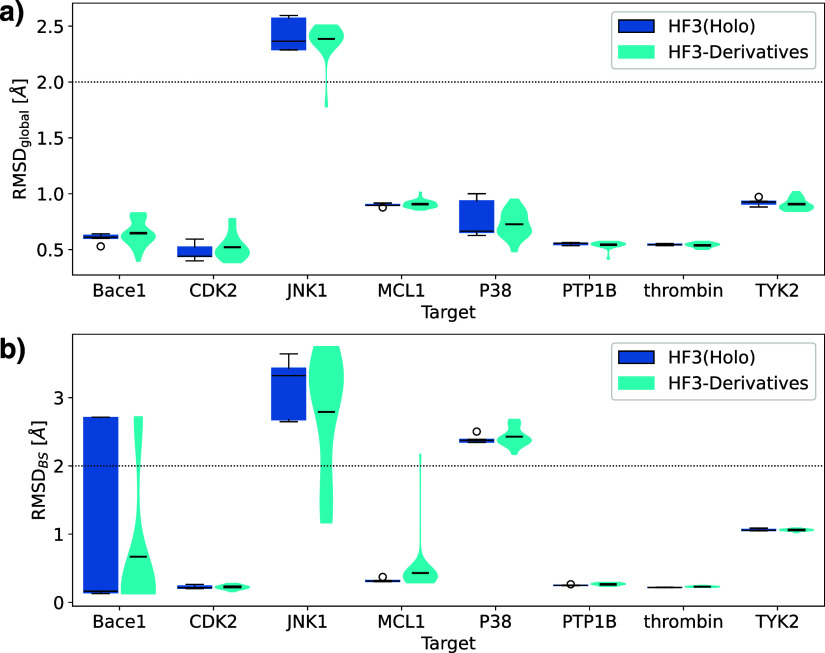
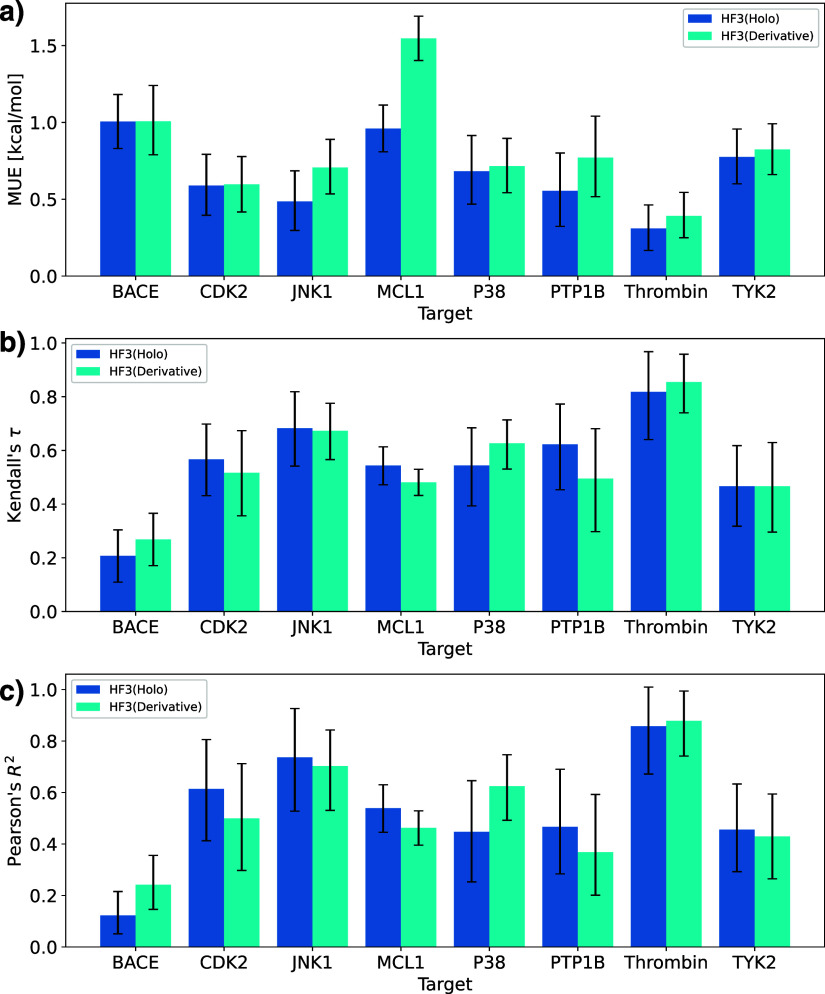
AlphaFold2 demonstrated remarkable capabilities for protein structure prediction. However, it is limited to downstream tasks, such as ligand docking and free energy calculations, as it cannot predict holo structures with bound ligands. AlphaFold3, a state-of-the-art protein structure prediction model, can predict the binding structures of complexes with proteins, nucleic acids, small molecules, ions, and modified residues with cutting-edge performance. However, AlphaFold3 does not currently provide access to some functions, such as the prediction of protein-ligand complex structures. To reduce the enormous costs in early small molecule drug discovery, verifying the utility of protein-ligand complex prediction methods, such as AlphaFold3, in downstream tasks like free energy perturbation calculations is crucial. In this study, we evaluated HelixFold3, designed to emulate AlphaFold3, in predicting holo and apo structures' complex formations and examined its utility in free energy perturbation calculations. Regarding the complex structure prediction performance of the 8 targets from Wang \etal's FEP benchmark, HelixFold3 showed superior performance to AlphaFold2 and existing methods. Predicting a holo structure rather than an apo structure resulted in higher binding site prediction accuracy. Furthermore, using HelixFold3 predicted structures in practical situations, where binding free energies of all derivatives were estimated, both structures achieved accuracies comparable to crystal structures. Additionally, novel derivatives not included in the training data were accurately predicted, demonstrating that free energy calculations using these novel structures are sufficiently usable.
Overview
The claims and statistics of this paper haven’t been checked yet.
Run the check — free, no account needed. It reads the open-access text and checks the sources it cites.
Integrity signals
Registry
Cites
Statistics
Figures
Verification
Claims the paper makes
The claims and statistics of this paper haven’t been checked yet.
Run the check — free, no account needed. It reads the open-access text and checks the sources it cites.
Self-check
Percentages, sums and reported differences re-computed from the paper’s own numbers.
The self-check needs the paper’s full text.
Citations
Cites
Highly accurate protein structure prediction with AlphaFold
Jumper, J., Evans, R., Pritzel, A., Green, T., Figurnov, M., Ronneberger, O., Tunyasuvunakool, K., Bates, R., Žídek, A., Potapenko, A., et al. (2021) · Nature · doi:10.1038/s41586-021-03819-2 · Cited by 43,764
Accurate structure prediction of biomolecular interactions with AlphaFold 3
Abramson, J., Adler, J., Dunger, J., Evans, R., Green, T., Pritzel, A., Ronneberger, O., Willmore, L., Ballard, A. J., Bambrick, J., et al. (2024) · Nature · doi:10.1038/s41586-024-07487-w · Cited by 15,861
Wang, L., Wu, Y., Deng, Y., Kim, B., Pierce, L., Krilov, G., Lupyan, D., Robinson, S., Dahlgren, M. K., Greenwood, J., et al. (2015) · Journal of the American Chemical Society · doi:10.1021/ja512751q · Cited by 1,313
Generalized biomolecular modeling and design with RoseTTAFold All-Atom
Krishna, R., Wang, J., Ahern, W., Sturmfels, P., Venkatesh, P., Kalvet, I., Lee, G. R., Morey-Burrows, F. S., Anishchenko, I., Humphreys, I. R., et al. (2024) · Science · doi:10.1126/science.adl2528 · Cited by 978
Protein-level assembly increases protein sequence recovery from metagenomic samples manyfold
Steinegger, M., Mirdita, M., & Söding, J. (2019) · Nature Methods · doi:10.1038/s41592-019-0437-4 · Cited by 445
Assessment of Binding Affinity via Alchemical Free-Energy Calculations
Kuhn, M., Firth-Clark, S., Tosco, P., Mey, A. S. J. S., Mackey, M., & Michel, J. (2020) · Journal of Chemical Information and Modeling · doi:10.1021/acs.jcim.0c00165 · Cited by 222
Research works printed but not linked: 22
- 10.1101/2021.10.04.463034 · DOI · Paper page
- Liu, L.; Zhang, S.; Xue, Y.; Ye, X.; Zhu, K.; Li, Y.; Liu, Y.; Zhang, X.; Fang, X. Technical Report of HelixFold3 for Biomolecular Structure Prediction. arXiv preprint, arXiv:2408.16975 , 2024. · arXiv
- 10.1021/acs.jctc.3c00839 · DOI
- 10.1021/acs.jcim.2c01270 · DOI
- 10.1002/pro.4530 · DOI
- 10.1021/acs.jcim.2c00796 · DOI · Paper page
- 10.1039/D3SC04185A · DOI
- 10.1002/jcc.21334 · DOI · Paper page
- 10.1007/s10822-013-9678-y · DOI
- 10.1021/acs.jcim.4c01634 · DOI
- 10.1021/acs.jctc.5b00255 · DOI
- 10.1002/jcc.20035 · DOI
- 10.1002/(SICI)1096-987X(20000130)21:2<132::AID-JCC5>3.0.CO;2-P · DOI
- 10.1063/1.445869 · DOI
- 10.1038/s41467-018-04964-5 · DOI · Paper page
- 10.1093/nar/28.1.235 · DOI · Paper page
- 10.1038/s41592-022-01488-1 · DOI · Paper page
- 10.1038/s41467-024-48837-6 · DOI · Paper page
- 10.1093/bioinformatics/bty1057 · DOI · Paper page
- 10.1021/ct300857j · DOI
- 10.1107/S0567739476001873 · DOI
- Lu, W.; Zhang, J.; Rao, J.; Zhang, Z.; Zheng, S. AlphaFold3, a secret sauce for predicting mutational effects on protein-protein interactions. bioRxiv , 202410.1101/2024.05.25.595871. · DOI
Metadata
- Authors
- Furui, K., & Ohue, M.
- Affiliations
- Institute of Science Tokyo (JP)
- Corresponding author
- Ohue, Masahito
- Venue
- ACS Omega
- Publisher
- American Chemical Society (ACS)
- Published
- 2025-03-11
- Volume
- 10
- Issue
- 11
- Pages
- 11411-11420
- ISSN
- 2470-1343 (ISSN-L)
- PMC
- PMC11947795
- OpenAlex
- W4408327279
- Cited by
- 8
- References
- 6
- Citations by year
- 2026: 5 · 2025: 3
- FWCI
- 4.13
- Type
- journal article
- Language
- en
- Open access
- gold
- doi.org
- Licence
- Locations
- ACS Omega (publishedVersion, cc-by)
- bioRxiv (Cold Spring Harbor Laboratory) (acceptedVersion)
- Europe PMC (PubMed Central) (publishedVersion, cc-by)
- PubMed Central (publishedVersion, cc-by)
- PubMed (publishedVersion)
- DOAJ (DOAJ: Directory of Open Access Journals) (submittedVersion, cc-by-sa)
- Funders
- Japan Agency for Medical Research and Development (JP24ama121026)
- Japan Society for the Promotion of Science (JP23H04880, JP23H04887, JP24KJ1091)
- Japan Science and Technology Corporation (JPMJFR216J)
- Topics
- Life Sciences › Pharmacology, Toxicology and Pharmaceutics › Drug Discovery › Computational Drug Discovery Methods
- Life Sciences › Biochemistry, Genetics and Molecular Biology › Molecular Biology › Protein Structure and Dynamics
- Life Sciences › Biochemistry, Genetics and Molecular Biology › Molecular Biology › Receptor Mechanisms and Signaling
- Keywords
- AlphaFold3, free energy perturbation, binding affinity prediction, binding site conformation, structure-based drug design
About these checks
Registry, retraction, Cites and statistics results are computed, not judged, with one exception: a printed reference that no index lists is read once by a model before it counts as a citation error. Claims are extracted by a model and kept only when their quote appears verbatim in the text; each cited source is then checked, with a model’s help, for whether it says what the claim relies on. Those verdicts can be wrong — read the claim’s quote and the cited source before relying on one.
Statistics and arithmetic are recomputed, not judged.
Confidence bands are shown only for fields calibrated on our annotated test set. None is calibrated yet, so no band is shown.
What counts as a claim ›How we measure confidence ›How we check this ›
Are you an author, or do you see a problem with this page? Request a review
