

Autonomic Integration in Nested Protocell Communities
Open accessThe DOI matches its Crossref record; 60 of the 60 references it cites were found in a registry or an index.
Abstract
The self-driven organization of model protocells into higher-order nested cytomimetic systems with coordinated structural and functional relationships offers a step toward the autonomic implementation of artificial multicellularity. Here, we describe an endosymbiotic-like pathway in which proteinosomes are captured within membranized alginate/silk fibroin coacervate vesicles by guest-mediated reconfiguration of the host protocells. We demonstrate that interchange of coacervate vesicle and droplet morphologies through proteinosome-mediated urease/glucose oxidase activity produces discrete nested communities capable of integrated catalytic activity and selective disintegration. The self-driving capacity is modulated by an internalized fuel-driven process using starch hydrolases sequestered within the host coacervate phase, and structural stabilization of the integrated protocell populations can be achieved by on-site enzyme-mediated matrix reinforcement involving dipeptide supramolecular assembly or tyramine-alginate covalent cross-linking. Our work highlights a semi-autonomous mechanism for constructing symbiotic cell-like nested communities and provides opportunities for the development of reconfigurable cytomimetic materials with structural, functional, and organizational complexity.
Overview
The claims and statistics of this paper haven’t been checked yet.
Free: it reads the open-access text and checks the first 5 claims that cite a source we can check. Create a free account to check every claim.
Integrity signals
Registry
Cites
Statistics
Figures


Verification
Claims the paper makes
The claims and statistics of this paper haven’t been checked yet.
Free: it reads the open-access text and checks the first 5 claims that cite a source we can check. Create a free account to check every claim.
Claims other papers make about this one
Each is checked against this paper’s own text: does it say what the citing paper says it does?
The cited source says what the claim attributes to it.
In the citing paper
“Coacervates are also interesting microcompartments which have shown many responsive behavior (Gobbo, 2020; Gao et al., 2021; Yin et al., 2023)”
From Wetware network-based AI: a chemical approach to embodied cognition for robotics and artificial intelligence (2026) · cites this paper as Yin et al., 2023
Self-check
Percentages, sums and reported differences re-computed from the paper’s own numbers.
The self-check needs the paper’s full text.
Citations
Cites
Huang, X., Li, M., Green, D. C., Williams, D. S., Patil, A. J., & Mann, S. (2013) · Nature Communications · doi:10.1038/ncomms3239 · Cited by 510
Self-citationLee, K. Y., Park, S.-J., Lee, K. A., Kim, S.-H., Kim, H., Meroz, Y., Mahadevan, L., Jung, K.-H., Ahn, T. K., Parker, K. K., et al. (2018) · Nature Biotechnology · doi:10.1038/nbt.4140 · Cited by 383
Engineering genetic circuit interactions within and between synthetic minimal cells
Adamala, K. P., Martin-Alarcon, D. A., Guthrie-Honea, K. R., & Boyden, E. S. (2017) · Nature Chemistry · doi:10.1038/nchem.2644 · Cited by 356
Simon, J. R., Carroll, N. J., Rubinstein, M., Chilkoti, A., & López, G. P. (2017) · Nature Chemistry · doi:10.1038/nchem.2715 · Cited by 343
DNA-based communication in populations of synthetic protocells
Joesaar, A., Yang, S., Bögels, B., van der Linden, A., Pieters, P., Kumar, B. V. V. S. P., Dalchau, N., Phillips, A., Mann, S., & de Greef, T. F. A. (2019) · Nature Nanotechnology · doi:10.1038/s41565-019-0399-9 · Cited by 331
Self-citationPredatory behaviour in synthetic protocell communities
Qiao, Y., Li, M., Booth, R., & Mann, S. (2017) · Nature Chemistry · doi:10.1038/nchem.2617 · Cited by 329 · cited 1×
“…for the development of physically interactive artificial cell communities that exhibit behaviors such as artificial phagocytosis, 43 parasitism, 44 and predation 45 − 48 to produce nested protocells via mechanisms of engulfment, processing, and functional integration (artificial endosymbiosis).”
Self-citationHierarchical Self-Assembly of a Copolymer-Stabilized Coacervate Protocell
Mason, A. F., Buddingh’, B. C., Williams, D. S., & van Hest, J. C. M. (2017) · Journal of the American Chemical Society · doi:10.1021/jacs.7b10846 · Cited by 309
Microfluidic Assembly of Monodisperse Vesosomes as Artificial Cell Models
Deng, N.-N., Yelleswarapu, M., Zheng, L., & Huck, W. T. S. (2017) · Journal of the American Chemical Society · doi:10.1021/jacs.6b10977 · Cited by 268
Multiple Polymersomes for Programmed Release of Multiple Components
Kim, S.-H., Shum, H. C., Kim, J. W., Cho, J.-C., & Weitz, D. A. (2011) · Journal of the American Chemical Society · doi:10.1021/ja205687k · Cited by 250
Synthetic beta cells for fusion-mediated dynamic insulin secretion
Chen, Z., Wang, J., Sun, W., Archibong, E., Kahkoska, A. R., Zhang, X., Lu, Y., Ligler, F. S., Buse, J. B., & Gu, Z. (2018) · Nature Chemical Biology · doi:10.1038/nchembio.2511 · Cited by 248
Cited by
Yang, B., Li, C., Ren, Y., Wang, W., Zhang, X., & Han, X. (2024) · Journal of the American Chemical Society · doi:10.1021/jacs.4c06227 · Cited by 39
Strategies and applications of synthetic cell communication
Moghimianavval, H., Newell, C., Parvizian, P., Booth, M. J., & Liu, A. P. (2025) · Nature Chemical Biology · doi:10.1038/s41589-025-02002-2 · Cited by 28
“Similar to the examples mentioned above, the majority of other synthetic cell autocrine design schemes include cascades of reactions that are typically triggered by external stimuli and result in detectable fluorescent changes inside synthetic cells 60,61 .”
Programmable Enzymatic Reaction Network in Artificial Cell‐Like Polymersomes
Seo, H., & Lee, H. (2024) · Advanced Science · doi:10.1002/advs.202305760 · Cited by 23
Adaptive ATP-induced molecular condensation in membranized protocells
Mukwaya, V., Yu, X., Yang, S., Mann, S., & Dou, H. (2025) · Proceedings of the National Academy of Sciences · doi:10.1073/pnas.2419507122 · Cited by 14
Self-citationLang, X., Zou, M., Wang, K., & Zhao, H. (2026) · Journal of the American Chemical Society · doi:10.1021/jacs.5c18600 · Cited by 11
Liu, Y., Du, S., Zhang, X., Li, C., Li, S., Xu, W., Zhao, J., Mu, W., & Han, X. (2025) · Chemical Science · doi:10.1039/d5sc00852b · Cited by 6
Coacervate Vesicles as Adaptive Platforms for Synthetic Biology and Smart Materials
Vicentini, F., Battistin, F., & Gobbo, P. (2025) · Chemistry - A European Journal · doi:10.1002/chem.202502268 · Cited by 6
Construction of a De Novo Nucleotide Biosynthesis Pathway in Artificial Cells for RNA Transcription
Liu, Y., Zhang, M., Zhao, J., Ren, Y., Li, S., Wang, W., Mu, W., & Han, X. (2025) · Journal of the American Chemical Society · doi:10.1021/jacs.5c09375 · Cited by 7
Enhanced Biofilm Infiltration by Drug‐laden Coacervate for Treating Refractory Infections
Wang, R., Li, H. Y., Yi, B., Chen, S., Ling, Q., Jiang, T., Fu, H., Yang, X., Zhao, P., & Bian, L. (2026) · Advanced Materials · doi:10.1002/adma.202521500 · Cited by 5
Static and transient vacuolation in protein-based coacervates induced by charged amino acids
Li, Z., Liu, Q., Ding, H., Meng, Z., Zhao, Q., Deng, N., & Zheng, L. (2025) · Nature Communications · doi:10.1038/s41467-025-61340-w · Cited by 9
“We then examined whether vacuolated droplets could be generated by incrementally increasing the concentration of either component within the coacervates, as previously reported 44 – 47 .”
InfluentialVicentini, F., Rebasa‐Vallverdu, A., Conti, M., Zilio, S. D., Steffè, A., Briscoe, W. H., & Gobbo, P. (2025) · Journal of the American Chemical Society · doi:10.1021/jacs.5c14198 · Cited by 5
Advances in artificial cells capable of metabolic mimicry: from fundamentals to applications
Jia, Y., Zhao, J., Xu, W., Zhang, X., Li, S., & Han, X. (2026) · Chemical Society Reviews · doi:10.1039/d5cs01330e · Cited by 4
In situ synthesis within micron-sized hydrogel reactors created via programmable aerosol chemistry
Zhang, L. D., & Mehr, S. H. M. (2024) · Digital Discovery · doi:10.1039/d4dd00139g · Cited by 3
Damiano, L., Fleres, A., Roli, A., & Stano, P. (2026) · Frontiers in Robotics and AI · doi:10.3389/frobt.2025.1694338 · Cited by 2
“Coacervates are also interesting microcompartments which have shown many responsive behavior (Gobbo, 2020; Gao et al., 2021; Yin et al., 2023), as well as oil droplets do (Hanczyc and Ikegami, 2010; Parilla Gutierrez et al., 2014; Čejková et al., 2017).”
Valapra, S. S., Jaber, M. R., Ivanov, T., da Silva, L. C., & Santiago, G. M. (2026) · ChemSystemsChem · doi:10.1002/syst.202500081 · Cited by 5
Poly(ferrocenylsilane)‐Based Redox‐Active Artificial Organelles for Biomimetic Cascade Reactions
You, J., Qian, Y., Xiong, S., Zhang, P., Mukwaya, V., Levi‐Kalisman, Y., Raviv, U., & Dou, H. (2024) · Chemistry - A European Journal · doi:10.1002/chem.202401435 · Cited by 2
Photoactivated Signaling Networks using DNA‐Based Synthetic Organelles as Biomimetic Protocells
Xue, H., Qin, Y., Han, Y., Xu, S., Willner, I., Xia, F., & Huang, F. (2026) · Angewandte Chemie · doi:10.1002/ange.4889049 · Cited by 1
Pushing Structural Complexity in Protocells Toward Emergent Functionality
He, K., Wei, M., Zhu, B., & Qiao, Y. (2026) · Advanced Materials · doi:10.1002/adma.73999 · Cited by 1
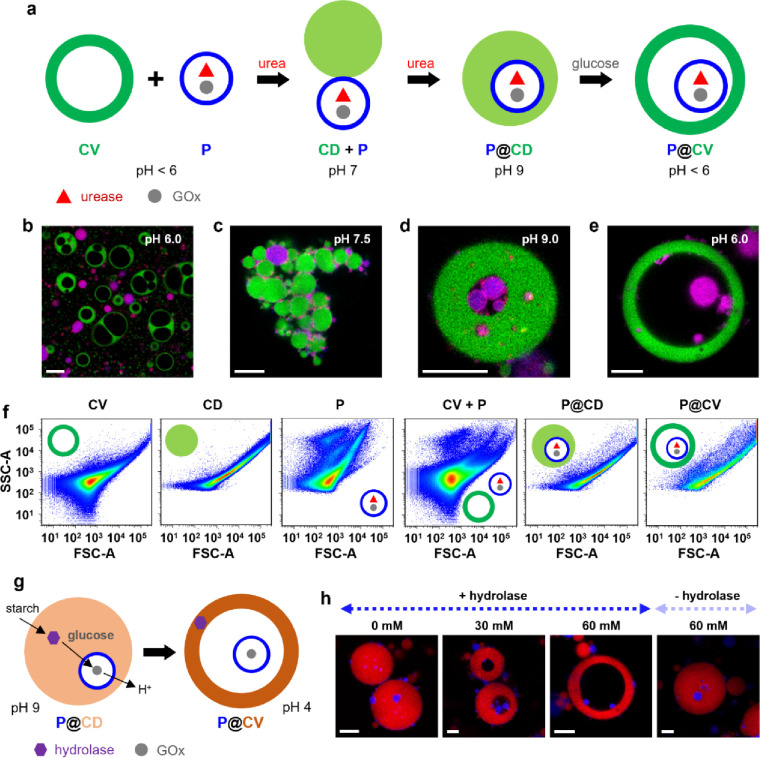
“Mann, Li and coworkers constructed urease/GOx-containing proteinosomes in reconfigurable alginate/silk fibroin coacervate vesicles through a two-step pH-oscillation process (Figure 3j ) [ 79 ].”
Viscosity Regulation of Chemically Simple Condensates
Le, N. T. K., Park, E., Kim, H., Park, J., & Kang, K. (2024) · Biomacromolecules · doi:10.1021/acs.biomac.4c00623 · Cited by 1
Micron-sized soft chemical reactors synthesized via the aerosol phasePreprint
Zhang, L. D., & Mehr, S. H. M. (2024) · ChemRxiv · doi:10.26434/chemrxiv-2024-3zqw5 · Cited by 1
Micron-sized soft chemical reactors synthesized via the aerosol phasePreprint
Zhang, L. D., & Mehr, S. H. M. (2024) · ChemRxiv · doi:10.26434/chemrxiv-2024-3zqw5-v2 · Cited by 1
Suzuki, H. (2026) · ACS Synthetic Biology · doi:10.1021/acssynbio.6c00249
Signal-induced recruitment and dispatchment in reconfigurable phase-separated protocell networks
Yin, Z., Sun, R., Li, M., & Mann, S. (2026) · Nature Chemistry · doi:10.1038/s41557-026-02225-3 · Cited by 1
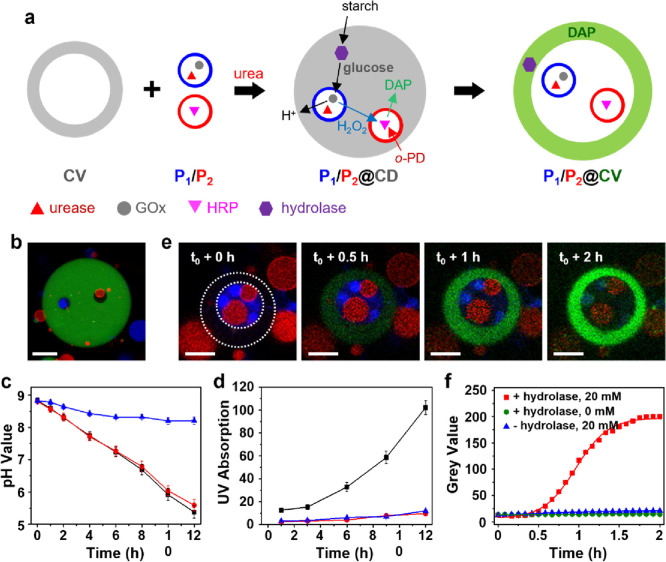
“Glucose concentrations were determined using a GOx/ HRP/ o -PD assay 10 .”
Self-citationSilica Aerogel Microcompartments with On-Demand Reactivation Enable Mimicry of Natural Resurrection
Chen, L., Sun, R., & Zhang, X. (2026) · ACS Nano · doi:10.1021/acsnano.6c08905
Coacervates: bridging protocells and drug delivery
Hu, Y., Zhou, F., Wang, X., & Jiang, H. (2026) · Trends in Chemistry · doi:10.1016/j.trechm.2026.08.010
Metadata
- Authors
- Yin, Z., Gao, N., Xu, C., Li, M., & Mann, S.
- Affiliations
- University of Bristol (GB)
- Shanghai Jiao Tong University (CN)
- Corresponding author
- Li, Mei
- Mann, Stephen
- Venue
- Journal of the American Chemical Society
- Publisher
- American Chemical Society (ACS)
- Published
- 2023-06-27
- Volume
- 145
- Issue
- 27
- Pages
- 14727-14736
- ISSN
- 0002-7863 (ISSN-L)
- 1520-5126
- PMC
- PMC10347549
- OpenAlex
- W4382318346
- Cited by
- 25
- References
- 60
- Citations by year
- 2026: 11 · 2025: 7 · 2024: 7
- FWCI
- 2.91
- Type
- journal article
- Language
- en
- Open access
- hybrid
- doi.org
- Licence
- Locations
- Journal of the American Chemical Society (publishedVersion, cc-by)
- PubMed Central (publishedVersion, cc-by)
- PubMed (publishedVersion)
- Explore Bristol Research (submittedVersion, cc-by)
- Bristol Research (University of Bristol) (submittedVersion, cc-by)
- Funders
- China Scholarship Council
- H2020 European Research Council (EC-2016-674 ADG 740235)
- Topics
- Physical Sciences › Physics and Astronomy › Astronomy and Astrophysics › Origins and Evolution of Life
- Physical Sciences › Materials Science › Biomaterials › Supramolecular Self-Assembly in Materials
- Physical Sciences › Chemistry › Organic Chemistry › Supramolecular Chemistry and Complexes
- Keywords
- protocells, endosymbiosis, urease, glucose oxidase
- MeSH terms
- Urease, Artificial Cells
About these checks
Registry, retraction, Cites and statistics results are computed, not judged, with one exception: a printed reference that no index lists is read once by a model before it counts as a citation error. Claims are extracted by a model and kept only when their quote appears verbatim in the text; each cited source is then checked, with a model’s help, for whether it says what the claim relies on. Those verdicts can be wrong — read the claim’s quote and the cited source before relying on one.
Statistics and arithmetic are recomputed, not judged.
Confidence bands are shown only for fields calibrated on our annotated test set. None is calibrated yet, so no band is shown.
What counts as a claim ›How we measure confidence ›How we check this ›
Are you an author, or do you see a problem with this page? Request a review
Data sources
Bibliographic data: Semantic Scholar, OpenAlex, Crossref.
Contains information from the Semantic Scholar Academic Graph Datasets, made available under the ODC Attribution License (ODC-BY 1.0).
Semantic Scholar’s data is described in: Kinney, R., et al. (2023). The Semantic Scholar Open Data Platform. arXiv:2301.10140.
