Cited by 2Protein Structure and DynamicsEnzyme Structure and FunctionComputational Drug Discovery Methods

The DOI matches its Crossref record; 1 of the 1 references it cites were found in a registry or an index.

WatCon: A Python Tool for Analysis of Conserved Water Networks Across Protein Families

Open access

Published version of a preprint

Abstract

Water structure is crucially important to protein function and catalysis and can be conserved throughout related proteins despite differences in sequence. The complex hydrogen-bonding networks formed by water molecules and protein residues have been studied extensively, and graph-theory-based methods have frequently been used to describe these networks. Although there exist a number of tools which can be used to track water positions and networks, corresponding methods for easily analyzing complex water network structure across related proteins are limited. To address this challenge, we present here a new tool, WatCon, an open-source Python package which can be used to analyze water positions and water network structure across protein families using both dynamic and static structural information. Importantly, WatCon can be used to classify conservation of water networks, characterize water networks across structures, and project subsequent results for easy visual interpretation. To illustrate WatCon usage, we provide five example applications illustrating WatCon analyses of static structures, dynamic trajectories, and cross-family analysis. This in turn showcases the utility of WatCon for enhancing our understanding of biochemical systems, predicting water hotspots of potential relevance to protein engineering and predicting pathogenic mutations. WatCon can be downloaded at https://github.com/kamerlinlab/WatCon and is available under the GNU General Public License v3.0.

Overview

The claims and statistics of this paper haven’t been checked yet.

Run the check — free, no account needed. It reads the open-access text and checks the sources it cites.

A few free checks a day · papers already verified open instantly · results are public

Integrity signals

Registry

Crossref · 10.1021/jacsau.5c00447

Cites

1 of 1 references verified0 citation errors · 0 not checkable

Statistics

Figures

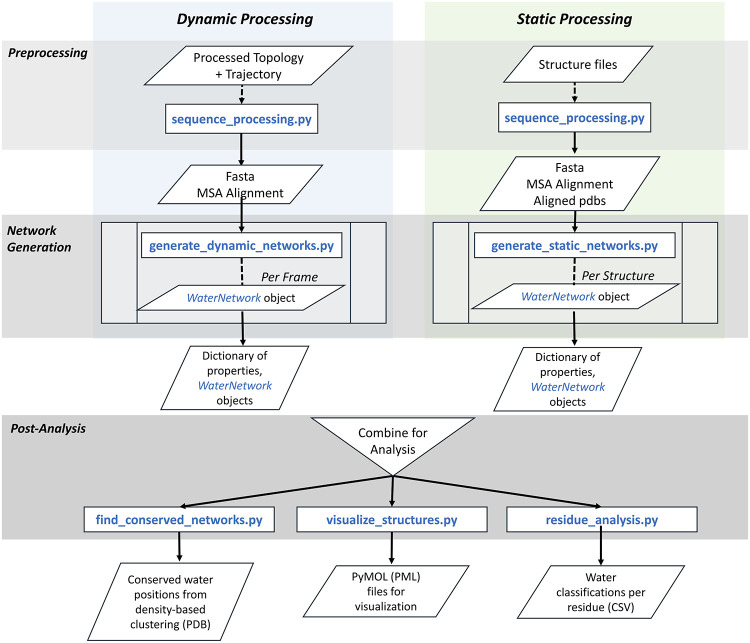
1 Schematic overview of the WatCon Python package. Note that analysis can be performed using either static structures (from e.g. X-ray crystallography), or simulation trajectories, or a mix of the two.
1 Schematic overview of the WatCon Python package. Note that analysis can be performed using either static structures (from e.g. X-ray crystallography), or simulation trajectories, or a mix of the two.CC BY · PubMed Central
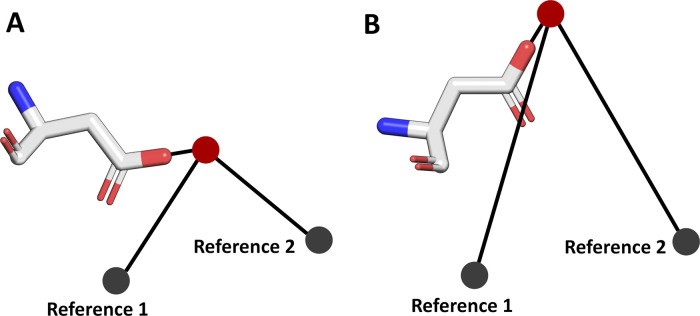
2 Visualization of how WatCon differentiates individual water–protein interactions. Two reference points are defined, and the interacting protein atom – water oxygen – reference point angles are measured. The Reference 1 and Reference 2 coordinates are set as using (0, 10, 0) and (10, 0, 10) Å by default (assuming protein structures are aligned to the same coordinate axis), but can also be adjusted to any relevant Cα atom or other coordinate description. In doing so, WatCon can effectively distinguish between (for instance) the interacting water molecules between conformations A and B of the same residue, while also taking into account conserved sequence information. This is useful for analyzing cases where an interacting residue varies within a given family but the interacting water position remains constant.
2 Visualization of how WatCon differentiates individual water–protein interactions. Two reference points are defined, and the interacting protein atom – water oxygen – reference point angles are measured. The Reference 1 and Reference 2 coordinates are set as using (0, 10, 0) and (10, 0, 10) Å by default (assuming protein structures are aligned to the same coordinate axis), but can also be adjusted to any relevant Cα atom or other coordinate description. In doing so, WatCon can effectively distinguish between (for instance) the interacting water molecules between conformations A and B of the same residue, while also taking into account conserved sequence information. This is useful for analyzing cases where an interacting residue varies within a given family but the interacting water position remains constant.CC BY · PubMed Central
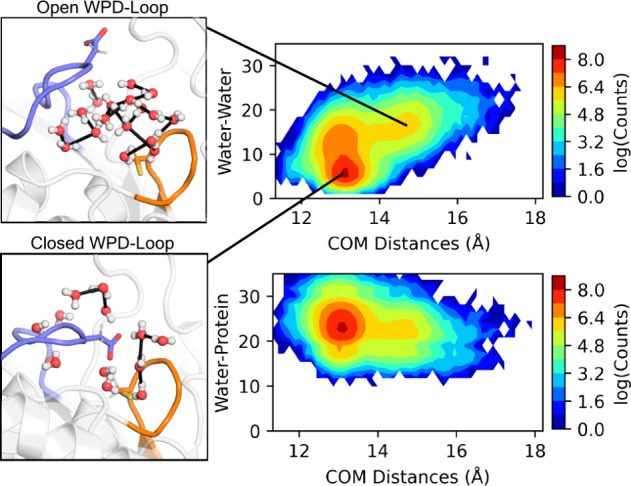
3 Comparison of center of mass (COM) distances (Å) between the P-loop and WPD-loop of PTP1B and the calculated number of water–water and water–all (combined water–water and water–protein, denoted Water–Protein) interactions across 8 × 1.5 μs simulation replicas of PTP1B, initiated from each of the WPD-loop closed and open positions (16 trajectories in total). Shown here also are representative structures of the active site water–protein interaction networks in each of the calculated minima on the water–water histogram.
3 Comparison of center of mass (COM) distances (Å) between the P-loop and WPD-loop of PTP1B and the calculated number of water–water and water–all (combined water–water and water–protein, denoted Water–Protein) interactions across 8 × 1.5 μs simulation replicas of PTP1B, initiated from each of the WPD-loop closed and open positions (16 trajectories in total). Shown here also are representative structures of the active site water–protein interaction networks in each of the calculated minima on the water–water histogram.CC BY · PubMed Central
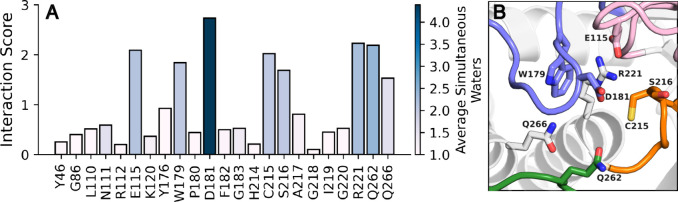
4 (A) Number of water interactions per residue during 8 × 1.5 μs simulations of PTP1B from each of the WPD-loop closed and open conformations (16 trajectories total), normalized by the total number of trajectory frames with key active site residues for PTP1B simulations. Bars are colored by the average number of (nonzero) simultaneous water molecules each residue forms interactions with, to discriminate between, for instance, transient interactions with multiple water molecules simultaneously, vs sustained interactions with a single water molecule. (B) Visualization of residues with a normalized water interaction score > 1. Of the key catalytic loops in PTPs, the WPD-loop is colored blue, the P-loop is colored orange, the E-loop is colored pink, and the Q-loop is colored green.
4 (A) Number of water interactions per residue during 8 × 1.5 μs simulations of PTP1B from each of the WPD-loop closed and open conformations (16 trajectories total), normalized by the total number of trajectory frames with key active site residues for PTP1B simulations. Bars are colored by the average number of (nonzero) simultaneous water molecules each residue forms interactions with, to discriminate between, for instance, transient interactions with multiple water molecules simultaneously, vs sustained interactions with a single water molecule. (B) Visualization of residues with a normalized water interaction score > 1. Of the key catalytic loops in PTPs, the WPD-loop is colored blue, the P-loop is colored orange, the E-loop is colored pink, and the Q-loop is colored green.CC BY · PubMed Central
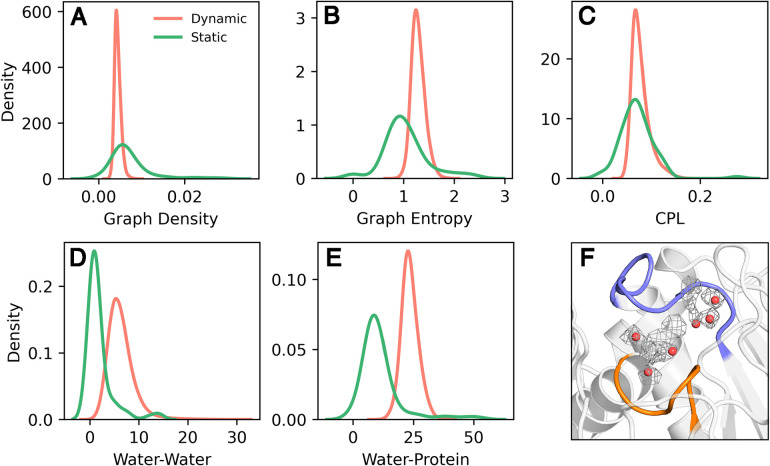
5 (A–E) Kernel density estimate (KDE) plots of calculated properties, showing a comparison between data obtained from analysis of dynamic trajectories (8 replicas × 1.5 μs simulations of PTP1B initiated from the WPD-loop closed conformation) and of static structures. Shown here are (A) the graph density, (B) graph entropy, (C) the average characteristic path length (CPL) (D) the number of water–water interactions (Water–Water), and (E) the number of water-all interactions (combined water–protein and water–water interactions, denoted Water–Protein). (F) Comparison of highest water occupancy regions obtained from analysis of molecular dynamics trajectories of PTP1B vs clustering on available crystal structures, with the WPD-loop in its catalytically closed conformation. Densities are shown in wire mesh representation, presented at an isovalue of 1.0, calculated from a 9 Å sphere and centered on the center of mass of the R221 and C215 residues, based on 8 × 1.5 μs molecular dynamics simulations of PTP1B. Static structure clusters were calculated using hdbscan clustering based on 82 closed WPD-loop structures of PTP1B (Table S1).
5 (A–E) Kernel density estimate (KDE) plots of calculated properties, showing a comparison between data obtained from analysis of dynamic trajectories (8 replicas × 1.5 μs simulations of PTP1B initiated from the WPD-loop closed conformation) and of static structures. Shown here are (A) the graph density, (B) graph entropy, (C) the average characteristic path length (CPL) (D) the number of water–water interactions (Water–Water), and (E) the number of water-all interactions (combined water–protein and water–water interactions, denoted Water–Protein). (F) Comparison of highest water occupancy regions obtained from analysis of molecular dynamics trajectories of PTP1B vs clustering on available crystal structures, with the WPD-loop in its catalytically closed conformation. Densities are shown in wire mesh representation, presented at an isovalue of 1.0, calculated from a 9 Å sphere and centered on the center of mass of the R221 and C215 residues, based on 8 × 1.5 μs molecular dynamics simulations of PTP1B. Static structure clusters were calculated using hdbscan clustering based on 82 closed WPD-loop structures of PTP1B (Table S1).CC BY · PubMed Central
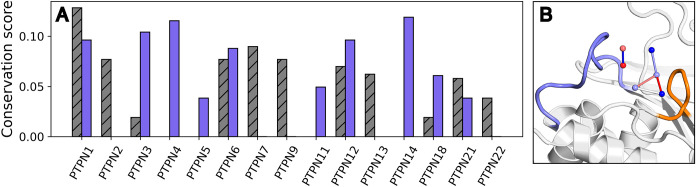
6 (A) Conservation score to PTP1B closed crystal structure summary network calculated for a set of nonreceptor PTPs using active region waters only. Purple bars correspond to structures with open WPD-loops, and gray hashed bars correspond to structures with closed WPD-loops. (B) Projection of water clusters identified for PTP1B closed crystal structures colored by conservation of particular water positions and by neighbor conservation (blue = less conserved, red = more conserved). WPD-loop is colored blue, and P-loop is colored orange.
6 (A) Conservation score to PTP1B closed crystal structure summary network calculated for a set of nonreceptor PTPs using active region waters only. Purple bars correspond to structures with open WPD-loops, and gray hashed bars correspond to structures with closed WPD-loops. (B) Projection of water clusters identified for PTP1B closed crystal structures colored by conservation of particular water positions and by neighbor conservation (blue = less conserved, red = more conserved). WPD-loop is colored blue, and P-loop is colored orange.CC BY · PubMed Central
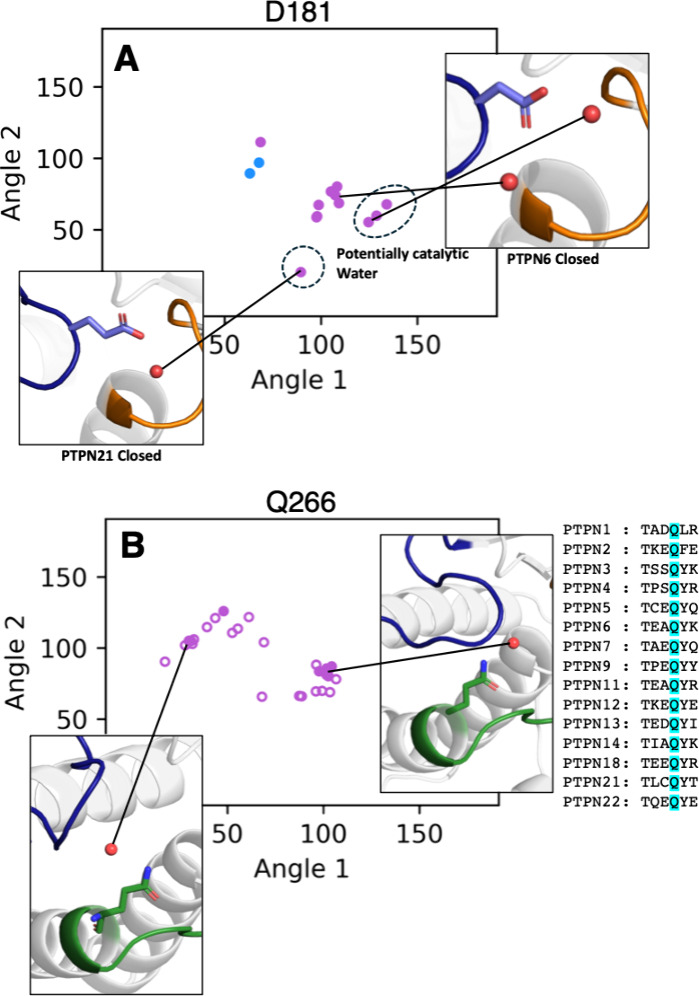
7 (A) Calculated protein–water angles for nonreceptor PTPs at D181 (general acid, PTP1B numbering). (B) Calculated protein–water angles for nonreceptor PTPs at Q266 (PTP1B numbering). Backbone interactions are shown in blue and side chain interactions shown in purple. Coordinates associated with open WPD-loop structures are shown as open circles and closed WPD-loop structures with filled circles. Angle 1 was calculated as the angle between the closest interacting protein atom of each residue, the water oxygen, and the Cα atom of residue L71. Angle 2 was calculated as the angle between the interacting protein atom, the water oxygen, and the Cα atom of residue T154.
7 (A) Calculated protein–water angles for nonreceptor PTPs at D181 (general acid, PTP1B numbering). (B) Calculated protein–water angles for nonreceptor PTPs at Q266 (PTP1B numbering). Backbone interactions are shown in blue and side chain interactions shown in purple. Coordinates associated with open WPD-loop structures are shown as open circles and closed WPD-loop structures with filled circles. Angle 1 was calculated as the angle between the closest interacting protein atom of each residue, the water oxygen, and the Cα atom of residue L71. Angle 2 was calculated as the angle between the interacting protein atom, the water oxygen, and the Cα atom of residue T154.CC BY · PubMed Central
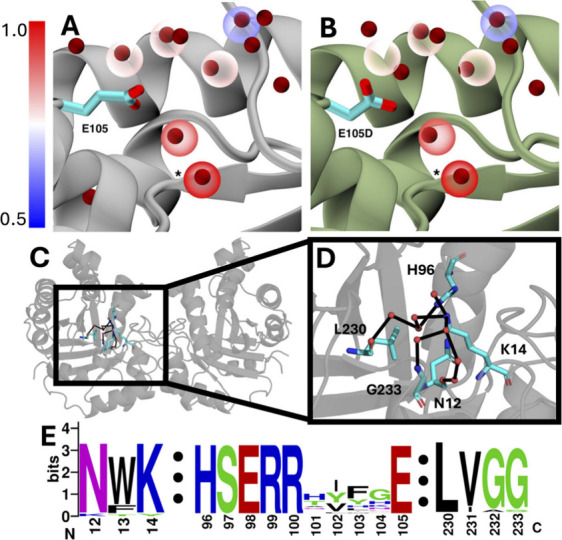
8 (A) Wild-type human TPI (PDB ID 2JK2 ) with water clusters shown in transparent spheres colored by conservation score. Structural waters are shown in dark red. WatCon identified a water cluster in TPI that was perfectly conserved between 24 organisms (conservation score = 1.0). This cluster (marked with *) is near the side chain of E105, a residue that causes to TPI deficiency when mutated to aspartate. (B) Identical water clusters shown in A, with E105D mutant TPI (PDB ID 2VOM ) aligned. This mutation causes a visible disruption of the conserved network, as described in prior work. (C) Cartoon representation of the human TPI dimer focused on the active site of chain A. (D) A WatCon calculated water network is shown connecting the side chains of N12, K14, H96, L230, and G233. Water clusters are shown as red spheres with the network connected by black edges. (E) WebLogo sequence alignment highlighting the high conservation of all residues described in (A–D). Residue indexing based on human TPI. Alignment was performed using the MUSCLE web server from EMBL-EBI.
8 (A) Wild-type human TPI (PDB ID 2JK2 ) with water clusters shown in transparent spheres colored by conservation score. Structural waters are shown in dark red. WatCon identified a water cluster in TPI that was perfectly conserved between 24 organisms (conservation score = 1.0). This cluster (marked with *) is near the side chain of E105, a residue that causes to TPI deficiency when mutated to aspartate. (B) Identical water clusters shown in A, with E105D mutant TPI (PDB ID 2VOM ) aligned. This mutation causes a visible disruption of the conserved network, as described in prior work. (C) Cartoon representation of the human TPI dimer focused on the active site of chain A. (D) A WatCon calculated water network is shown connecting the side chains of N12, K14, H96, L230, and G233. Water clusters are shown as red spheres with the network connected by black edges. (E) WebLogo sequence alignment highlighting the high conservation of all residues described in (A–D). Residue indexing based on human TPI. Alignment was performed using the MUSCLE web server from EMBL-EBI.CC BY · PubMed Central
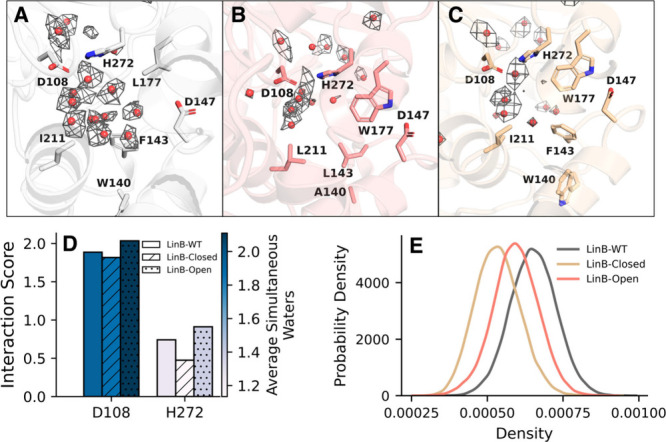
9 (A–C) Projections of water density hotspots obtained from simulations performed on the (A) WT LinB, (B) LinB-OpenW, and (C) LinB-ClosedW structures. Densities are visualized at 1.5σ, and red spheres indicate points of highest density. (D) Calculated interaction scores for catalytic residues D108 and H272. (E) Calculated graph density for each variant. Results were calculated for molecular dynamics trajectories of 3 replicas × 300 ns for each variant.
9 (A–C) Projections of water density hotspots obtained from simulations performed on the (A) WT LinB, (B) LinB-OpenW, and (C) LinB-ClosedW structures. Densities are visualized at 1.5σ, and red spheres indicate points of highest density. (D) Calculated interaction scores for catalytic residues D108 and H272. (E) Calculated graph density for each variant. Results were calculated for molecular dynamics trajectories of 3 replicas × 300 ns for each variant.CC BY · PubMed Central

Verification

Claims the paper makes

The claims and statistics of this paper haven’t been checked yet.

Run the check — free, no account needed. It reads the open-access text and checks the sources it cites.

A few free checks a day · papers already verified open instantly · results are public

Self-check

Percentages, sums and reported differences re-computed from the paper’s own numbers.

The self-check needs the paper’s full text.

Citations

Cites

Research works printed but not linked: 149

  1. 10.1021/acs.chemrev.5b00664 · DOI
  2. 10.1098/rstb.1977.0029 · DOI
  3. 10.1016/0079-6107(95)00012-7 · DOI
  4. 10.1146/annurev.bb.25.060196.000333 · DOI
  5. 10.1016/S0959-440X(97)80016-4 · DOI
  6. 10.1016/S0968-0004(02)02067-4 · DOI
  7. 10.1073/pnas.0307851100 · DOI
  8. 10.1098/rstb.2004.1504 · DOI
  9. 10.1098/rstb.2004.1498 · DOI
  10. 10.1073/pnas.0400157101 · DOI
  11. 10.1016/j.sbi.2006.03.002 · DOI
  12. 10.1016/j.bbapap.2009.11.003 · DOI
  13. 10.1371/journal.pone.0024712 · DOI
  14. 10.1002/psc.2671 · DOI
  15. 10.1016/j.bbabio.2013.09.006 · DOI
  16. 10.2174/1389203716666150227162803 · DOI
  17. 10.1038/s41598-017-09466-w · DOI
  18. 10.1038/s41467-018-05769-2 · DOI
  19. 10.1002/jmr.2810 · DOI
  20. 10.1088/1361-648X/ab388a · DOI
  21. 10.1080/07391102.2018.1453379 · DOI
  22. 10.1021/acs.biochem.1c00552 · DOI
  23. 10.1021/acs.jcim.2c01225 · DOI
  24. 10.1021/acs.jpcb.3c02970 · DOI
  25. 10.1021/acs.chemrev.1c00757 · DOI
  26. 10.2174/156802610790232288 · DOI
  27. 10.1093/bioinformatics/btv411 · DOI
  28. 10.1021/acs.jcim.7b00443 · DOI
  29. 10.1021/acs.jmedchem.7b00057 · DOI
  30. 10.1021/acs.jcim.9b00281 · DOI
  31. 10.2174/1568026622666220726114407 · DOI
  32. 10.1021/acs.jcim.1c01266 · DOI
  33. 10.1021/acs.jcim.2c00801 · DOI
  34. 10.1021/jacs.9b06275 · DOI
  35. 10.1002/anie.202112919 · DOI
  36. 10.1093/bioinformatics/btu424 · DOI
  37. 10.1093/bioinformatics/bty024 · DOI
  38. 10.1002/cmdc.201700564 · DOI
  39. 10.1007/s10822-019-00187-y · DOI
  40. 10.1021/acs.jcim.3c01559 · DOI
  41. 10.1093/bioinformatics/btae516 · DOI
  42. 10.1093/bioadv/vbae099 · DOI
  43. 10.1016/j.febslet.2007.05.021 · DOI
  44. 10.1038/msb4100129 · DOI
  45. 10.1016/j.sbi.2024.102922 · DOI
  46. 10.3389/fchem.2022.1075648 · DOI
  47. 10.1021/acs.jcim.3c00567 · DOI
  48. 10.1101/2024.11.18.624208 · DOI
  49. 10.1002/pro.4911 · DOI
  50. 10.3389/fmolb.2018.00088 · DOI
  51. Van Rossum G., 2009, Python 3 Reference Manual
  52. 10.1002/jcc.21787 · DOI
  53. Gowers, R.; Linke, M.; Barnoud, J.; Reddy, T.; Melo, M.; Seyler, S.; Domanski, J.; Dotson, D.; Buchoux, S.; Kenney, I.; MDAnalysis: A Python Package for the Rapid Analysis of Molecular Dynamics Simulations. In Proceedings of the 15th Python in Science Conference ; SciPy.org, 2016.10.25080/Majora-629e541a-00e. · DOI
  54. 10.1002/cpbi.3 · DOI
  55. Hagberg, A. A.; Schult, D. A.; Swart, P. J. Exploring Network Structure, Dynamics and Function Using NetworkX. In Proceedings of the 7th Python in Science Conference ; SciPy.org, 2008.10.25080/TCWV9851. · DOI · Paper page
  56. 10.1038/s41586-020-2649-2 · DOI · Paper page
  57. 2020, pandas-dev/pandas: Pandas
  58. Pedregosa F., 2011, J. Mach. Learn. Res., 12, 2825
  59. 10.1038/s41592-019-0686-2 · DOI · Paper page
  60. Ester, M.; Kriegel, H.P.; Sander, J.; Xu, X. A Density-Based Algorithm for Discovering Clusters in Large Spatial Databases with Noise. In KDD’96: Proceedings of the Second International Conference on Knowledge Discovery and Data Mining ; AAAI Press, 1996; pp 226–231.
  61. 10.21105/joss.00205 · DOI · Paper page
  62. 10.1145/304181.304187 · DOI
  63. 10.1093/nar/28.1.235 · DOI · Paper page
  64. 10.1038/msb.2011.75 · DOI
  65. 10.1007/BF00134183 · DOI
  66. 10.1021/acs.jctc.9b00697 · DOI
  67. 10.1093/comnet/cnad001 · DOI
  68. 10.1088/1478-3975/4/4/L01 · DOI
  69. 10.1007/s41109-021-00427-x · DOI
  70. 10.1093/intimm/12.7.949 · DOI
  71. 10.1021/jacs.3c01412 · DOI
  72. 10.1063/1.1780152 · DOI
  73. 10.1093/protein/gzp069 · DOI
  74. 10.1021/jacs.9b05311 · DOI
  75. 10.1038/s42003-021-01847-2 · DOI
  76. 10.1101/2022.05.12.491708 · DOI
  77. 10.1016/j.bpj.2015.08.015 · DOI
  78. 10.1016/S1074-5521(96)90164-7 · DOI
  79. 10.1016/j.cbpa.2014.03.001 · DOI
  80. 10.1002/iub.2716 · DOI
  81. 10.1016/S0014-5793(03)00603-3 · DOI
  82. 10.1021/jacs.9b04470 · DOI
  83. 10.1046/j.1432-1327.1999.00090.x · DOI
  84. 10.1126/sciadv.abo5546 · DOI
  85. 10.1146/annurev-physchem-050317-020915 · DOI
  86. 10.1074/jbc.M109.066951 · DOI
  87. 10.1038/srep05095 · DOI
  88. 10.1021/acs.biochem.6b01025 · DOI · Paper page
  89. 10.1016/j.biocel.2014.10.004 · DOI
  90. 10.1021/jacs.0c11806 · DOI
  91. 10.1039/C9RA09601A · DOI
  92. 10.1107/S0907444998012086 · DOI
  93. 10.1107/S0907444904015094 · DOI
  94. 10.1073/pnas.91.5.1624 · DOI
  95. 10.1111/j.1742-4658.2008.06251.x · DOI
  96. 10.1111/febs.13748 · DOI
  97. 10.1016/j.cell.2008.11.038 · DOI
  98. 10.1021/ja308212y · DOI
  99. 10.1016/j.bmcl.2005.12.051 · DOI
  100. 10.15252/embr.202052141 · DOI
  101. 10.1016/j.str.2015.01.017 · DOI
  102. 10.1042/bj1220285 · DOI
  103. 10.1016/S0014-5793(01)02236-0 · DOI
  104. 10.1007/s00018-010-0473-9 · DOI
  105. 10.1016/j.sbi.2010.09.005 · DOI
  106. 10.1186/s10020-023-00612-x · DOI
  107. 10.1053/beha.2000.0061 · DOI
  108. 10.1080/15216540601115960 · DOI
  109. 10.1002/cbdv.202000012 · DOI
  110. 10.3390/molecules28166163 · DOI
  111. 10.1021/ar50112a001 · DOI
  112. 10.1021/acs.biochem.6b00311 · DOI
  113. 10.1021/jacs.7b05576 · DOI
  114. 10.1159/000528192 · DOI
  115. 10.1074/jbc.M802145200 · DOI
  116. 10.1101/gr.849004 · DOI
  117. 10.1093/nar/gkh340 · DOI · Paper page
  118. 10.1093/nar/gkae241 · DOI
  119. 10.1002/pro.5560030510 · DOI
  120. 10.1021/jacs.9b08713 · DOI
  121. 10.1093/mp/sst139 · DOI
  122. 10.1039/C5CP01599E · DOI
  123. 10.1021/acs.jctc.9b01010 · DOI
  124. 10.1002/prot.24772 · DOI
  125. 10.1016/j.biotechadv.2019.04.008 · DOI
  126. 10.1002/med.21430 · DOI
  127. 10.1002/biot.201100486 · DOI
  128. 10.1186/1471-2105-7-316 · DOI
  129. 10.1074/jbc.M306762200 · DOI
  130. 10.1128/AEM.69.4.2349-2355.2003 · DOI
  131. 10.1016/j.cbpa.2004.02.012 · DOI
  132. 10.1021/bi047912o · DOI
  133. 10.1007/s10822-006-9071-1 · DOI
  134. 10.1038/nchembio.205 · DOI
  135. 10.1042/BJ20101405 · DOI
  136. 10.1074/jbc.M112.377853 · DOI
  137. 10.1128/JB.02020-12 · DOI
  138. 10.1002/cbic.201200733 · DOI
  139. 10.3390/ijms222111992 · DOI
  140. 10.1021/acscatal.6b02081 · DOI
  141. 10.1371/journal.pone.0280776 · DOI
  142. 10.1007/s00203-024-04105-1 · DOI
  143. 10.1021/jacs.4c15551 · DOI
  144. 10.1093/bioinformatics/btx125 · DOI
  145. 10.1021/acs.jcim.4c01177 · DOI
  146. 10.1021/bi034748g · DOI
  147. 10.1371/journal.pcbi.1002708 · DOI
  148. 10.1093/bioinformatics/btz946 · DOI
  149. 10.1021/acs.jchemed.4c00793 · DOI

Metadata

Authors
Brownless, A.-L. R., Harrison-Rawn, T., & Kamerlin, S. C. L.
Affiliations
Georgia Institute of Technology (US)
Corresponding author
Kamerlin, Shina C. L.
Venue
JACS Au
Published
2025-11-20
Volume
5
Issue
12
Pages
6379-6395
ISSN
2691-3704 (ISSN-L)
OpenAlex
W4416394720
Cited by
2
References
1
Citations by year
2026: 2
FWCI
0.60
Type
journal article
Language
en
Open access
Locations
  • JACS Au (publishedVersion, cc-by)
  • ChemRxiv (acceptedVersion, cc-by)
  • PubMed (publishedVersion)
  • PubMed Central (publishedVersion, cc-by)
  • DOAJ (DOAJ: Directory of Open Access Journals) (submittedVersion, cc-by-sa)
  • Lund University Publications (Lund University) (submittedVersion)
Funders
  • Vetenskapsrådet (2022-06725)
  • Georgia Research Alliance
  • Vasser Woolley Foundation
Topics
  • Life Sciences › Biochemistry, Genetics and Molecular Biology › Molecular Biology › Protein Structure and Dynamics
  • Life Sciences › Biochemistry, Genetics and Molecular Biology › Structural Biology › Enzyme Structure and Function
  • Life Sciences › Pharmacology, Toxicology and Pharmaceutics › Drug Discovery › Computational Drug Discovery Methods
Keywords
hydrogen bond network, protein families, graph theory, protein dynamics, protein engineering, pathogenic variants, open-source Python package

About these checks

Registry, retraction, Cites and statistics results are computed, not judged, with one exception: a printed reference that no index lists is read once by a model before it counts as a citation error. Claims are extracted by a model and kept only when their quote appears verbatim in the text; each cited source is then checked, with a model’s help, for whether it says what the claim relies on. Those verdicts can be wrong — read the claim’s quote and the cited source before relying on one.

Statistics and arithmetic are recomputed, not judged.

Confidence bands are shown only for fields calibrated on our annotated test set. None is calibrated yet, so no band is shown.

What counts as a claim ›How we measure confidence ›How we check this ›

Are you an author, or do you see a problem with this page? Request a review