

The DOI matches its Crossref record; 44 of the 44 references it cites were found in a registry or an index.
K+ regulates Ca2+ to drive inflammasome signaling: dynamic visualization of ion flux in live cells
Open accessAbstract
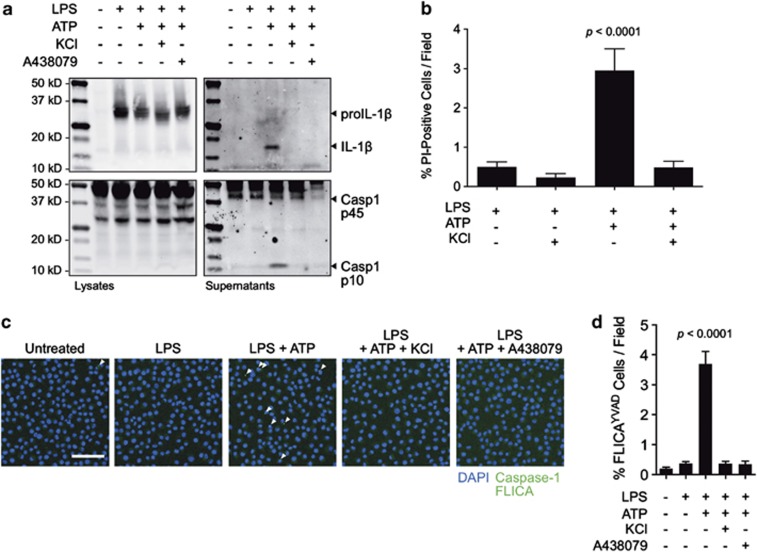
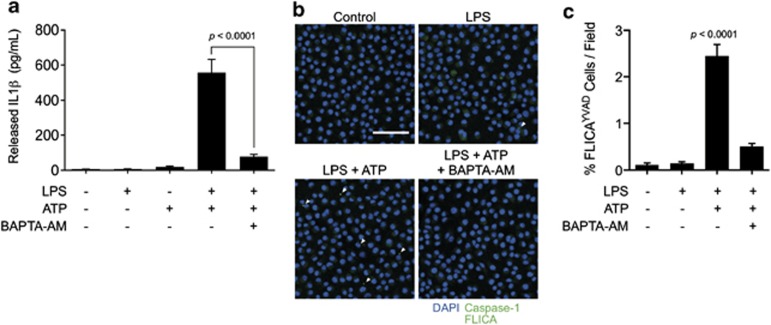
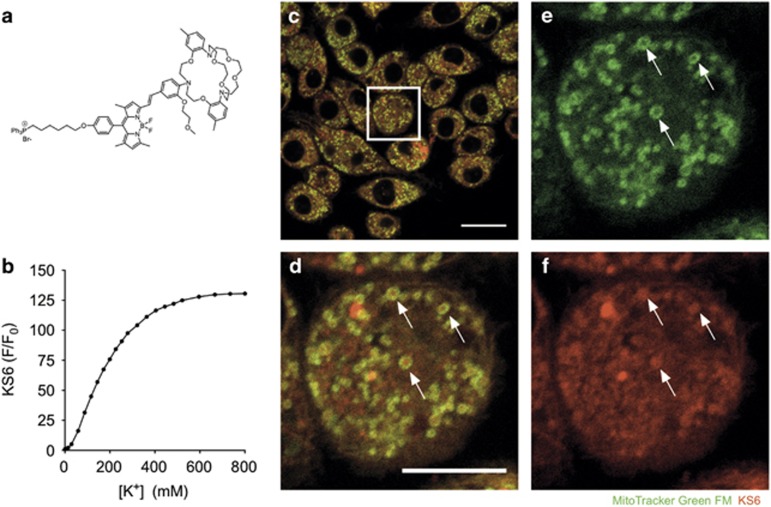
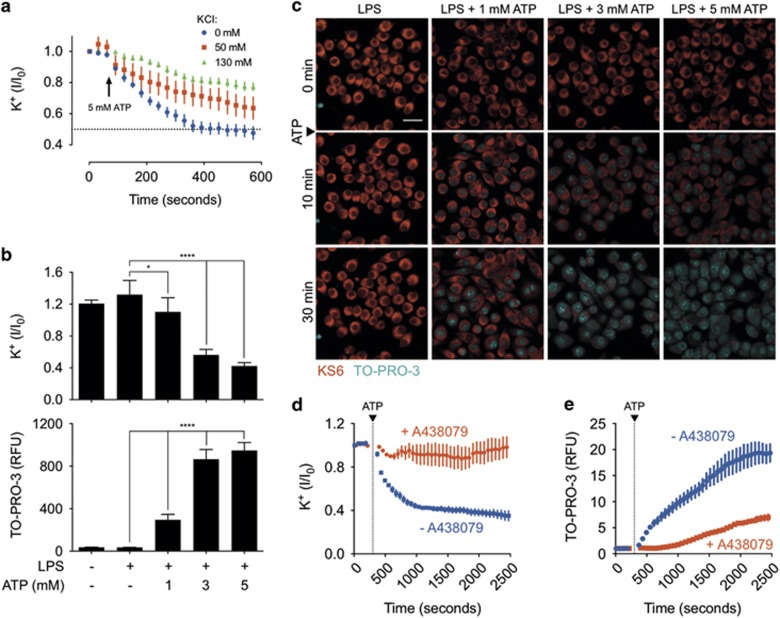
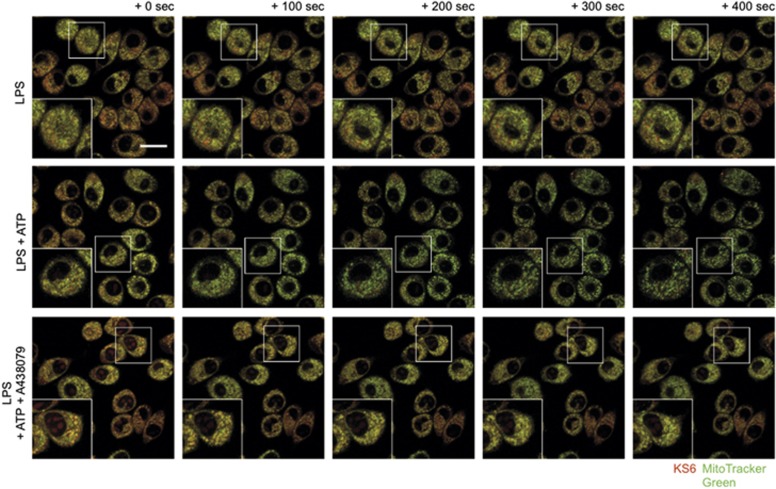
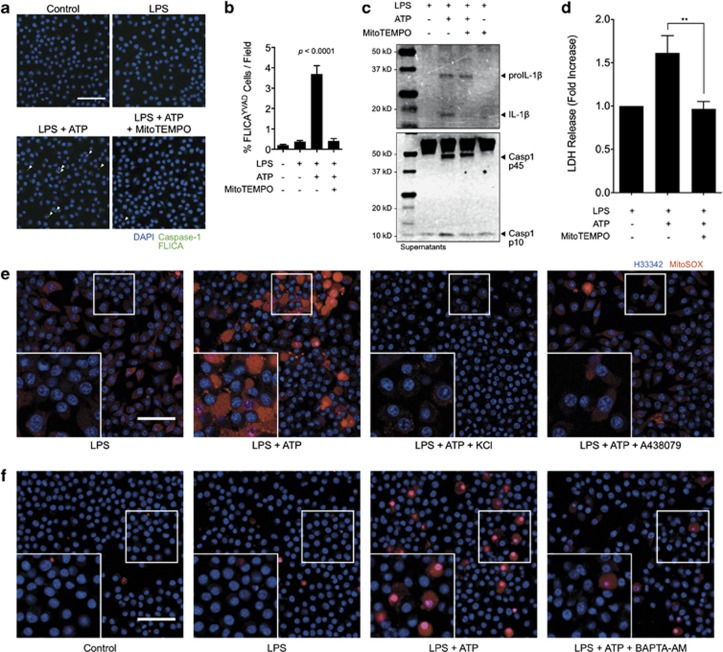
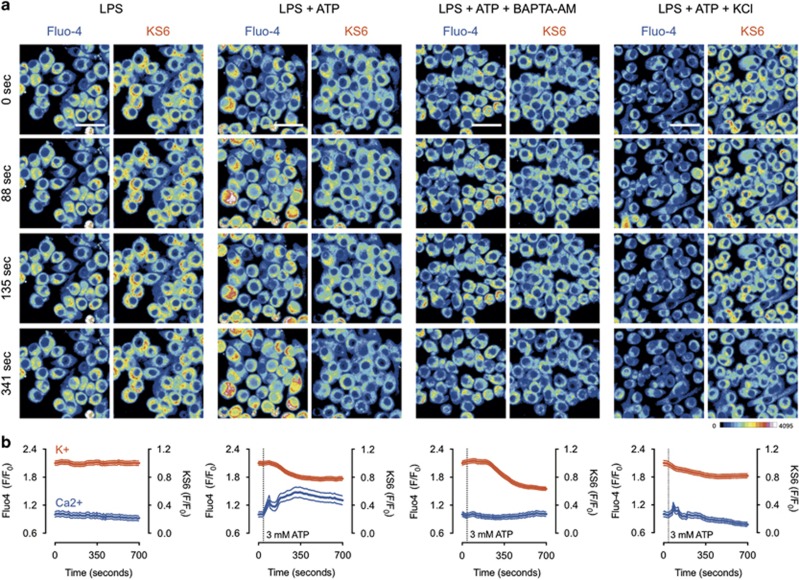
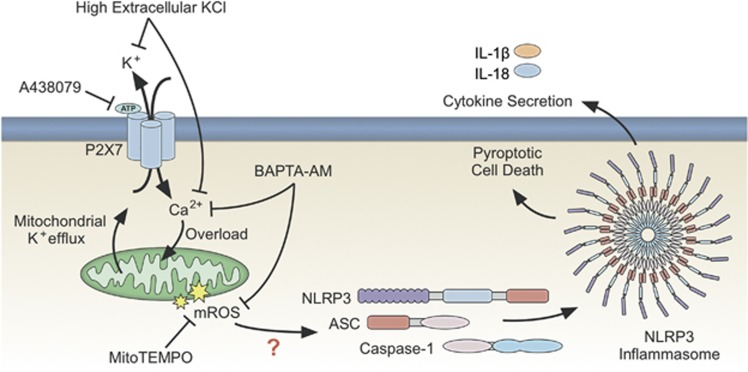
P2X7 purinergic receptor engagement with extracellular ATP induces transmembrane potassium and calcium flux resulting in assembly of the NLRP3 inflammasome in LPS-primed macrophages. The role of potassium and calcium in inflammasome regulation is not well understood, largely due to limitations in existing methods for interrogating potassium in real time. The use of KS6, a novel sensor for selective and sensitive dynamic visualization of intracellular potassium flux in live cells, multiplexed with the intracellular calcium sensor Fluo-4, revealed a coordinated relationship between potassium and calcium. Interestingly, the mitochondrial potassium pool was mobilized in a P2X7 signaling, and ATP dose-dependent manner, suggesting a role for mitochondrial sensing of cytosolic ion perturbation. Through treatment with extracellular potassium we found that potassium efflux was necessary to permit sustained calcium entry, but not transient calcium flux from intracellular stores. Further, intracellular calcium chelation with BAPTA-AM indicated that P2X7-induced potassium depletion was independent of calcium mobilization. This evidence suggests that both potassium efflux and calcium influx are necessary for mitochondrial reactive oxygen generation upstream of NLRP3 inflammasome assembly and pyroptotic cell death. We propose a model wherein potassium efflux is necessary for calcium influx, resulting in mitochondrial reactive oxygen generation to trigger the NLRP3 inflammasome.
Overview
The claims and statistics of this paper haven’t been checked yet.
Run the check — free, no account needed. It reads the open-access text and checks the sources it cites.
Integrity signals
Registry
Cites
Statistics
Figures
Verification
Claims the paper makes
The claims and statistics of this paper haven’t been checked yet.
Run the check — free, no account needed. It reads the open-access text and checks the sources it cites.
Claims other papers make about this one
Each is checked against this paper’s own text: does it say what the citing paper says it does?
In the citing paper
“this has been shown to elicit activation of the NLRP3 inflammasome in LPS-stimulated macrophages, which causes secretion of IL-18 (but also of the pro-inflammatory cytokine IL-1β) and may thus promote maintenance and function of the epithelial barrier (Mariathasan et al., 2006; Sutterwala et al., 2014; 2006; Yaron et al., 2015).”
From Understanding the Holobiont: How Microbial Metabolites Affect Human Health and Shape the Immune System (2017) · cites this paper as Yaron et al., 2015
Self-check
Percentages, sums and reported differences re-computed from the paper’s own numbers.
The self-check needs the paper’s full text.
Citations
Cites
Fiji: an open-source platform for biological-image analysis
Schindelin, J., Arganda-Carreras, I., Frise, E., Kaynig, V., Longair, M., Pietzsch, T., Preibisch, S., Rueden, C., Saalfeld, S., Schmid, B., et al. (2012) · Nature Methods · doi:10.1038/nmeth.2019 · Cited by 66,890
A role for mitochondria in nlrp3 inflammasome activation
Zhou, R., Yazdi, A. S., Menu, P., & Tschopp, J. (2011) · Nature · doi:10.1038/nature09663 · Cited by 5,602
Gout-associated uric acid crystals activate the NALP3 inflammasome
Martinon, F., Pétrilli, V., Mayor, A., Tardivel, A., & Tschopp, J. (2006) · Nature · doi:10.1038/nature04516 · Cited by 5,326
Cryopyrin activates the inflammasome in response to toxins and ATP
Mariathasan, S., Weiss, D. S., Newton, K., McBride, J., O'Rourke, K., Roose-Girma, M., Lee, W. P., Weinrauch, Y., Monack, D. M., & Dixit, V. M. (2006) · Nature · doi:10.1038/nature04515 · Cited by 3,080
Thioredoxin-interacting protein links oxidative stress to inflammasome activation
Zhou, R., Tardivel, A., Thorens, B., Choi, I., & Tschopp, J. (2010) · Nature Immunology · doi:10.1038/ni.1831 · Cited by 2,708 · cited 3×
“Mitochondrial dysfunction and loss of mitochondrial membrane potential lead to a rapid increase in mROS production, which has been described to activate the inflammasome through the activity of thioredoxin-interacting protein (TXNIP).(16) In support of this mechanism, most known NLRP3-activating stimuli induce ROS gen…”
BackgroundMuñoz-Planillo, R., Kuffa, P., Martínez-Colón, G. J., Smith, B. L., Rajendiran, T. M., & Núñez, G. (2013) · Immunity · doi:10.1016/j.immuni.2013.05.016 · Cited by 2,167
Activation of the NALP3 inflammasome is triggered by low intracellular potassium concentration
Pétrilli, V, Papin, S., Dostert, C., Mayor, A., Martinon, F., & Tschopp, J. (2007) · Cell Death & Differentiation · doi:10.1038/sj.cdd.4402195 · Cited by 1,445 · cited 3×
“Despite the proposed link between potassium efflux and mitochondrial signaling resulting in inflammasome assembly, this association had yet to be observed.(1,18,19,27) Further, there has been limited evidence regarding the relationship between calcium and potassium.”
BackgroundMethodThe calcium-sensing receptor regulates the NLRP3 inflammasome through Ca2+ and cAMP
Lee, G., Subramanian, N., Kim, A. I., Aksentijevich, I. A., Goldbach‐Mansky, R. T., Sacks, D. B., Germain, R. N., Kastner, D. L., & Chae, J. J. (2012) · Nature · doi:10.1038/nature11588 · Cited by 1,077 · cited 1×
“A previous study has shown that intracellular calcium chelation with BAPTA-AM suppresses IL-1β processing and release upon ATP-induced inflammasome activation.(14) In agreement with this observation, we found that BAPTAAM significantly suppressed ATP-induced IL-1β processing and release as indicated by ELISA in J774A.”
Critical role for calcium mobilization in activation of the NLRP3 inflammasome
Murakami, T., Öckinger, J., Yu, J., Byles, V., McColl, A., Hofer, A. M., & Horng, T. (2012) · Proceedings of the National Academy of Sciences · doi:10.1073/pnas.1117765109 · Cited by 961 · cited 1×
“calcium response is indicative of the kinetics associated with rapid, endoplasmic reticulum-stored calcium ahead of plasma membrane-localized calcium entry from the extracellular environment.(26) Importantly, potassium flux occurred concurrently with the second phase of calcium influx, but was stable through the initi…”
BackgroundSyk kinase signalling couples to the Nlrp3 inflammasome for anti-fungal host defence
Groß, O., Poeck, H., Bscheider, M., Dostert, C., Hannesschläger, N., Endres, S., Hartmann, G., Tardivel, A., Schweighoffer, E., Tybulewicz, V. L. J., et al. (2009) · Nature · doi:10.1038/nature07965 · Cited by 947
Perregaux, D. G., & Gabel, C. A. (1994) · Journal of Biological Chemistry · doi:10.1016/s0021-9258(17)36591-2 · Cited by 775
Mechanism of NLRP3 inflammasome activation
Sutterwala, F. S., Haasken, S., & Cassel, S. L. (2014) · Annals of the New York Academy of Sciences · doi:10.1111/nyas.12458 · Cited by 736 · cited 5×
“Proposed mechanisms for regulating the activation of the NLRP3 inflammasome pathway are varied and controversial.(1) Among the most popular proposed mechanisms is the flux of cellular ions.”
BackgroundInfluentialCutting Edge: Inflammasome Activation by Alum and Alum’s Adjuvant Effect Are Mediated by NLRP3
Li, H., Willingham, S. B., Ting, J. P. ‐., & Re, F. (2008) · The Journal of Immunology · doi:10.4049/jimmunol.181.1.17 · Cited by 674
Fluorescent indicators for cytosolic sodium
Minta, A., & Tsien, R. Y. (1989) · Journal of Biological Chemistry · doi:10.1016/s0021-9258(19)47321-3 · Cited by 662 · cited 1×
“to sodium ions as it does to potassium ions, which makes its readout difficult to interpret.(32) Further, PBFI has a Kd of o10mM and its response saturates at approximately 50mM,”
BackgroundSignaling by ROS drives inflammasome activation
Martinon, F. (2010) · European Journal of Immunology · doi:10.1002/eji.200940168 · Cited by 604 · cited 1×
“Despite the proposed link between potassium efflux and mitochondrial signaling resulting in inflammasome assembly, this association had yet to be observed.(1,18,19,27) Further, there has been limited evidence regarding the relationship between calcium and potassium.”
BackgroundHeid, M. E., Keyel, P. A., Kamga, C., Shiva, S., Watkins, S. C., & Salter, R. D. (2013) · The Journal of Immunology · doi:10.4049/jimmunol.1301490 · Cited by 570 · cited 5×
“Previous studies have shown that MitoTEMPO is effective in inhibiting pyroptosis and release of IL-1β.17 Here, we show that the assembly of the inflammasome speck, as indicated by FLICA labeling for caspase-1, is strongly inhibited in the presence of MitoTEMPO (Figures 6a and b).”
BackgroundInfluentialYazdi, A. S., Guarda, G., Riteau, N., Drexler, S. K., Tardivel, A., Couillin, I., & Tschopp, J. (2010) · Proceedings of the National Academy of Sciences · doi:10.1073/pnas.1008155107 · Cited by 525
Changes in axon fluorescence during activity: Molecular probes of membrane potential
Cohen, L. B., Salzberg, B. M., Davila, H. V., Ross, W. N., Landowne, D., Waggoner, A. S., & Wang, C. H. (1974) · The Journal of Membrane Biology · doi:10.1007/bf01869968 · Cited by 455 · cited 1×
“stock KS6 was combined 1:1 with 10% Pluronic F127 and mixed thoroughly by pipetting before loading.(42) The mixture was added 1:100 to each well of a chamber slide for a final KS6 concentration of 5 μM and incubated for 30–60 min at 37 °C.”
MethodHara, H., Tsuchiya, K., Kawamura, I., Fang, R., Hernández-Cuellar, E., Shen, Y., Mizuguchi, J., Schweighoffer, E., Tybulewicz, V. L. J., & Mitsuyama, M. (2013) · Nature Immunology · doi:10.1038/ni.2749 · Cited by 394
Mitochondrial potassium transport: the K+ cycle
Garlid, K. D., & Paucek, P. (2003) · Biochimica et Biophysica Acta (BBA) - Bioenergetics · doi:10.1016/s0005-2728(03)00108-7 · Cited by 365
Franchi, L., Kanneganti, T.-D., Dubyak, G. R., & Núñez, G. (2007) · Journal of Biological Chemistry · doi:10.1074/jbc.m610762200 · Cited by 356 · cited 2×
“Detection of extracellular ATP by the P2X7 purinergic receptor is a prototypical stimulus for NLRP3 inflammasome activation.(10,28) Potassium efflux and ROS generation have independently been proposed as downstream effects of P2X7 activation.”
BackgroundMethodRNA viruses promote activation of the NLRP3 inflammasome through a RIP1-RIP3-DRP1 signaling pathway
Wang, X., Jiang, W., Yan, Y., Gong, T., Han, J., Tian, Z., & Zhou, R. (2014) · Nature Immunology · doi:10.1038/ni.3015 · Cited by 323
Mitochondria: Sovereign of inflammation?
Tschopp, J. (2011) · European Journal of Immunology · doi:10.1002/eji.201141436 · Cited by 303 · cited 2×
“Despite the proposed link between potassium efflux and mitochondrial signaling resulting in inflammasome assembly, this association had yet to be observed.(1,18,19,27) Further, there has been limited evidence regarding the relationship between calcium and potassium.”
BackgroundCalcium signaling and mitochondrial destabilization in the triggering of the NLRP3 inflammasome
Horng, T. (2014) · Trends in Immunology · doi:10.1016/j.it.2014.02.007 · Cited by 284 · cited 3×
“However, it is currently not known how or whether the two ions relate to each other in the context of inflammasome regulation.(1,12) In addition to ion flux, mitochondrial reactive oxygen species (mROS) signaling has been proposed as a critical regulator of NLRP3 activation.”
BackgroundK+ Efflux Agonists Induce NLRP3 Inflammasome Activation Independently of Ca2+ Signaling
Katsnelson, M. J., Rucker, L. G., Russo, H. M., & Dubyak, G. (2015) · The Journal of Immunology · doi:10.4049/jimmunol.1402658 · Cited by 278 · cited 5×
“We propose that rapidly activating intermediates such as TXNIPor Syk may be appropriate targets for providing this link based on the association between both of these targets and mitochondrial ROS in the NLRP3 inflammasome signaling pathway.6,12,16,38,39 Recently, a study was published by Katsnelson et al.40 reporting…”
BackgroundInfluentialVirgilio, F. D., Chiozzi, P., Falzoni, S., Ferrari, D., Sanz, J. M., Venketaraman, V., & Baricordi, O. R. (1998) · Cell Death and Differentiation · doi:10.1038/sj.cdd.4400341 · Cited by 278 · cited 1×
“P2X7 is expressed on the plasma membrane and its sensing activity is therefore localized distally to mitochondrial responses.(34) We propose that mitochondria mobilize their potassium pool as a response to changes in cytosolic potassium levels, which is directly responsive to P2X7 activity.”
BackgroundPotassium‐inhibited processing of IL‐1 beta in human monocytes.
Walev, I., Reske, K., Palmer, M., Valeva, A., & Bhakdi, S. C. (1995) · The EMBO Journal · doi:10.1002/j.1460-2075.1995.tb07149.x · Cited by 278 · cited 1×
“Indeed, it has been understood for over two decades that potassium flux regulates the processing of interleukin (IL)-1β, a downstream effect of inflammasome activation.(10,11) While potassium is the most commonly studied ion posited to regulate the NLRP3 pathway, calcium flux has gained popularity in recent years beca…”
BackgroundNelson, D. W., Gregg, R. J., Kort, M. E., Perez‐Medrano, A., Voight, E. A., Wang, Y., Grayson, G. K., Namovic, M. T., Donnelly‐Roberts, D. L., Niforatos, W., et al. (2006) · Journal of Medicinal Chemistry · doi:10.1021/jm051202e · Cited by 235
Erratum to “NF- κ B Signaling in the Brain of Autistic Subjects”
Malik, M. N., Cao, F., Tauqeer, Z., Sheikh, A. M., Wen, G. Y., Nagori, A., Yang, K., Brown, W. T., & Li, X. (2013) · Mediators of Inflammation · doi:10.1155/2013/691975 · Cited by 185
The P2X7 Receptor Channel Pore Dilates under Physiological Ion Conditions
Yan, Z., Li, S., Liang, Z., Tomić, M., & Stojilković, S. S. (2008) · The Journal of General Physiology · doi:10.1085/jgp.200810059 · Cited by 164 · cited 1×
“P2X7 engagement results in the opening of a non-specific cation pore and potassium efflux down the intracellular–extracellular potassium concentration gradient.(23) We probed this response by demonstrating a livecell titration between normal (130mM) and intermediate (50mM) concentrations of extracellular potassium add…”
BackgroundSingle-Cell Imaging of Caspase-1 Dynamics Reveals an All-or-None Inflammasome Signaling Response
Liu, T., Yamaguchi, Y., Shirasaki, Y., Shikada, K., Yamagishi, M., Hoshino, K., Kaisho, T., Takemoto, K., Suzuki, T., Kuranaga, E., et al. (2014) · Cell Reports · doi:10.1016/j.celrep.2014.07.012 · Cited by 156 · cited 1×
“single cell analysis that IL-1β was released in a bursting manner only from cells dying by pyroptosis.(29) This opposes”
BackgroundIon homeostasis, channels, and transporters: an update on cellular mechanisms
Dubyak, G. (2004) · AJP Advances in Physiology Education · doi:10.1152/advan.00046.2004 · Cited by 153 · cited 3×
“The asymmetric distribution of ions in cellular compartments establishes a gradient such that, under conditions of membrane permeability, ions rapidly diffuse across the gradient without energy input.(8) Cells benefit from asymmetric ion distribution by using it to affect rapid processes such as neuronal action potent…”
BackgroundInfluentialLin, Y., Huang, D.-Y., Wang, J.-S., Lin, Y., Hsieh, S.-L. E., Huang, K., & Lin, W. (2015) · Journal of Leukocyte Biology · doi:10.1189/jlb.3hi0814-371rr · Cited by 148
The secretion of IL-1β and options for release
Piccioli, P., & Rubartelli, A. (2013) · Seminars in Immunology · doi:10.1016/j.smim.2013.10.007 · Cited by 142 · cited 1×
“the long-standing paradigm of secretion by various controversial pathways.(30) This observation highlights the importance”
BackgroundBergsbaken, T., Fink, S. L., den Hartigh, A. B., Loomis, W. P., & Cookson, B. T. (2011) · The Journal of Immunology · doi:10.4049/jimmunol.1100477 · Cited by 138
Experimental Characterization and Mathematical Modeling of P2X7 Receptor Channel Gating
Yan, Z., Khadra, A., Li, S., Tomić, M., Sherman, A., & Stojilković, S. S. (2010) · Journal of Neuroscience · doi:10.1523/jneurosci.2390-10.2010 · Cited by 131 · cited 1×
“P2X7 has multiple ATP-sensing sites that have been shown to dose dependently affect the level of pore dilation permissive to ion flux.(36) It is still not well understood how mitochondria respond to cytosolic potassium, but we speculate that this may occur either through mitochondrial potassium channels or transient l…”
BackgroundZinc depletion regulates the processing and secretion of IL-1β
Summersgill, H. R., England, H., López‐Castejón, G., Lawrence, C. B., Luheshi, N., Pahle, J., Mendes, P., & Brough, D. (2014) · Cell Death and Disease · doi:10.1038/cddis.2013.547 · Cited by 112 · cited 1×
“This mechanism of inhibition would be contrary to the previously described promotion, not inhibition, of inflammasome assembly due to zinc ion chelation.(41) This study establishes a previously unknown relationship between potassium and calcium during purinergic receptordependent activation of the NLRP3 inflammasome.”
BackgroundThe Role of Potassium in Inflammasome Activation by Bacteria
Arlehamn, C. S. L., Pétrilli, V., Groß, O., Tschopp, J., & Evans, T. J. (2010) · Journal of Biological Chemistry · doi:10.1074/jbc.m109.067298 · Cited by 101 · cited 2×
“To date, Arlehamn et al.31 have reported the only live-cell imaging experiments on potassium in macrophages stimulated to undergo inflammasome assembly by infection with Pseudomonas.”
BackgroundBartlett, R., Yerbury, J. J., & Sluyter, R. (2013) · Mediators of Inflammation · doi:10.1155/2013/271813 · Cited by 98 · cited 1×
“Potassium efflux and ROS generation have independently been proposed as downstream effects of P2X7 activation.(33) By live-cell imaging, we identified a rapid and robust mitochondrial potassium mobilization associated with P2X7 engagement.”
BackgroundA Highly Selective Mitochondria‐Targeting Fluorescent K+ Sensor
Kong, X., Su, F., Zhang, L., Yaron, J. R., Lee, F., Shi, Z., Tian, Y., & Meldrum, D. R. (2015) · Angewandte Chemie International Edition · doi:10.1002/anie.201506038 · Cited by 98
Ursu, D., Ebert, P. J., Langron, E., Ruble, C., Munsie, L. M., Zou, W., Fijal, B. A., Qian, Y., McNearney, T. A., Mogg, A. J., et al. (2014) · Molecular Pain · doi:10.1186/1744-8069-10-37 · Cited by 77 · cited 1×
“It was recently reported that membrane permeability is dose dependently related to P2X7 receptor activation, but it is unknown whether potassium efflux is similarly dose dependent.(24) We observed a dose dependence of both potassium efflux and membrane permeability as indicated by the response in the KS6 potassium sen…”
BackgroundTemporary Sequestration of Potassium by Mitochondria in Astrocytes
Kozoriz, M. G., Church, J., Ozog, M. A., Naus, C. C. G., & Krebs, C. (2010) · Journal of Biological Chemistry · doi:10.1074/jbc.m109.082073 · Cited by 48 · cited 1×
“This provides additional support for the observation that mitochondria respond to cytosolic potassium levels, as it was previously shown that mitochondria are capable of sequestering and buffering cytosolic potassium.(35) A mitochondrial potassium buffering mechanism is further supported by our finding that efflux is…”
BackgroundNolin, F., Michel, J., Wortham, L., Tchelidze, P., Balossier, G., Banchet, V., Bobichon, H., Lalun, N., Terryn, C., & Ploton, D. (2013) · Cellular and Molecular Life Sciences · doi:10.1007/s00018-013-1267-7 · Cited by 35 · cited 1×
“its concentration is nearly twice (200–300mM) that of the cytosol (100–150mM).(25) Because extracellular ATP is detected at plasma membrane-localized P2X7 receptors resulting in cytosolic potassium efflux, we sought to determine”
BackgroundIntegrating epigenetic data into molecular casual networks
Yoo, S., Lee, E., & Zhu, J. (2014) · Molecular Pain · doi:10.1186/1744-8069-10-s1-o21 · Cited by 5
Research works printed but not linked: 1
- Murakami T, Ockinger J, Yu J, Byles V . Critical role for calcium mobilization in activation of the NLRP3 inflammasome. Proc Natl Acad Sci USA 2012; 109: 11282–11287. · DOI
Cited by
Sorted by citations
The NLRP3 inflammasome: molecular activation and regulation to therapeutics
Swanson, K. V., Deng, M., & Ting, J. P.-Y. (2019) · Nature Reviews Immunology · doi:10.1038/s41577-019-0165-0 · Cited by 4,884
An update on the regulatory mechanisms of NLRP3 inflammasome activation
Paik, S., Kim, J. K., Silwal, P., Sasakawa, C., & Jo, E. (2021) · Cellular and Molecular Immunology · doi:10.1038/s41423-021-00670-3 · Cited by 943
“Several studies have shown a cooperative relationship between K efflux and Ca flux, contributing to the idea of a greater influence on mtROS generation.(99,107) However, other studies have shown that K efflux-mediated NLRP3 inflammasome signaling is not associated with cytosolic Ca flux.”
Postler, T. S., & Ghosh, S. (2017) · Cell Metabolism · doi:10.1016/j.cmet.2017.05.008 · Cited by 876
“Importantly, this has been shown to elicit activation of the NLRP3 inflammasome in LPS-stimulated macrophages, which causes secretion of IL-18 (but also of the pro-inflammatory cytokine IL-1b) and may thus promote maintenance and function of the epithelial barrier (Mariathasan et al., 2006; Sutterwala et al., 2006, 20…”
BackgroundDiverse stimuli engage different neutrophil extracellular trap pathways
Kenny, E. F., Herzig, A., Krüger, R., Muth, A., Mondal, S., Thompson, P. R., Brinkmann, V., von Bernuth, H., & Zychlinsky, A. (2017) · eLife · doi:10.7554/elife.24437 · Cited by 833
“A23187 is a calcium ionophore that causes a massive influx of calcium and nigericin stimulates potassium effluxes in cells which also results in the influx of calcium demonstrating the similarity between the ionophores in their mechanism of NET induction (Yaron et al., 2015).”
BackgroundInflammation in gout: mechanisms and therapeutic targets
So, A. K.-L., & Martinon, F. (2017) · Nature Reviews Rheumatology · doi:10.1038/nrrheum.2017.155 · Cited by 633
Metadata
- Authors
- Yaron, J. R., Gangaraju, S., Rao, M. Y., Kong, X., Zhang, L., Su, F., Tian, Y., Glenn, H. L., & Meldrum, D. R.
- Affiliations
- Arizona State University (US)
- Corresponding author
- Meldrum, D R
- Venue
- Cell Death & Disease
- Published
- 2015-10-29
- Volume
- 6
- Issue
- 10
- Pages
- e1954-e1954
- ISSN
- 2041-4889 (ISSN-L)
- PMC
- PMC5399176
- OpenAlex
- W2212334792
- Cited by
- 212
- References
- 44
- Citations by year
- 2026: 11 · 2025: 22 · 2024: 20 · 2023: 25 · 2022: 21 · 2021: 22 · 2020: 25 · 2019: 18 · 2018: 23 · 2017: 14 · 2016: 11
- FWCI
- 6.94
- Type
- journal article
- Language
- en
- Open access
- gold
- doi.org
- Locations
- Cell Death and Disease (publishedVersion, cc-by)
- Europe PMC (PubMed Central) (publishedVersion, cc-by)
- PubMed Central (publishedVersion, cc-by)
- PubMed (publishedVersion)
- Funders
- National Institutes of Health
- National Human Genome Research Institute (P50HG002360)
- National Cancer Institute (U01CA164250)
- Common Fund
- Topics
- Life Sciences › Biochemistry, Genetics and Molecular Biology › Molecular Biology › Inflammasome and immune disorders
- Life Sciences › Biochemistry, Genetics and Molecular Biology › Physiology › Adenosine and Purinergic Signaling
- Life Sciences › Biochemistry, Genetics and Molecular Biology › Physiology › Calcium signaling and nucleotide metabolism
- Keywords
- P2X7 receptor, NLRP3 inflammasome, potassium efflux, calcium influx, Fluo-4, mitochondrial reactive oxygen species, pyroptosis, macrophages, LPS priming, extracellular ATP, BAPTA-AM
- MeSH terms
- Adenosine Triphosphate, Animals, Calcium, Cell Line, Macrophages, Mitochondria, Models, Biological, Potassium, Reactive Oxygen Species, Calcium Signaling, Mice, Receptors, Purinergic P2X7, Inflammasomes
About these checks
Registry, retraction, Cites and statistics results are computed, not judged, with one exception: a printed reference that no index lists is read once by a model before it counts as a citation error. Claims are extracted by a model and kept only when their quote appears verbatim in the text; each cited source is then checked, with a model’s help, for whether it says what the claim relies on. Those verdicts can be wrong — read the claim’s quote and the cited source before relying on one.
Statistics and arithmetic are recomputed, not judged.
Confidence bands are shown only for fields calibrated on our annotated test set. None is calibrated yet, so no band is shown.
What counts as a claim ›How we measure confidence ›How we check this ›
Are you an author, or do you see a problem with this page? Request a review
