

The DOI matches its Crossref record; 51 of the 51 references it cites were found in a registry or an index.
Improved maize reference genome with single-molecule technologies
Published version of a preprint
Abstract
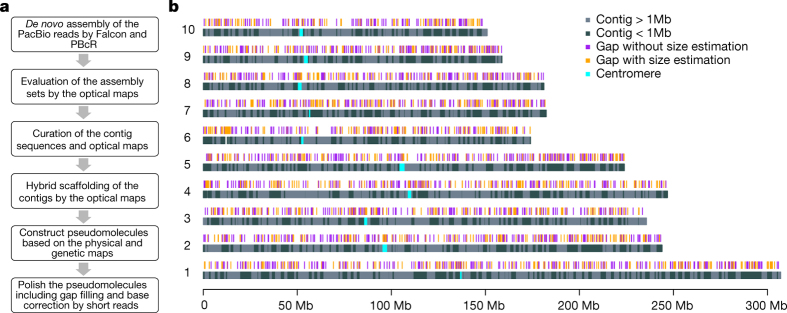
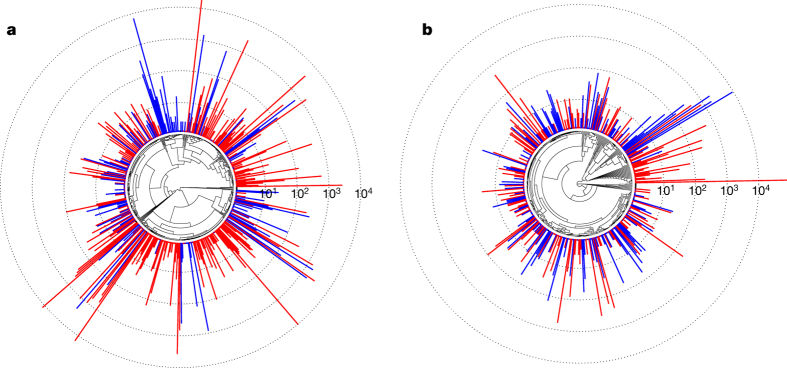
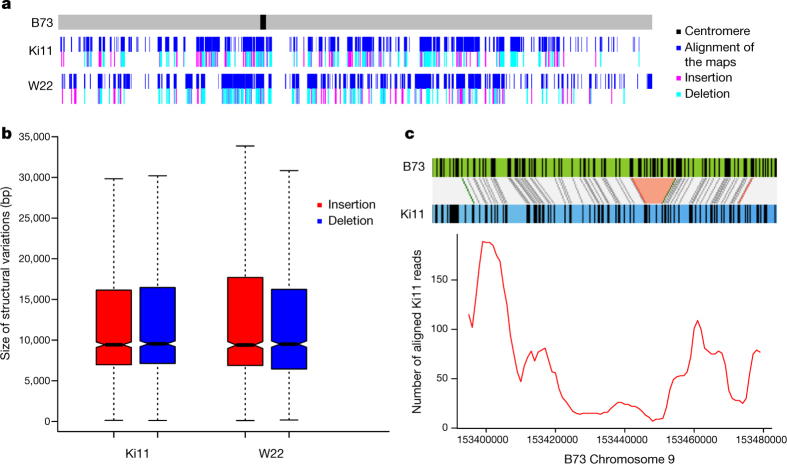
ABSTRACT Complete and accurate reference genomes and annotations provide fundamental tools for characterization of genetic and functional variation. These resources facilitate elucidation of biological processes and support translation of research findings into improved and sustainable agricultural technologies. Many reference genomes for crop plants have been generated over the past decade, but these genomes are often fragmented and missing complex repeat regions. Here, we report the assembly and annotation of maize, a genetic and agricultural model species, using Single Molecule Real-Time (SMRT) sequencing and high-resolution optical mapping. Relative to the previous reference genome, our assembly features a 52-fold increase in contig length and significant improvements in the assembly of intergenic spaces and centromeres. Characterization of the repetitive portion of the genome revealed over 130,000 intact transposable elements (TEs), allowing us to identify TE lineage expansions unique to maize. Gene annotations were updated using 111,000 full-length transcripts obtained by SMRT sequencing. In addition, comparative optical mapping of two other inbreds revealed a prevalence of deletions in the low gene density region and maize lineage-specific genes.
Overview
The claims and statistics of this paper haven’t been checked yet.
Run the check — free, no account needed. It reads the open-access text and checks the sources it cites.
Integrity signals
Registry
Cites
Statistics
Figures
Verification
Claims the paper makes
The claims and statistics of this paper haven’t been checked yet.
Run the check — free, no account needed. It reads the open-access text and checks the sources it cites.
Claims other papers make about this one
Each is checked against this paper’s own text: does it say what the citing paper says it does?
In the citing paper
“For instance, the maize reference genome harbors >100,000 LTR elements falling into ~20,000 distinct families accounting for about half of the genomic DNA (Jiao et al. 2017).”
From RepeatModeler2 for automated genomic discovery of transposable element families (2020) · cites this paper as Jiao et al. 2017
Self-check
Percentages, sums and reported differences re-computed from the paper’s own numbers.
The self-check needs the paper’s full text.
Citations
Cites
The Sequence Alignment/Map format and SAMtools
Li, H., Handsaker, B., Wysoker, A., Fennell, T., Ruan, J., Homer, N., Marth, G., Abecasis, G., Durbin, R., & 1000 Genome Project Data Processing Subgroup (2009) · Bioinformatics · doi:10.1093/bioinformatics/btp352 · Cited by 62,041
Fast and accurate short read alignment with Burrows-Wheeler transform
Li, H., & Durbin, R. (2009) · Bioinformatics · doi:10.1093/bioinformatics/btp324 · Cited by 58,607
Fast gapped-read alignment with Bowtie 2
Langmead, B., & Salzberg, S. L. (2012) · Nature Methods · doi:10.1038/nmeth.1923 · Cited by 56,400
Walker, B. J., Abeel, T., Shea, T., Priest, M., Abouelliel, A., Sakthikumar, S., Cuomo, C. A., Zeng, Q., Wortman, J., Young, S. K., et al. (2014) · PLoS ONE · doi:10.1371/journal.pone.0112963 · Cited by 9,197
Versatile and open software for comparing large genomes
Kurtz, S., Phillippy, A., Delcher, A. L., Smoot, M., Shumway, M., Antonescu, C., & Salzberg, S. L. (2004) · Genome Biology · doi:10.1186/gb-2004-5-2-r12 · Cited by 5,254
The B73 Maize Genome: Complexity, Diversity, and Dynamics
Schnable, P. S., Ware, D., Fulton, R. S., Stein, J. C., Wei, F., Pasternak, S., Liang, C., Zhang, J., Fulton, L., Graves, T., et al. (2009) · Science · doi:10.1126/science.1178534 · Cited by 4,096
Self-citationTransposable elements and the epigenetic regulation of the genome
Slotkin, R. K., & Martienssen, R. (2007) · Nature Reviews Genetics · doi:10.1038/nrg2072 · Cited by 2,044
Phased diploid genome assembly with single-molecule real-time sequencing
Chin, C.-S., Peluso, P., Sedlazeck, F. J., Nattestad, M., Concepcion, G. T., Clum, A., Dunn, C., O'Malley, R., Figueroa-Balderas, R., Morales-Cruz, A., et al. (2016) · Nature Methods · doi:10.1038/nmeth.4035 · Cited by 1,904
Self-citationThe origin and behavior of mutable loci in maize
McClintock, B. (1950) · Proceedings of the National Academy of Sciences · doi:10.1073/pnas.36.6.344 · Cited by 1,747
LTRharvest, an efficient and flexible software for de novo detection of LTR retrotransposons
Ellinghaus, D., Kurtz, S., & Willhoeft, U. (2008) · BMC Bioinformatics · doi:10.1186/1471-2105-9-18 · Cited by 1,641
Clark, K., Karsch-Mizrachi, I., Lipman, D. J., Ostell, J., & Sayers, E. W. (2016) · Nucleic Acids Research · doi:10.1093/nar/gkv1276 · Cited by 1,492
Nested Retrotransposons in the Intergenic Regions of the Maize Genome
SanMiguel, P. J., Tikhonov, A. P., Jin, Y., Motchoulskaia, N., Zakharov, D., Melake‐Berhan, A., Springer, P. S., Edwards, K. J., Lee, M., AVRAMOVA, Z. V., et al. (1996) · Science · doi:10.1126/science.274.5288.765 · Cited by 1,402
Genetic Properties of the Maize Nested Association Mapping Population
McMullen, M. D., Kresovich, S., Sánchez‐Villeda, H., Bradbury, P. J., Li, H., Sun, Q., Flint-Garcia, S. A., Thornsberry, J. M., Acharya, C. B., Bottoms, C. A., et al. (2009) · Science · doi:10.1126/science.1174320 · Cited by 1,062
Self-citationPlant NBS-LRR proteins: adaptable guards.
McHale, L. K., Tan, X., Koehl, P., & Michelmore, R. W. (2006) · Genome biology · doi:10.1186/gb-2006-7-4-212 · Cited by 1,008
Comparative population genomics of maize domestication and improvement
Hufford, M. B., Xu, X., van Heerwaarden, J., Pyhäjärvi, T., Chia, J.-M., Cartwright, R. A., Elshire, R. J., Glaubitz, J. C., Guill, K. E., Kaeppler, S. M., et al. (2012) · Nature Genetics · doi:10.1038/ng.2309 · Cited by 960
Self-citationAssembling large genomes with single-molecule sequencing and locality-sensitive hashing
Berlin, K., Koren, S., Chin, C.-S., Drake, J. P., Landolin, J. M., & Phillippy, A. M. (2015) · Nature Biotechnology · doi:10.1038/nbt.3238 · Cited by 934
Self-citationDifferentiation of the maize subgenomes by genome dominance and both ancient and ongoing gene loss
Schnable, J. C., Springer, N. M., & Freeling, M. (2011) · Proceedings of the National Academy of Sciences · doi:10.1073/pnas.1101368108 · Cited by 708
Self-citationHan, Y., & Wessler, S. R. (2010) · Nucleic Acids Research · doi:10.1093/nar/gkq862 · Cited by 631
Ganal, M. W., Durstewitz, G., Polley, A., Berard, A., Buckler, E. S., Charcosset, A., Clarke, J. D., Graner, E.-M., Hansen, M., Joets, J., et al. (2011) · PLoS ONE · doi:10.1371/journal.pone.0028334 · Cited by 604
Self-citationUnveiling the complexity of the maize transcriptome by single-molecule long-read sequencing
Wang, B., Tseng, E., Regulski, M., Clark, T. A., Hon, T., Jiao, Y., Lu, Z., Olson, A., Stein, J. C., & Ware, D. (2016) · Nature Communications · doi:10.1038/ncomms11708 · Cited by 591
Self-citationMaize HapMap2 identifies extant variation from a genome in flux
Chia, J.-M., Song, C., Bradbury, P. J., Costich, D. E., de León, N., Doebley, J., Elshire, R. J., Gaut, B. S., Geller, L., Glaubitz, J. C., et al. (2012) · Nature Genetics · doi:10.1038/ng.2313 · Cited by 583
Self-citationCrop genomics: advances and applications
Morrell, P. L., Buckler, E. S., & Ross-Ibarra, J. (2012) · Nature Reviews Genetics · doi:10.1038/nrg3097 · Cited by 507
Self-citationAssembly and diploid architecture of an individual human genome via single-molecule technologies
Pendleton, M., Sebra, R., Pang, A. W. C., Ummat, A., Franzén, O., Rausch, T., Stütz, A. M., Stedman, W., Anantharaman, T., Hastie, A. R., et al. (2015) · Nature Methods · doi:10.1038/nmeth.3454 · Cited by 474
Self-citationCampbell, M. S., Law, M.-Y., Holt, C., Stein, J. C., Moghe, G. D., Hufnagel, D. E., Lei, J., Achawanantakun, R., Jiao, D., Lawrence‐Dill, C. J., et al. (2013) · PLANT PHYSIOLOGY · doi:10.1104/pp.113.230144 · Cited by 423
Self-citationBaucom, R. S., Estill, J. C., Chaparro, C., Upshaw, N., Jogi, A., Deragon, J.-M., Westerman, R. P., SanMiguel, P. J., & Bennetzen, J. L. (2009) · PLoS Genetics · doi:10.1371/journal.pgen.1000732 · Cited by 347
Swanson-Wagner, R. A., Eichten, S. R., Kumari, S., Tiffin, P., Stein, J. C., Ware, D., & Springer, N. M. (2010) · Genome Research · doi:10.1101/gr.109165.110 · Cited by 321
Self-citationEvolution of DNA Sequence Nonhomologies among Maize Inbreds
Brunner, S., Fengler, K., Morgante, M., Tingey, S., & Rafalski, A. (2005) · The Plant Cell · doi:10.1105/tpc.104.025627 · Cited by 318
Single-molecule sequencing of the desiccation-tolerant grass Oropetium thomaeum
VanBuren, R., Bryant, D., Edger, P. P., Tang, H., Burgess, D., Challabathula, D., Spittle, K., Hall, R., Gu, J., Lyons, E., et al. (2015) · Nature · doi:10.1038/nature15714 · Cited by 296
Self-citationFine-grained annotation and classification of de novo predicted LTR retrotransposons
Steinbiss, S., Willhoeft, U., Gremme, G., & Kurtz, S. (2009) · Nucleic Acids Research · doi:10.1093/nar/gkp759 · Cited by 286
Open chromatin reveals the functional maize genome
Rodgers-Melnick, E., Vera, D. L., Bass, H. W., & Buckler, E. S. (2016) · Proceedings of the National Academy of Sciences · doi:10.1073/pnas.1525244113 · Cited by 286
Accessing complex crop genomes with next-generation sequencing
Edwards, D., Batley, J., & Snowdon, R. J. (2013) · Theoretical and Applied Genetics · doi:10.1007/s00122-012-1964-x · Cited by 281
HelitronScanner uncovers a large overlooked cache of Helitron transposons in many plant genomes
Xiong, W., He, L., Lai, J., Dooner, H. K., & Du, C. (2014) · Proceedings of the National Academy of Sciences · doi:10.1073/pnas.1410068111 · Cited by 272
Structural variations in plant genomes
Saxena, R. K., Edwards, D., & Varshney, R. K. (2014) · Briefings in Functional Genomics · doi:10.1093/bfgp/elu016 · Cited by 257
Molecular and functional diversity of maize
Buckler, E. S., Gaut, B. S., & McMullen, M. D. (2006) · Current Opinion in Plant Biology · doi:10.1016/j.pbi.2006.01.013 · Cited by 246
Self-citationAssociation Mapping across Numerous Traits Reveals Patterns of Functional Variation in Maize
Wallace, J. G., Bradbury, P. J., Zhang, N., Gibon, Y., Stitt, M., & Buckler, E. S. (2014) · PLoS Genetics · doi:10.1371/journal.pgen.1004845 · Cited by 227
A hybrid approach for de novo human genome sequence assembly and phasing
Mostovoy, Y., Levy‐Sakin, M., Lam, J. C., Lam, E. T., Hastie, A. R., Marks, P., Lee, J., Chu, C., Lin, C. J., Džakula, Ž., et al. (2016) · Nature Methods · doi:10.1038/nmeth.3865 · Cited by 216
Self-citationHirsch, C. N., Hirsch, C. D., Brohammer, A. B., Bowman, M. J., Soifer, I., Barad, O., Shem‐Tov, D., Baruch, K., Lü, F., Hernandez, A. G., et al. (2016) · The Plant Cell · doi:10.1105/tpc.16.00353 · Cited by 193
Self-citationSequencing, Mapping, and Analysis of 27,455 Maize Full-Length cDNAs
Soderlund, C. A., Descour, A. S., Kudrna, D., Bomhoff, M., Boyd, L., Currie, J., Angelova, A. G., Collura, K., Wissotski, M., Ashley, E., et al. (2009) · PLoS Genetics · doi:10.1371/journal.pgen.1000740 · Cited by 174
Maize (Zea mays): A Model Organism for Basic and Applied Research in Plant BiologyPreprint
Strable, J., & Scanlon, M. J. (2009) · Cold Spring Harbor Protocols · doi:10.1101/pdb.emo132 · Cited by 162
Cao, H., Hastie, A., Cao, D., Lam, E. T., Sun, Y., Huang, H., Lin, L., Lin, L., Andrews, W., Chan, S., et al. (2014) · GigaScience · doi:10.1186/2047-217x-3-34 · Cited by 161
Self-citationWenke, T., Döbel, T., Sörensen, T. R., Junghans, H., Weißhaar, B., & Schmidt, T. (2011) · The Plant Cell · doi:10.1105/tpc.111.088682 · Cited by 125
Genetic, evolutionary and plant breeding insights from the domestication of maize
Hake, S., & Ross‐Ibarra, J. (2015) · eLife · doi:10.7554/elife.05861 · Cited by 115
Self-citationThe Physical and Genetic Framework of the Maize B73 Genome
Wei, F., Zhang, J., Zhou, S., He, R., Schaeffer, M. L., Collura, K., Kudrna, D. A., Faga, B. P., Wissotski, M., Golser, W., et al. (2009) · PLoS Genetics · doi:10.1371/journal.pgen.1000715 · Cited by 105
Self-citationDooner, H. K., & He, L. (2008) · The Plant Cell · doi:10.1105/tpc.107.057596 · Cited by 104
Inbreeding drives maize centromere evolution
Schneider, K. L., Xie, Z., Wolfgruber, T., & Presting, G. G. (2016) · Proceedings of the National Academy of Sciences · doi:10.1073/pnas.1522008113 · Cited by 104
Self-citationRho, M., & Tang, H. (2009) · Nucleic Acids Research · doi:10.1093/nar/gkp752 · Cited by 77
Fouquet, R., Martin, F., Fajardo, D. S., Gault, C. M., Gómez, E., Tseung, C., Policht, T., Hueros, G., & Settles, A. M. (2011) · The Plant Cell · doi:10.1105/tpc.111.092163 · Cited by 59
Serpin protease inhibitors in plant biology
Fluhr, R., Lampl, N., & Roberts, T. H. (2011) · Physiologia Plantarum · doi:10.1111/j.1399-3054.2011.01540.x · Cited by 59
Sustained retrotransposition is mediated by nucleotide deletions and interelement recombinations
Sharma, A., Schneider, K. L., & Presting, G. G. (2008) · Proceedings of the National Academy of Sciences · doi:10.1073/pnas.0805694105 · Cited by 44
Self-citationLaw, M.-Y., Childs, K. L., Campbell, M. S., Stein, J. C., Olson, A. J., Holt, C., Panchy, N. L., Lei, J., Jiao, D., Andorf, C. M., et al. (2014) · PLANT PHYSIOLOGY · doi:10.1104/pp.114.245027 · Cited by 44
Self-citationStable Patterns of CENH3 Occupancy Through Maize Lineages Containing Genetically Similar Centromeres
Gent, J. I., Wang, K., Jiang, J., & Dawe, R. K. (2015) · Genetics · doi:10.1534/genetics.115.177360 · Cited by 26
Self-citation
Cited by
RepeatModeler2 for automated genomic discovery of transposable element families
Flynn, J. M., Hubley, R., Goubert, C., Rosen, J., Clark, A. G., Feschotte, C., & Smit, A. F. (2020) · Proceedings of the National Academy of Sciences · doi:10.1073/pnas.1921046117 · Cited by 3,848
Piercing the dark matter: bioinformatics of long-range sequencing and mapping
Sedlazeck, F. J., Lee, H., Darby, C. A., & Schatz, M. C. (2018) · Nature Reviews Genetics · doi:10.1038/s41576-018-0003-4 · Cited by 530
The population genetics of structural variants in grapevine domestication
Zhou, Y., Minio, A., Massonnet, M., Solares, E., Lv, Y., Beridze, T., Cantu, D., & Gaut, B. S. (2019) · Nature Plants · doi:10.1038/s41477-019-0507-8 · Cited by 339
TRITEX: chromosome-scale sequence assembly of Triticeae genomes with open-source tools
Monat, C., Padmarasu, S., Lux, T., Wicker, T., Gundlach, H., Himmelbach, A., Ens, J., Li, C., Muehlbauer, G. J., Schulman, A. H., et al. (2019) · Genome Biology · doi:10.1186/s13059-019-1899-5 · Cited by 251
Yang, T., Liu, R., Luo, Y., Hu, S., Wang, D., Wang, C., Pandey, M. K., Ge, S., Xu, Q., Li, N., et al. (2022) · Nature Genetics · doi:10.1038/s41588-022-01172-2 · Cited by 191
Metadata
- Authors
- Jiao, Y., Peluso, P., Shi, J., Liang, T., Stitzer, M. C., Wang, B., Campbell, M. S., Stein, J. C., Wei, X., Chin, C.-S., Guill, K., Regulski, M., Kumari, S., Olson, A., Gent, J., Schneider, K. L., Wolfgruber, T. K., May, M. R., Springer, N. M., Antoniou, E., McCombie, W. R., Presting, G. G., McMullen, M., Ross-Ibarra, J., Dawe, R. K., Hastie, A., Rank, D. R., & Ware, D.
- Venue
- Nature
- Published
- 2017-06
- Volume
- 546
- Issue
- 7659
- Pages
- 524-527
- ISSN
- 0028-0836
- 1476-4687
- PMC
- PMC7052699
- Cited by
- 1,210
- References
- 51
- Language
- en
- Licence
- creativecommons.org/licenses/by/4.0 (tdm)
About these checks
Registry, retraction, Cites and statistics results are computed, not judged, with one exception: a printed reference that no index lists is read once by a model before it counts as a citation error. Claims are extracted by a model and kept only when their quote appears verbatim in the text; each cited source is then checked, with a model’s help, for whether it says what the claim relies on. Those verdicts can be wrong — read the claim’s quote and the cited source before relying on one.
Statistics and arithmetic are recomputed, not judged.
Confidence bands are shown only for fields calibrated on our annotated test set. None is calibrated yet, so no band is shown.
What counts as a claim ›How we measure confidence ›How we check this ›
Are you an author, or do you see a problem with this page? Request a review
Data sources
Bibliographic data: Semantic Scholar, OpenAlex, Crossref.
Contains information from the Semantic Scholar Academic Graph Datasets, made available under the ODC Attribution License (ODC-BY 1.0).
Semantic Scholar’s data is described in: Kinney, R., et al. (2023). The Semantic Scholar Open Data Platform. arXiv:2301.10140.
