

Quantum interference between transverse spatial waveguide modes
Open accessThe DOI matches its Crossref record; 45 of the 45 references it cites were found in a registry or an index.
Abstract
Integrated quantum optics has the potential to markedly reduce the footprint and resource requirements of quantum information processing systems, but its practical implementation demands broader utilization of the available degrees of freedom within the optical field. To date, integrated photonic quantum systems have primarily relied on path encoding. However, in the classical regime, the transverse spatial modes of a multi-mode waveguide have been easily manipulated using the waveguide geometry to densely encode information. Here, we demonstrate quantum interference between the transverse spatial modes within a single multi-mode waveguide using quantum circuit-building blocks. This work shows that spatial modes can be controlled to an unprecedented level and have the potential to enable practical and robust quantum information processing.
Overview
The claims and statistics of this paper haven’t been checked yet.
Free: it reads the open-access text and checks the first 5 claims that cite a source we can check. Create a free account to check every claim.
Integrity signals
Registry
Cites
Statistics
Figures
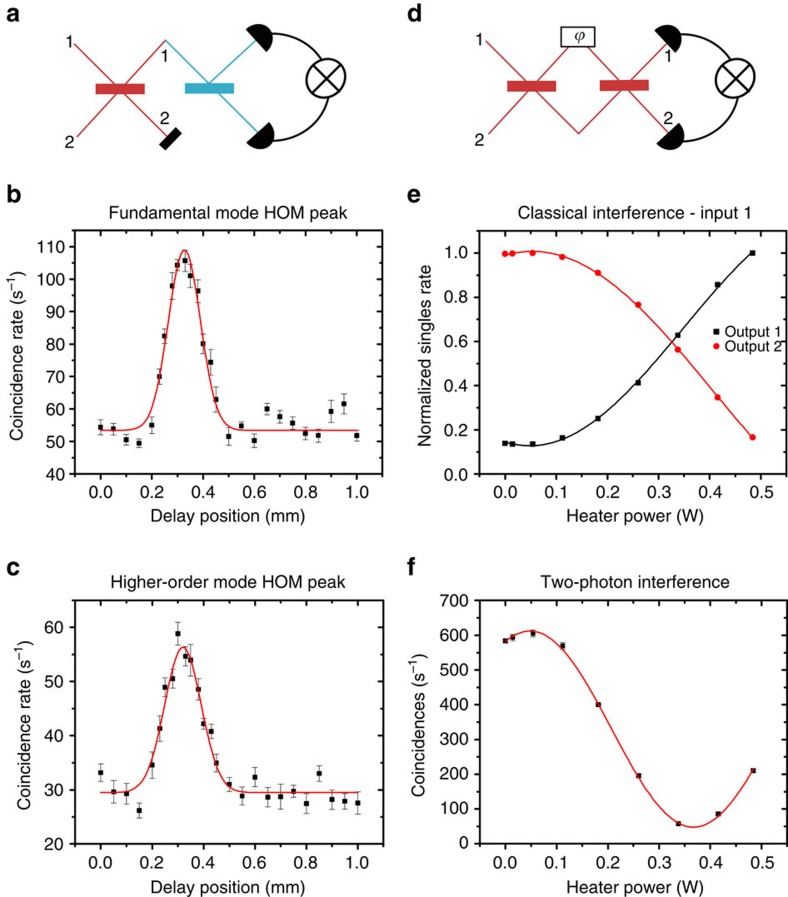
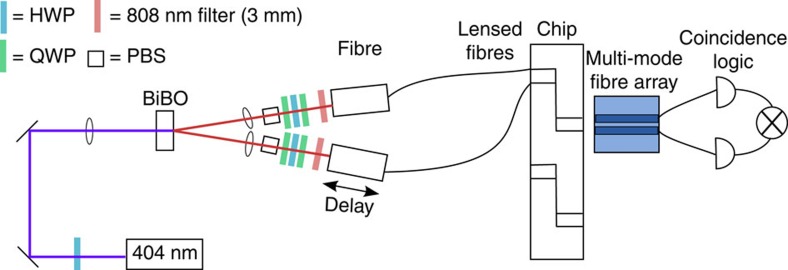
Verification
Claims the paper makes
The claims and statistics of this paper haven’t been checked yet.
Free: it reads the open-access text and checks the first 5 claims that cite a source we can check. Create a free account to check every claim.
Claims other papers make about this one
Each is checked against this paper’s own text: does it say what the citing paper says it does?
The cited source doesn’t support the claim as written.
In the citing paper
“Engineering microresonator enables the generation of highly pure and indistinguishable photons.”
From Integrated photonic quantum technologies (2020) · cites this paper as [46]
Checked by a reasoning model — may be wrong.
Experimental — accuracy not yet measuredThe source backs part of the claim, not all of it — or backs it for a different population, condition or comparison.
In the citing paper
“Exploiting the transverse spatial modes, an on-chip source of polarisation and OAM modes have been demonstrated on a silicon platform, and quantum interference has been demonstrated using photons generated from SPDC and SiN waveguides that act as mode multiplexer and mode beamsplitter [235] (figure 31).”
From 2022 Roadmap on integrated quantum photonics (2022) · cites this paper as [235]
Experimental — accuracy not yet measuredThe cited source says what the claim attributes to it.
In the citing paper
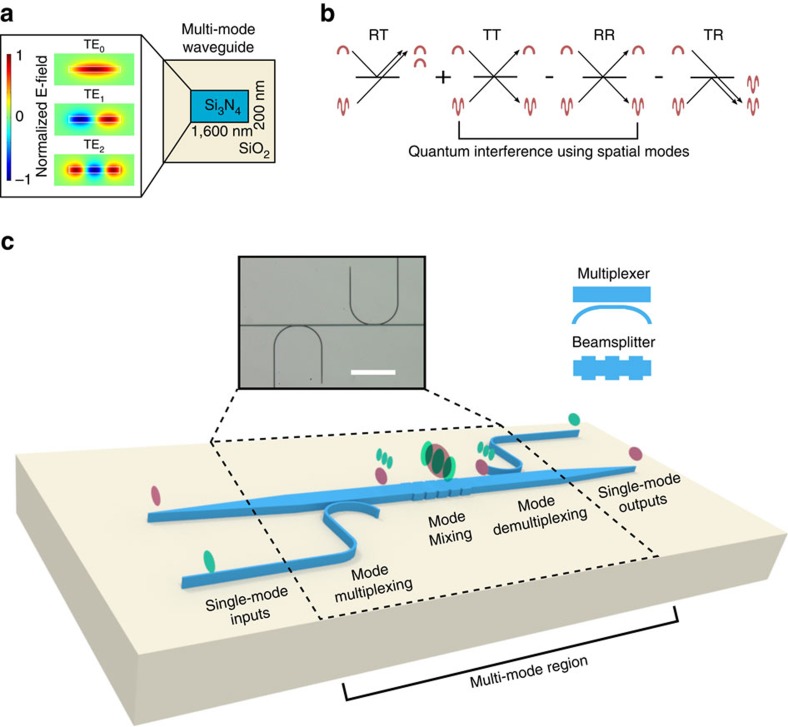
“Transverse spatial modes in a multi-mode waveguide (a) can exhibit Hong-Ou-Mandel two-photon interference (b).”
From 2022 Roadmap on integrated quantum photonics (2022) · cites this paper as [235]
Self-check
Percentages, sums and reported differences re-computed from the paper’s own numbers.
The self-check needs the paper’s full text.
Citations
Cites
Gisin, N., Ribordy, G., Tittel, W., & Zbinden, H. (2002) · Reviews of Modern Physics · doi:10.1103/revmodphys.74.145 · Cited by 8,515
Measurement of subpicosecond time intervals between two photons by interference
Hong, C. K., Ou, Z. Y., & Mandel, L. (1987) · Physical Review Letters · doi:10.1103/physrevlett.59.2044 · Cited by 4,369
Entanglement of the orbital angular momentum states of photons
Mair, A., Vaziri, A., Weihs, G., & Zeilinger, A. (2001) · Nature · doi:10.1038/35085529 · Cited by 3,321
Quantum-Enhanced Measurements: Beating the Standard Quantum Limit
Giovannetti, V., Lloyd, S., & Maccone, L. (2004) · Science · doi:10.1126/science.1104149 · Cited by 3,038
Coupled-mode theory for guided-wave optics
Yariv, A. (1973) · IEEE Journal of Quantum Electronics · doi:10.1109/jqe.1973.1077767 · Cited by 1,998
Silica-on-silicon waveguide quantum circuits
Politi, A., Cryan, M. J., Rarity, J. G., Yu, S., & O'Brien, J. L. (2008) · Science · doi:10.1126/science.1155441 · Cited by 1,084
The computational complexity of linear optics
Aaronson, S., & Arkhipov, A. (2011) · Proceedings of the forty-third annual ACM symposium on Theory of computing · doi:10.1145/1993636.1993682 · Cited by 874
Boson Sampling on a Photonic Chip
Spring, J. B., Metcalf, B. J., Humphreys, P. C., Kolthammer, W. S., Jin, X.-M., Barbieri, M., Datta, A., Thomas-Peter, N., Langford, N. K., Kundys, D., et al. (2013) · Science · doi:10.1126/science.1231692 · Cited by 837
WDM-compatible mode-division multiplexing on a silicon chip
Luo, L.-W., Ophir, N., Chen, C. P., Gabrielli, L. H., Poitras, C. B., Bergmen, K., & Lipson, M. (2014) · Nature Communications · doi:10.1038/ncomms4069 · Cited by 827
Self-citationSimplifying quantum logic using higher-dimensional Hilbert spaces
Lanyon, B. P., Barbieri, M., Almeida, M. P., Jennewein, T., Ralph, T. C., Resch, K. J., Pryde, G. J., O’Brien, J. L., Gilchrist, A., & White, A. G. (2009) · Nature Physics · doi:10.1038/nphys1150 · Cited by 754 · cited 2×
“…field distribution, polarization, time and frequency to encode more information per carrier will enable scalability by simplifying quantum computational architectures 8 , increasing security and noise tolerance in quantum communication channels 9,10 , and simulating richer quantum phenomena 11 .”
Cited by
Optical vortices 30 years on: OAM manipulation from topological charge to multiple singularities
Shen, Y., Wang, X., Xie, Z., Min, C., Fu, X., Liu, Q., Gong, M., & Yuan, X. (2019) · Light: Science & Applications · doi:10.1038/s41377-019-0194-2 · Cited by 2,219
Integrated photonic quantum technologies
Wang, J., Sciarrino, F., Laing, A., & Thompson, M. G. (2020) · Nature Photonics · doi:10.1038/s41566-019-0532-1 · Cited by 1,576
Large-scale optical phased array using a low-power multi-pass silicon photonic platform
Miller, S. A., Chang, Y.-C., Phare, C. T., Shin, M. C., Zadka, M., Roberts, S. P., Stern, B., Ji, X., Mohanty, A., Jimenez Gordillo, O. A., et al. (2020) · Optica · doi:10.1364/optica.7.000003 · Cited by 354
Self-citationLi, C., Liu, D., & Dai, D. (2019) · Nanophotonics · doi:10.1515/nanoph-2018-0161 · Cited by 346
Prospects and applications of on-chip lasers
Zhou, Z., Ou, X., Fang, Y., Alkhazraji, E., Xu, R., Wan, Y., & Bowers, J. E. (2023) · eLight · doi:10.1186/s43593-022-00027-x · Cited by 319
Modes and states in quantum optics
Fabre, C., & Treps, N. (2020) · Reviews of Modern Physics · doi:10.1103/revmodphys.92.035005 · Cited by 312
“Integrated optics and multimode fibers have been also used (Mohanty et al., 2017), as well as spatially multiplexed detection of up to 8 different spatial modes (Armstrong et al., 2012; Su et al., 2012).”
MethodTwo-photon interference: the Hong–Ou–Mandel effect
Bouchard, F., Sit, A., Zhang, Y., Fickler, R., Miatto, F. M., Yao, Y., Sciarrino, F., & Karimi, E. (2021) · Reports on Progress in Physics · doi:10.1088/1361-6633/abcd7a · Cited by 232
“In addition, HOM has not only been observed as bunching into the same paths but in various different photonic degrees of freedom, polarization [29], transverse spatial modes in free space [30, 31] as well as waveguides [32], and also frequency modes [33, 34].”
BackgroundNonlinear and quantum photonics using integrated optical materials
Dutt, A., Mohanty, A., Gaeta, A. L., & Lipson, M. (2024) · Nature Reviews Materials · doi:10.1038/s41578-024-00668-z · Cited by 172
“These sources can be lithographically defined in the same platforms that are used for quantum photonic circuits such as silicon 246 , silicon nitride 252,253 and Hydex 24 .”
Self-citation8×8 reconfigurable quantum photonic processor based on silicon nitride waveguides
Taballione, C., Wolterink, T. A. W., Lugani, J., Eckstein, A., Bell, B. A., Grootjans, R., Visscher, I., Geskus, D., Roeloffzen, C. G. H., Renema, J. J., et al. (2019) · Optics Express · doi:10.1364/oe.27.026842 · Cited by 161
On-chip coherent conversion of photonic quantum entanglement between different degrees of freedom
Feng, L.-T., Zhang, M., Zhou, Z.-Y., Li, M., Xiong, X., Yu, L., Shi, B.-S., Guo, G.-P., Dai, D.-X., Ren, X.-F., et al. (2016) · Nature Communications · doi:10.1038/ncomms11985 · Cited by 134
Self-citationPerspective on mode-division multiplexing
Su, Y., He, Y., Chen, H., Li, X., & Li, G. (2021) · Applied Physics Letters · doi:10.1063/5.0046071 · Cited by 134
Meng, Y., Liu, Z., Xie, Z., Wang, R., Qi, T., Hu, F., Kim, H., Xiao, Q., Fu, X., Wu, Q., et al. (2020) · Photonics Research · doi:10.1364/prj.384449 · Cited by 123
Programmable linear quantum networks with a multimode fibre
Leedumrongwatthanakun, S., Innocenti, L., Defienne, H., Juffmann, T., Ferraro, A., Paternostro, M., & Gigan, S. (2019) · Nature Photonics · doi:10.1038/s41566-019-0553-9 · Cited by 136
Nonlinear multimode photonics: nonlinear optics with many degrees of freedom
Wright, L. G., Renninger, W. H., Christodoulides, D. N., & Wise, F. W. (2022) · Optica · doi:10.1364/optica.461981 · Cited by 135
Vector Vortex Beam Emitter Embedded in a Photonic Chip
Chen, Y., Xia, K., Shen, W.-G., Gao, J., Yan, Z., Jiao, Z., Dou, J.-P., Tang, H. L., Lu, Y., & Jin, X. (2020) · Physical Review Letters · doi:10.1103/physrevlett.124.153601 · Cited by 100
“To find the optimal radius R of the doughnut-shaped waveguide at which the Gaussian modes are phase matched with vortex modes, we calculate the effective refractive indices for different order of vortex modes [29, 34] (see Fig.”
MethodMapping Twisted Light into and out of a Photonic Chip
Chen, Y., Gao, J., Jiao, Z., Sun, K., Shen, W.-G., Qiao, L., Tang, H. L., Lin, X., & Jin, X. (2018) · Physical Review Letters · doi:10.1103/physrevlett.121.233602 · Cited by 94
Roadmap on multimode light shaping
Piccardo, M., Ginis, V., Forbes, A., Mahler, S., Friesem, A. A., Davidson, N., Ren, H., Dorrah, A. H., Capasso, F., Dullo, F. T., et al. (2021) · Journal of Optics · doi:10.1088/2040-8986/ac3a9d · Cited by 99
On-chip transverse-mode entangled photon pair source
Feng, L.-T., Zhang, M., Xiong, X., Chen, Y., Wu, H., Li, M., Guo, G.-P., Guo, G.-C., Daoxin Dai, A., & Ren, X.-F. (2018) · npj Quantum Information · doi:10.1038/s41534-018-0121-z · Cited by 92
Self-citationSilicon photonic devices for scalable quantum information applications
Feng, L., Zhang, M., Wang, J., Zhou, X., Qiang, X., Guo, G., & Ren, X. (2022) · Photonics Research · doi:10.1364/prj.464808 · Cited by 80
“[134], quantum interference between the guided modes was demonstrated within a multimode optical waveguide.”
BackgroundSelf-citationHigh-Dimensional Two-Photon Interference Effects in Spatial Modes
Hiekkamäki, M., & Fickler, R. (2021) · Physical Review Letters · doi:10.1103/physrevlett.126.123601 · Cited by 80
“[11] Otfried Gühne and Géza Tóth, “Entanglement detection,” Physics Reports 474, 1–75 (2009).”
BackgroundQuantum entanglement on photonic chips: a review
Chen, X., Fu, Z., Gong, Q., & Wang, J. (2021) · Advanced Photonics · doi:10.1117/1.ap.3.6.064002 · Cited by 78
“The recent development of multimode silicon photonics enables mode-entanglement and its applications.(45,46) Such a mode-encoding state in optical waveguides can be reliably operated and transmitted, which is fundamentally similar to the case of optical orbital angular momentum in bulk-optics, where it is reliable.”
BackgroundVicencio, R. A. (2021) · Advances in Physics X · doi:10.1080/23746149.2021.1878057 · Cited by 85
Metamaterial-enabled arbitrary on-chip spatial mode manipulation
Xiang, J., Tao, Z., Li, X., Zhao, Y., He, Y., Guo, X., & Su, Y. (2022) · Light Science & Applications · doi:10.1038/s41377-022-00859-9 · Cited by 62
Ultra‐Compact and Ultra‐Broadband Guided‐Mode Exchangers on Silicon
Guo, J., Ye, C., Liu, C., Zhang, M., Li, C., Jiang, L., Shi, Y., & Daoxin Dai, A. (2020) · Laser & Photonics Review · doi:10.1002/lpor.202000058 · Cited by 56
Self-citationSubdiffraction incoherent optical imaging via spatial-mode demultiplexing: Semiclassical treatment
Tsang, M. (2018) · Physical Review A · doi:10.1103/physreva.97.023830 · Cited by 55
“[60] Aseema Mohanty, Mian Zhang, Avik Dutt, Sven Ramelow, Paulo Nussenzveig, and Michal Lipson, “Quantum interference between transverse spatial waveguide modes,” Nature Communications 8, 14010 (2017).”
BackgroundZhang, Y., Li, Z., Liu, W., Li, Z., Cheng, H., Chen, S., & Tian, J. (2019) · Advanced Optical Materials · doi:10.1002/adom.201801273 · Cited by 53
Transverse Mode-Encoded Quantum Gate on a Silicon Photonic Chip
Feng, L.-T., Zhang, M., Xiong, X., Liu, D., Cheng, Y.-J., Jing, F., Qi, X.-Z., Chen, Y., He, D.-Y., Guo, G.-P., et al. (2022) · Physical Review Letters · doi:10.1103/physrevlett.128.060501 · Cited by 61
“Together with the single qubit rotation operation realized previously [19], the CNOT gate makes universal quantum computation with transverse mode-encoded qubits possible.”
MethodSelf-citationQuantum interferometers: Principles and applications
Jin, R., Zeng, Z.-Q., You, C., & Yuan, C. (2024) · Progress in Quantum Electronics · doi:10.1016/j.pquantelec.2024.100519 · Cited by 59
Independent indistinguishable quantum light sources on a reconfigurable photonic integrated circuit
Ellis, D. J. P., Bennett, A. J., Dangel, C., Lee, J. P., Griffiths, J. P., Mitchell, T. A., Paraiso, T.-K., Spencer, P., Ritchie, D. A., & Shields, A. J. (2018) · Applied Physics Letters · doi:10.1063/1.5028339 · Cited by 45
Validation and characterization of algorithms and software for photonics inverse design
Chen, M., Christiansen, R. E., Fan, J. A., Işıklar, G., Jiang, J., Johnson, S. G., Ma, W., Miller, O. D., Oskooi, A. F., Schubert, M. F., et al. (2023) · Journal of the Optical Society of America B · doi:10.1364/josab.506412 · Cited by 51
“Components for efficiently coupling light between orthogonal time-harmonic modes of optical waveguides are important for quantum information processing [74] and optical communications [75–79], where higher-order modes offer additional degrees of freedom for encoding information.”
BackgroundGuo, C., & Fan, S. (2021) · Physical Review Research · doi:10.1103/physrevresearch.3.033161 · Cited by 40
Experimental Observation of Interorbital Coupling
Guzmán-Silva, D., Cáceres-Aravena, G., & Vicencio, R. A. (2021) · Physical Review Letters · doi:10.1103/physrevlett.127.066601 · Cited by 46
Fu, G., Qi, T., Yu, W., Wang, L., Wu, Y., Pan, X., Xiao, Q., Li, D., Gong, M., & Yan, P. (2023) · Laser & Photonics Review · doi:10.1002/lpor.202200987 · Cited by 37
High-efficiency wideband SiN_x-on-SOI grating coupler with low fabrication complexity
Xu, P., Zhang, Y., Shao, Z., Liu, L., Zhou, L., Yang, C., Chen, Y., & Yu, S. (2017) · Optics Letters · doi:10.1364/ol.42.003391 · Cited by 37
Direct generation of spatially entangled qudits using quantum nonlinear optical holography
Yesharim, O., Pearl, S., Foley-Comer, J., Juwiler, I., & Arie, A. (2023) · Science Advances · doi:10.1126/sciadv.ade7968 · Cited by 35
“Moreover, by integrating patterned quasi – phase-matched structures with optical waveguides ( 52 ), few-mode optical waveguide entanglement can be fully engineered on-chip, without the need for free space beam manipulation ( 53 , 54 ).”
High-dimensional quantum information processing on programmable integrated photonic chips
Chi, Y., Yu, Y., Gong, Q., & Wang, J. (2023) · Science China Information Sciences · doi:10.1007/s11432-022-3602-0 · Cited by 34
“Photons represent a natural carrier of high-dimensional quantum information, by encoding the qudit states in a variety of degrees of freedom (DoF) such as path [32, 33], frequency [34, 35], orbital angular momentum [7,36], multitude spatial mode [37,38], and time-bins [14].”
BackgroundQuantum topological photonics with special focus on waveguide systems
Gao, J., Xu, Z.-S., Yang, Z., Zwiller, V., & Elshaari, A. W. (2024) · npj Nanophotonics · doi:10.1038/s44310-024-00034-5 · Cited by 39
Resonators with tailored optical path by cascaded-mode conversions
Ginis, V., Benea-Chelmus, I.-C., Lu, J., Piccardo, M., & Capasso, F. (2023) · Nature Communications · doi:10.1038/s41467-023-35956-9 · Cited by 30
Dou, T., Yue, S., Wang, R., Hou, Y., Shi, H., Zhang, Z., Liu, Y., Mei, X., & Zhang, Z. (2023) · Optics Express · doi:10.1364/oe.481265 · Cited by 24
Integrated photonic platforms for quantum technology: a review
Ramakrishnan, R. K., Ravichandran, A. B., Mishra, A., Kaushalram, A., Hegde, G., Talabattula, S., & Rohde, P. P. (2023) · ISSS Journal of Micro and Smart Systems · doi:10.1007/s41683-023-00115-1 · Cited by 26
“…and chemo-mechanical polishing demonstrated in Lin et al. (2019) have a very low propagation loss of 4.2 dB/m, while the dry etched rib waveguides in Zhang et al. (2017) exhibit a propagation loss of 2.7 (cid:6) 0.3 dB/m. LN also offers an added advantage of low loss over a broader spectral range.”
BackgroundMethodInfluentialNumerical and Experimental Demonstration of Intermodal Dispersive Wave Generation
Lüpken, N. M., Timmerkamp, M., Scheibinger, R., Schaarschmidt, K., Schmidt, M. A., Boller, K. J., & Fallnich, C. (2021) · Laser & Photonics Review · doi:10.1002/lpor.202100125 · Cited by 23
Supporting quantum technologies with an ultralow-loss silicon photonics platform
Cherchi, M., Bera, A., Kemppinen, A., Nissilä, J., Tappura, K., Caputo, M., Lehtimäki, L., Lehtinen, J. S., Govenius, J., Hassinen, T., et al. (2023) · Advanced Photonics Nexus · doi:10.1117/1.apn.2.2.024002 · Cited by 25
Deep-learning-empowered synthetic dimension dynamics: morphing of light into topological modes
Xia, S., Lei, S., Song, D., Lauro, L. D., Alamgir, I., Tang, L., Xu, J., Morandotti, R., Buljan, H., & Chen, Z. (2024) · Advanced Photonics · doi:10.1117/1.ap.6.2.026005 · Cited by 20
Mode-division (de)multiplexing using adiabatic passage and supersymmetric waveguides
Queraltó, G., Ahufinger, V., & Mompart, J. (2017) · Optics Express · doi:10.1364/oe.25.027396 · Cited by 22
Resonance-Free Light RecyclingPreprint
Chang, Y.-C., Roberts, S. P., Stern, B., & Lipson, M. F. (2017) · arXiv (Cornell University) · doi:10.48550/arxiv.1710.02891 · Cited by 17
Self-citationChen, T., Xu, M., Pu, M., Zeng, Q., Zheng, Y., Xiao, Y., Ha, Y., Guo, Y., Zhang, F., Chi, N., et al. (2024) · ACS Photonics · doi:10.1021/acsphotonics.3c01454 · Cited by 17
Simulation of Quantum Radar Cross Section for Electrically Large Targets With GPU
Zhang, T., Zeng, H. J., & Chen, R. (2019) · IEEE Access · doi:10.1109/access.2019.2947738 · Cited by 16
Broadband mode exchanger based on subwavelength Y‐junctions
de Cabo, R. F., Sánchez‐Sánchez, A., Yang, Y., Melati, D., Alonso‐Ramos, C., Velasco, A. V., & González‐Andrade, D. (2024) · Nanophotonics · doi:10.1515/nanoph-2024-0291 · Cited by 15
Bidirectional mode-division multiplexers with antireflection gratings
Shalaby, H. M. H. (2018) · Applied Optics · doi:10.1364/ao.57.000476 · Cited by 15
Quantum states of higher-order whispering gallery modes in a silicon micro-disk resonator
Kumar, R. R., Wang, Y., Zhang, Y., & Tsang, H. K. (2020) · Journal of the Optical Society of America B · doi:10.1364/josab.385551 · Cited by 13
Mode-division multiplexing for visible photonic integrated circuits
Shah, P., Mellouk, E. B., Levine, J., & Mohanty, A. (2024) · Optics Letters · doi:10.1364/ol.530977 · Cited by 12
Self-citationOn-chip high-dimensional entangled photon sources
Kaur, T., Peace, D., & Romero, J. (2024) · Journal of Optics · doi:10.1088/2040-8986/ada0c5 · Cited by 16
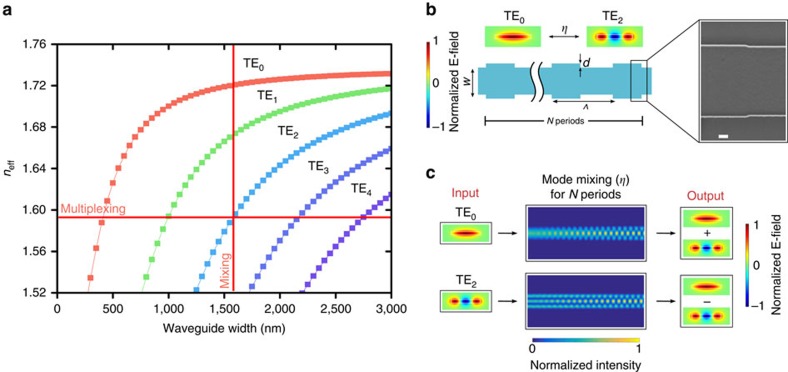
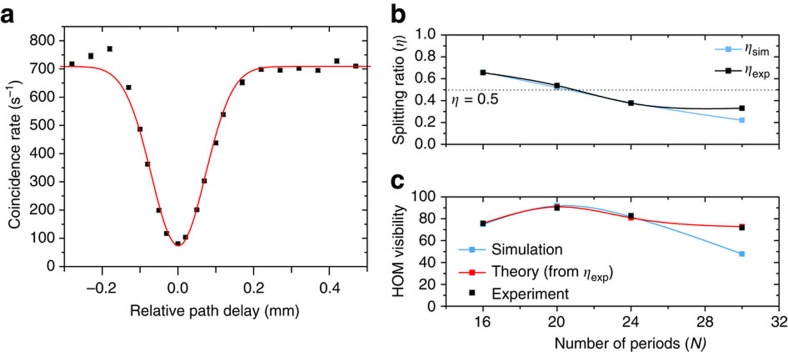
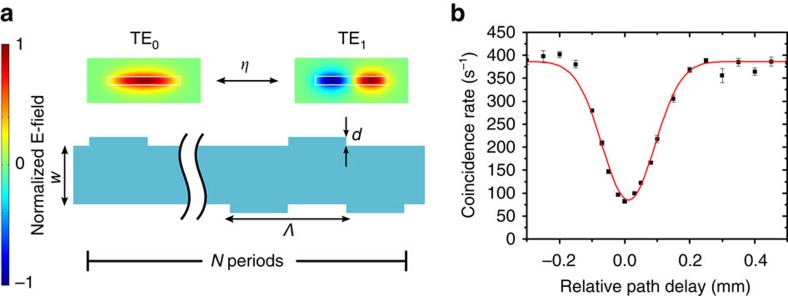
“Mohanty et al [252] designed multimode SiN wave-guides supporting three spatial modes (TE 0 , TE 1 , TE 2 ) and demonstrated tunable quantum interference between pairs of photons in different transverse spatial modes using a grating structure along the multimode waveguide (figure 7(A)).”
MEMS‐enabled Ultralow Power Consumption Programmable Arbitrary Order Mode Switch
Sun, H., Qiao, Q., Lee, C., & Zhou, G. (2024) · Laser & Photonics Review · doi:10.1002/lpor.202400641 · Cited by 11
Multimode Metallic Double‐Strip Waveguides for Polarization Manipulation
Gan, F., Sun, C., Wang, Y., Li, H., Gong, Q., & Chen, J. (2017) · Advanced Materials Technologies · doi:10.1002/admt.201600248 · Cited by 11
Zhang, X., Jiang, C., Su, Y., Ye, Z., Huang, C., Zhang, Y., Zhu, S. N., & Hu, X. (2025) · Laser & Photonics Review · doi:10.1002/lpor.202500385 · Cited by 9
Ultra-compact efficient mode converter with metamaterial structures
Zhang, J., Qiu, P., Ren, Y., Chen, X., Dai, Z., Song, X., Yang, J., Huang, L., & Guo, K. (2022) · Infrared Physics & Technology · doi:10.1016/j.infrared.2022.104200 · Cited by 9
Ar/Cl2 etching of GaAs optomechanical microdisks fabricated with positive electroresist
Benevides, R., Ménard, M., Wiederhecker, G. S., & Alegre, T. P. M. (2019) · Optical Materials Express · doi:10.1364/ome.10.000057 · Cited by 10
Cernansky, R., Martini, F., & Politi, A. (2018) · Optics Letters · doi:10.1364/ol.43.000855 · Cited by 10
Topological winding guaranteed coherent orthogonal scattering
Guo, C., & Fan, S. (2024) · Physical Review A · doi:10.1103/physreva.109.l061503 · Cited by 8
Compact, Scalable and Flexible Multi-Mode-Converting Model Employing Subwavelength Gratings
Guo, Z., Xiao, J., Wu, S., Lai, Y., & Cheng, S. (2024) · Journal of Lightwave Technology · doi:10.1109/jlt.2024.3421379 · Cited by 7
“…are deemed as vital optical degrees of freedom to offer the possibility and flexibility for a broad range of applications, e.g., quantum information processing [1], [2], photonic sensing [3], optical switching [4], non-linear photonics [5], [6], and low-loss mid-infrared (MIR) light propagating [7].”
BackgroundThree-dimensional programming of nanolaser arrays through a single optical microfiber
Song, D. I., Yu, A., Samutpraphoot, P., Lee, J., Kim, M., Park, B. J., Sipahigil, A., & Kim, M. (2022) · Optica · doi:10.1364/optica.471715 · Cited by 7
2022 Roadmap on integrated quantum photonics
Moody, G., Sorger, V. J., Blumenthal, D. J., Juodawlkis, P. W., Loh, W., Sorace-Agaskar, C., Jones, A. E., Balram, K. C., Matthews, J. C. F., Laing, A., et al. (2022) · Journal of Physics: Photonics · doi:10.1088/2515-7647/ac1ef4 · Cited by 6
“Exploiting the transverse spatial modes, an on-chip source of polarisation and OAMmodes have been demonstrated on a silicon platform, and quantum interference has been demonstrated using photons generated from SPDC and SiN waveguides that act as mode multiplexer and mode beamsplitter [235] (figure 31).”
MethodImproved Entanglement‐Based High‐Dimensional Optical Quantum Computation with Linear Optics
Gao, H., Song, G., & Wei, H. (2024) · Annalen der Physik · doi:10.1002/andp.202400144 · Cited by 6
Guo, Z., Wu, S., Lai, Y., & Cheng, S. (2024) · Journal of Lightwave Technology · doi:10.1109/jlt.2024.3451234 · Cited by 6
“processing [6], optical switching systems [7].”
InfluentialTutorial: Hong–Ou–Mandel interference with structured photons
Jaouni, T., Gu, X., Krenn, M., D’Errico, A., & Karimi, E. (2025) · Nanophotonics · doi:10.1515/nanoph-2025-0034 · Cited by 6
“Despite this progress, there remains a gap in the literature: a comprehensive tutorial addressing the interplay be-tween beamsplitters, detection systems, and photons with differing spatial modes.”
Cascaded-mode interferometers: Spectral shape and linewidth engineering
Lu, J., Benea-Chelmus, I.-C., Ginis, V., Ossiander, M., & Capasso, F. (2025) · Science Advances · doi:10.1126/sciadv.adt4154 · Cited by 6
“The refractive index of silicon and silicon oxide is 3.46 and 1.46, respectively.”
InfluentialOptical simulation of various phenomena in curved space on photonic chips
Sheng, C., Zhu, S. N., & Liu, H. (2022) · Advances in Physics X · doi:10.1080/23746149.2022.2153626 · Cited by 7
“A plethora of advanced integrated devices on chips with unprecedented performance have been well demonstrated, e.g. polarization beam splitters [73] and rotators [74,75], waveguide crossings and bends [76,77], mode converts [78] and multiplexers [79,80].”
BackgroundNonlinear multimode photonics on‐chip
Vitali, V., Bucio, T. D., Liu, H., Haines, J., Naik, P. U., Guasoni, M., Gardes, F. Y., Pavesi, L., Cristiani, I., Lacava, C., et al. (2025) · Nanophotonics · doi:10.1515/nanoph-2025-0105 · Cited by 8
“This spatial control further allows for efficient on-chip separation and manipulation of photons using DCs and modal interferometers [103], [104].”
Generation and characterization of discrete spatial entanglement in multimode nonlinear waveguides
Jachura, M., Karpiński, M., Banaszek, K., Bharadwaj, D., Lugani, J., & Thyagarajan, K. (2017) · Physical Review A · doi:10.1103/physreva.95.032322 · Cited by 5
Dynamics of the Generation of Independent Orbital-Angular-Momentum Modes in a Photonic Chip
de Oliveira, J. M., Rocha, J. C. A., Santos, L. M. S., Moura, J. V. S., Jesus‐Silva, A. J., & Fonseca, E. J. S. (2023) · Physical Review Applied · doi:10.1103/physrevapplied.20.024004 · Cited by 4
Shujun, 刘. L., Ruoran, 刘. L., Xiaowan, 沈. S., Lijia, 宋. S., Dajian, 刘. L., Xiaolin, 易. Y., Weike, 赵. Z., Shihan, 洪. H., Long, 张. Z., & Daoxin Dai, A. (2024) · Acta Optica Sinica · doi:10.3788/aos241176 · Cited by 4
Scalable low-power silicon photonic platform for all-solid-state beam steering
Chang, Y.-C., Miller, S. A., Phare, C. T., Shin, M. C., Zadka, M., Roberts, S. P., Stern, B., Ji, X., Mohanty, A., Gordillo, O. A. J., et al. (2019) · Micro- and Nanotechnology Sensors, Systems, and Applications · doi:10.1117/12.2519803 · Cited by 4
Self-citationUltracompact high-Q whispering gallery mode microresonator in a non-closed waveguide path
Xiong, Z., Lin, T., Li, L., Deng, H., Wang, H., Fan, Y., Chen, S., Lü, J., & Ni, Z. (2025) · Optics Express · doi:10.1364/oe.578392 · Cited by 3
“We design an ultra-compact high-Q WGMR within an open curve waveguide by leveraging the mode multiplexing technique [24–26].”
Hybrid path-transverse electric mode qudit encoding on an integrated photonic chip
Forbes, I., Yard, P., Bielak, M., Thomas, M. A., Jones, M. S., Paesani, S., Borghi, M., & Laing, A. (2026) · Optica Quantum · doi:10.1364/opticaq.597128 · Cited by 3
Supporting quantum technologies with a micron-scale silicon photonics platform
Cherchi, M., Bera, A., Kemppinen, A., Nissilä, J., Tappura, K., Caputo, M., Lehtimäki, L., Lehtinen, J. S., Govenius, J., Prunnila, M., et al. (2022) · Integrated Optics: Devices, Materials, and Technologies · doi:10.1117/12.2612182 · Cited by 3
Optimization of heterogeneously integrated InP-Si on-chip photonic components
Mrowiński, P., Holewa, P., Sakanas, A., Sek, G., Semenova, E. S., & Syperek, M. (2022) · Optics Express · doi:10.1364/oe.474259 · Cited by 3
Zhang, G., Liu, H., Jia, S., Li, H., Li, Z., Gong, Q., & Chen, J. (2020) · Advanced Quantum Technologies · doi:10.1002/qute.202000033 · Cited by 3
de Cabo, R. F., Sánchez‐Sánchez, A., Ruano, P. N., Prosopio-Galarza, R., Melati, D., Alonso‐Ramos, C., Velasco, A. V., & González‐Andrade, D. (2026) · Laser & Photonics Review · doi:10.1002/lpor.202500768 · Cited by 2
“…optics, spatial modes serve as a high-dimensional encoding basis in integrated quantum photonics, where the controlled generation of stable modal superpositions is crucial for implementing transverse mode-encoded quantum gates and achieving quantum interference between spatial modes [ 18, 28 ].”
Hybridized-band parametric oscillations in coupled Kerr microresonators
Trinchão, L. O., Peres, L., Gonçalves, E. S., Nienstedt, M., dos Santos, L. F., Jarschel, P. F., Alegre, T. P. M., Tomazio, N. B., & Wiederhecker, G. S. (2026) · APL Photonics · doi:10.1063/5.0328178 · Cited by 2
“The mode hybridization across the spectrum can be studied by examining the coupling matrix [1]: Here, µ indexes the azimuthal modes of the bare ring resonator, whose optical frequency is given by ω int ( µ ) .”
Silicon-based photonic quantum information technologies
Gong, Q., Bao, J., Wang, J., Ding, Y., & Chen, X. (2020) · Zhongguo kexue. Wulixue Lixue Tianwenxue · doi:10.1360/sspma-2020-0043 · Cited by 1
Generation and Control of Higher-Order-Mode Lasers in Multimode Silicon Resonators
Gao, H., Ghosh, A., Pal, A., Zhong, K., Yan, H., Zhang, H., Zhuang, Y., Xu, K., Sun, L., Zhang, S., et al. (2025) · ACS Photonics · doi:10.1021/acsphotonics.5c00198 · Cited by 1
Sub-volt dual-drive silicon Mach–Zehnder modulator with an energy efficiency of 60 fJ bit −1
Li, M., Wang, H., Jiang, H., Zhang, Y., & Zhang, Z. (2025) · Journal of Optics · doi:10.1088/2040-8986/ae1c4c · Cited by 1
“Beyond the traditional role in data communications, EO modulators have emerged as indispensable components in integrated quantum optical systems [36–38].”
Guo, Z., Zhao, W., Wu, S., Lai, Y., Cheng, S., & Daoxin Dai, A. (2025) · Nanophotonics · doi:10.1515/nanoph-2025-0364 · Cited by 1
“Beyond telecommunications, such mode engineering has catalyzed innovations across quantum photonic circuits [4], [5], neuro-inspired computing [6], biochemical sensing devices [7], optical switches [8], interpath routing [9], and nonlinear optical phenomena manipulation [10].”
Effect of waveguide wall roughness on quantum signal transmission
azough, E., Ahmadi, H., & Rostami, A. (2025) · Scientific Reports · doi:10.1038/s41598-025-31901-6 · Cited by 1
“…in photonic quantum circuits 19–23 . ññatial modes method is of increasing interest due to its compatibility with other quantum applications, such as implementing quantum interference 21 , on-chip transverse-mode entangled photon pair sources 22 , and 2-qubit quantum gates with mode encoding 23 .”
Topological Hong-Ou-Mandel interference via compact edge modes
Guo, S., Yang, C., Chuang, J., LI, J., Ke, S., & Tian, Z.-N. (2026) · Optics Letters · doi:10.1364/ol.587730 · Cited by 1
Roque, J. A., Peace, D., White, S., Polino, E., Das, S., Ghafari, F., Slussarenko, S., Tischler, N., & Romero, J. (2026) · APL Photonics · doi:10.1063/5.0299808 · Cited by 2
Quantum Interference Dynamics in Chip-Scale Photonic Boson Sampling Circuit
Yadav, G. K., Kumar, S. K. S., Pathak, C., & Kumar (2026) · IEEE Journal of Quantum Electronics · doi:10.1109/jqe.2026.3695457 · Cited by 1
“This Hamiltonian is equivalent to a six-mode coupled-waveguide lattice, where photons coherently spread across output channels [25].”
Theoretical framework for chip-scale wavefront shaping with transverse spatial mode modulation
Harrington, D. M., Cohen, A. H., Davis, J., & Mohanty, A. (2025) · Optics Express · doi:10.1364/oe.558486 · Cited by 2
Self-citationWidth‐Independent and Robust Multimode Interference Waveguides Based on Anomalous Bulk States
Liu, L., Zhang, X., Lu, M., & Chen, Y. (2025) · Laser & Photonics Review · doi:10.1002/lpor.202500943 · Cited by 1
Donvalkar, P. S. (2017) · eCommons (Cornell University) · doi:10.7298/x45d8q0p
“tential in developing compact devices for frequency comb generation [118, 119], spectroscopy [120] and quantum information processing [37, 39, 50, 121, 122].”
BackgroundMethodDomeneguetti, R. R. (2019) · Digital Library of Theses and Dissertations (Universidade de São Paulo) · doi:10.11606/t.43.2019.tde-14022019-165455
Xiang, J., Tao, Z., Guo, X., Zhang, Y., Zhao, Y., & Su, Y. (2020) · arXiv (Cornell University) · doi:10.48550/arxiv.2006.08552
Two-photon scattering effect of a single Mie scatterer
Hong, P. (2021) · Journal of the Optical Society of America B · doi:10.1364/josab.445165
Enhanced Control of Intermodal Coupling in Photonic Waveguides
Fried, N. M., & Dutt, A. (2023) · Conference on Lasers and Electro-Optics · doi:10.1364/cleo_at.2023.jw2a.62
Self-citationVisible Photonic Integrated Circuits: From Neuroscience to Quantum Applications
Mohanty, A. (2023) · Frontiers in Optics · doi:10.1364/fio.2023.fm5b.1
Self-citationSimulation of a two-qubit quantum gate based on classical transverse spatial waveguide mode encoding
Liu, H., Zhang, Y., Xianing, F., & Lianfu, W. (2024) · Optics Continuum · doi:10.1364/optcon.527495 · Cited by 1
Revised Perturbation Theory for Shifting Geometric Interfaces in High-Contrast Nanophotonics
Fried, N. R., & Dutt, A. (2024) · ACS Photonics · doi:10.1021/acsphotonics.4c01130
Self-citationOn-chip Quantum Interference of Transverse Modes with Inverse Designed Structures
Roque, J. A., Peace, D., White, S., Polino, E., Das, S., Slussarenko, S., Tischler, N., & Romero, J. (2024) · Frontiers in Optics · doi:10.1364/fio.2024.fw7d.3
Song, J., & Sohn, Y.-I. (2025) · Optics Express · doi:10.1364/oe.567425 · Cited by 4
“Recent studies have further explored the use of multimode waveguides in quantum applications, including quantum interference [20] and the formation of photonic molecules [21], unlocking new possibilities for quantum phenomena and novel photonic interactions.”
Coherent control of noise in multimode nonlinear optics
Uddin, S. Z., Sloan, J., Horodynski, M., Salamin, Y., Birk, M., Sidorenko, P., Kaminer, I. E., Marin Soljacic, A., & Rivera, N. (2025) · Conference on Lasers and Electro-Optics · doi:10.1364/cleo_fs.2025.ff149_2
Metadata
- Authors
- Mohanty, A., Zhang, M., Dutt, A., Ramelow, S., Nussenzveig, P., & Lipson, M.
- Affiliations
- Cornell University (US)
- Harvard University (US)
- Universidade de São Paulo (BR)
- Corresponding author
- Lipson, Michal
- Venue
- Nature Communications
- Published
- 2017-01-20
- Volume
- 8
- Issue
- 1
- Pages
- 14010-14010
- ISSN
- 2041-1723 (ISSN-L)
- PMC
- PMC5263888
- OpenAlex
- W2225274677
- Cited by
- 103
- References
- 45
- Citations by year
- 2026: 5 · 2025: 17 · 2024: 17 · 2023: 12 · 2022: 10 · 2021: 10 · 2020: 9 · 2019: 11 · 2018: 7 · 2017: 4
- FWCI
- 5.06
- Type
- journal article
- Language
- en
- Open access
- gold
- doi.org
- Licence
- cc-by
- creativecommons.org/licenses/by/4.0 (tdm)
- creativecommons.org/licenses/by/4.0 (vor)
- Locations
- Nature Communications (publishedVersion, cc-by)
- Europe PMC (PubMed Central) (publishedVersion, cc-by)
- PubMed Central (publishedVersion, cc-by)
- PubMed (publishedVersion)
- arXiv (Cornell University) (submittedVersion)
- Digital Access to Scholarship at Harvard (DASH) (Harvard University) (submittedVersion, cc-by)
- RePEc: Research Papers in Economics (submittedVersion)
- DOAJ (DOAJ: Directory of Open Access Journals) (submittedVersion, cc-by-sa)
- arXiv (Cornell University)
- Greater South Information System
- Funders
- National Science Foundation (1542081, 1144153, 0812072)
- European Commission (329851)
- Fundação de Amparo à Pesquisa do Estado de São Paulo
- Conselho Nacional de Desenvolvimento Científico e Tecnológico
- Division of Electrical, Communications and Cyber Systems (1542081, ECCS-1542081)
- Topics
- Physical Sciences › Physics and Astronomy › Atomic and Molecular Physics, and Optics › Quantum Information and Cryptography
- Physical Sciences › Engineering › Electrical and Electronic Engineering › Photonic and Optical Devices
- Physical Sciences › Computer Science › Artificial Intelligence › Quantum Computing Algorithms and Architecture
- Keywords
- quantum interference, transverse spatial modes, multimode waveguides, integrated quantum optics, integrated photonics, quantum information processing, path encoding
About these checks
Registry, retraction, Cites and statistics results are computed, not judged, with one exception: a printed reference that no index lists is read once by a model before it counts as a citation error. Claims are extracted by a model and kept only when their quote appears verbatim in the text; each cited source is then checked, with a model’s help, for whether it says what the claim relies on. Those verdicts can be wrong — read the claim’s quote and the cited source before relying on one.
Statistics and arithmetic are recomputed, not judged.
Confidence bands are shown only for fields calibrated on our annotated test set. None is calibrated yet, so no band is shown.
What counts as a claim ›How we measure confidence ›How we check this ›
Are you an author, or do you see a problem with this page? Request a review
Data sources
Bibliographic data: Semantic Scholar, OpenAlex, Crossref.
Contains information from the Semantic Scholar Academic Graph Datasets, made available under the ODC Attribution License (ODC-BY 1.0).
Semantic Scholar’s data is described in: Kinney, R., et al. (2023). The Semantic Scholar Open Data Platform. arXiv:2301.10140.
