

The DOI matches its Crossref record; 6 of the 6 references it cites were found in a registry or an index.
Autophagosome–lysosome fusion is independent of V-ATPase-mediated acidification
Abstract
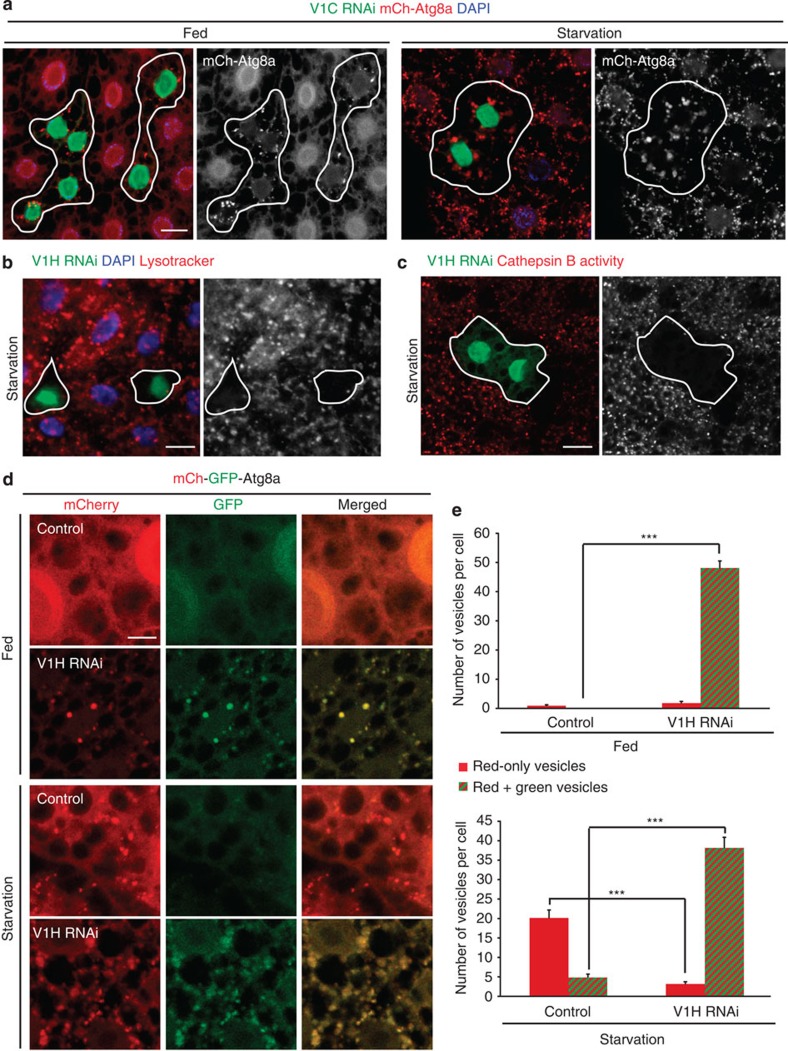
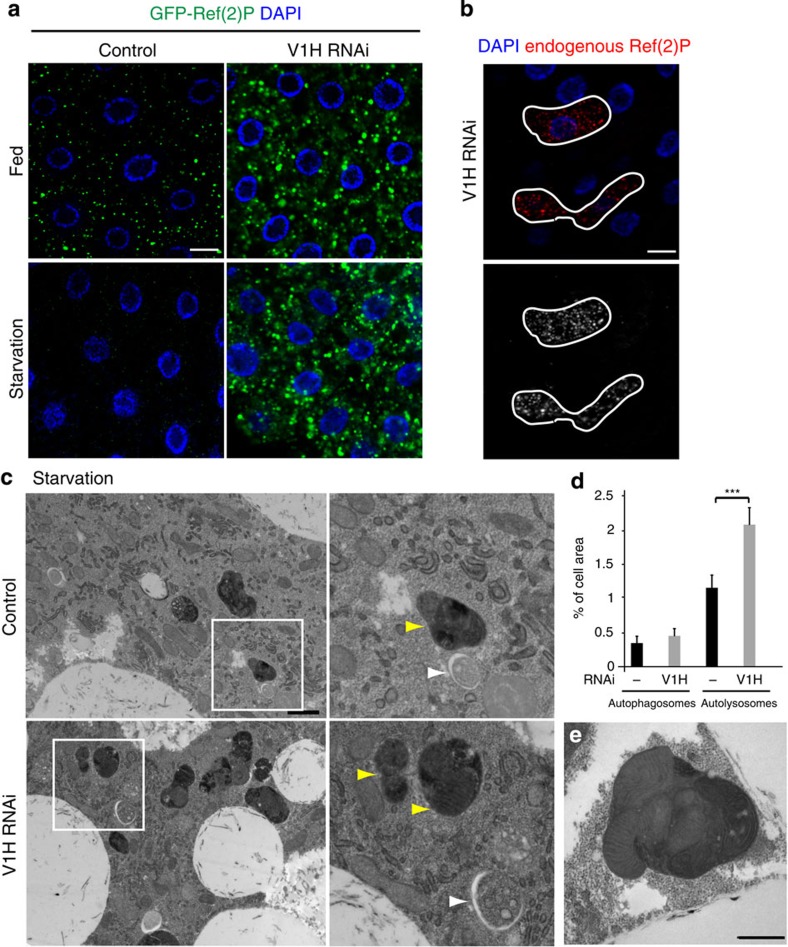
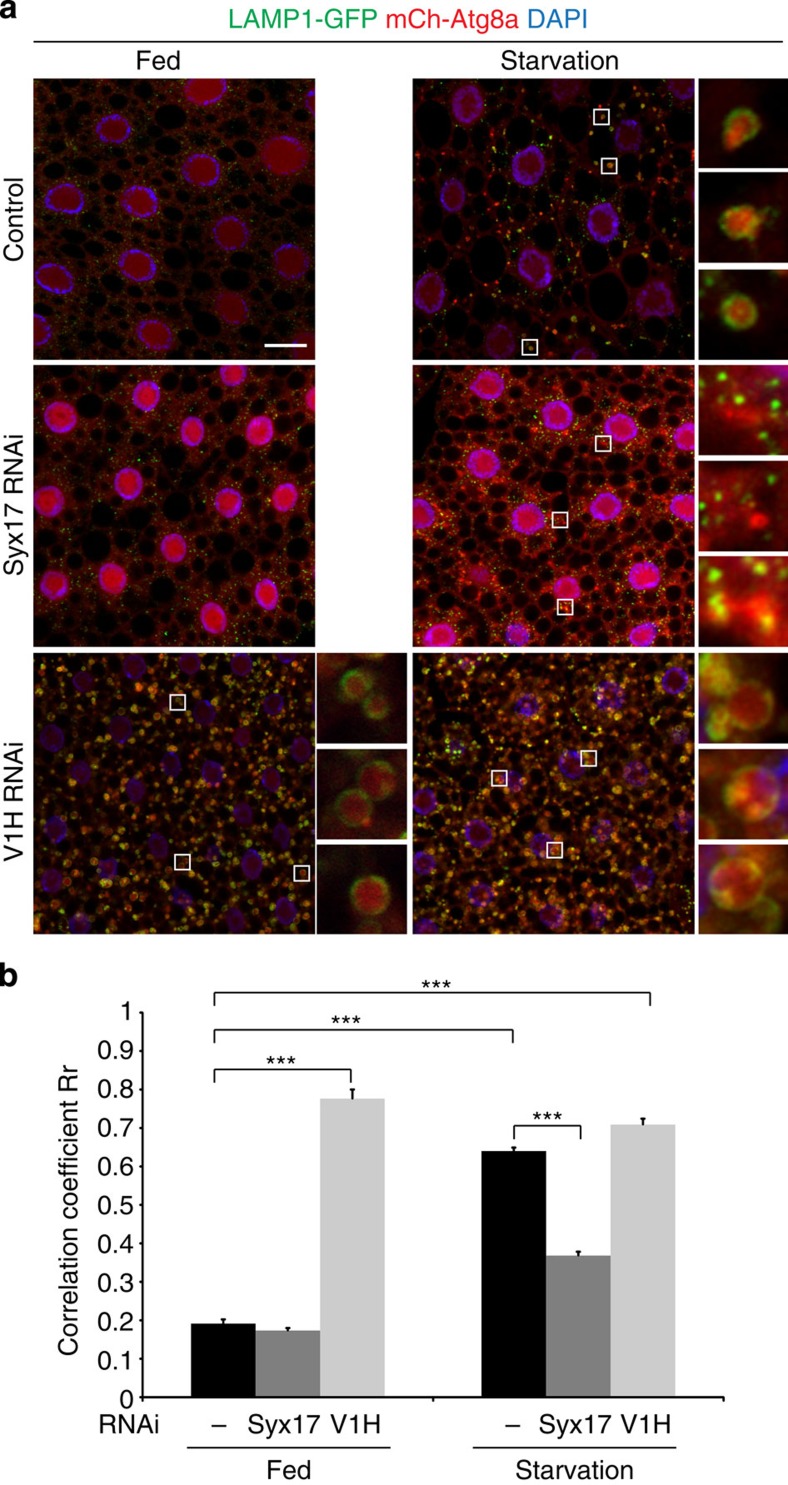
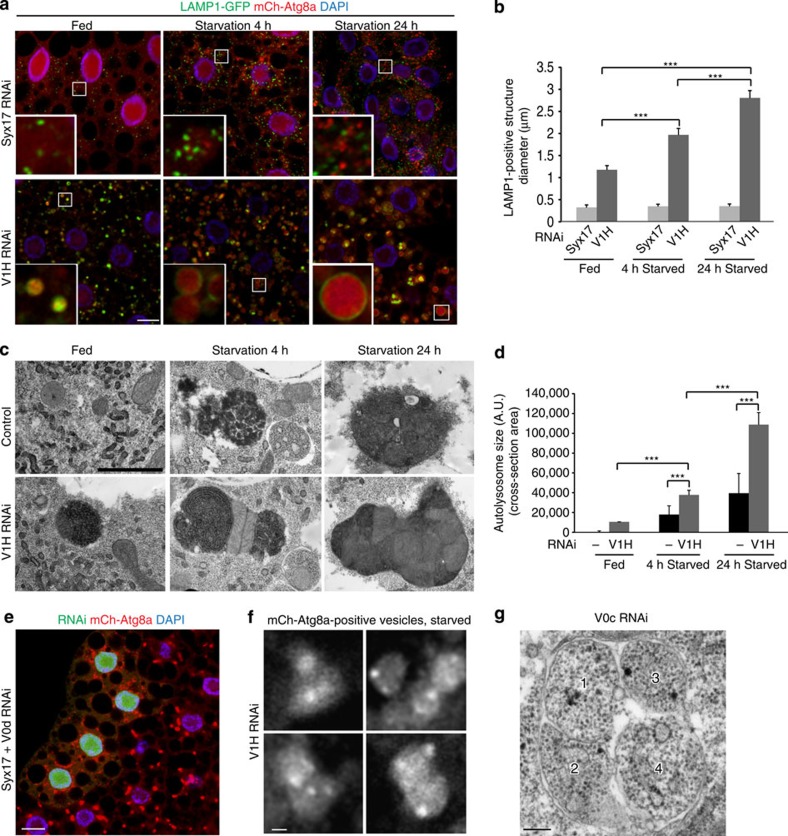
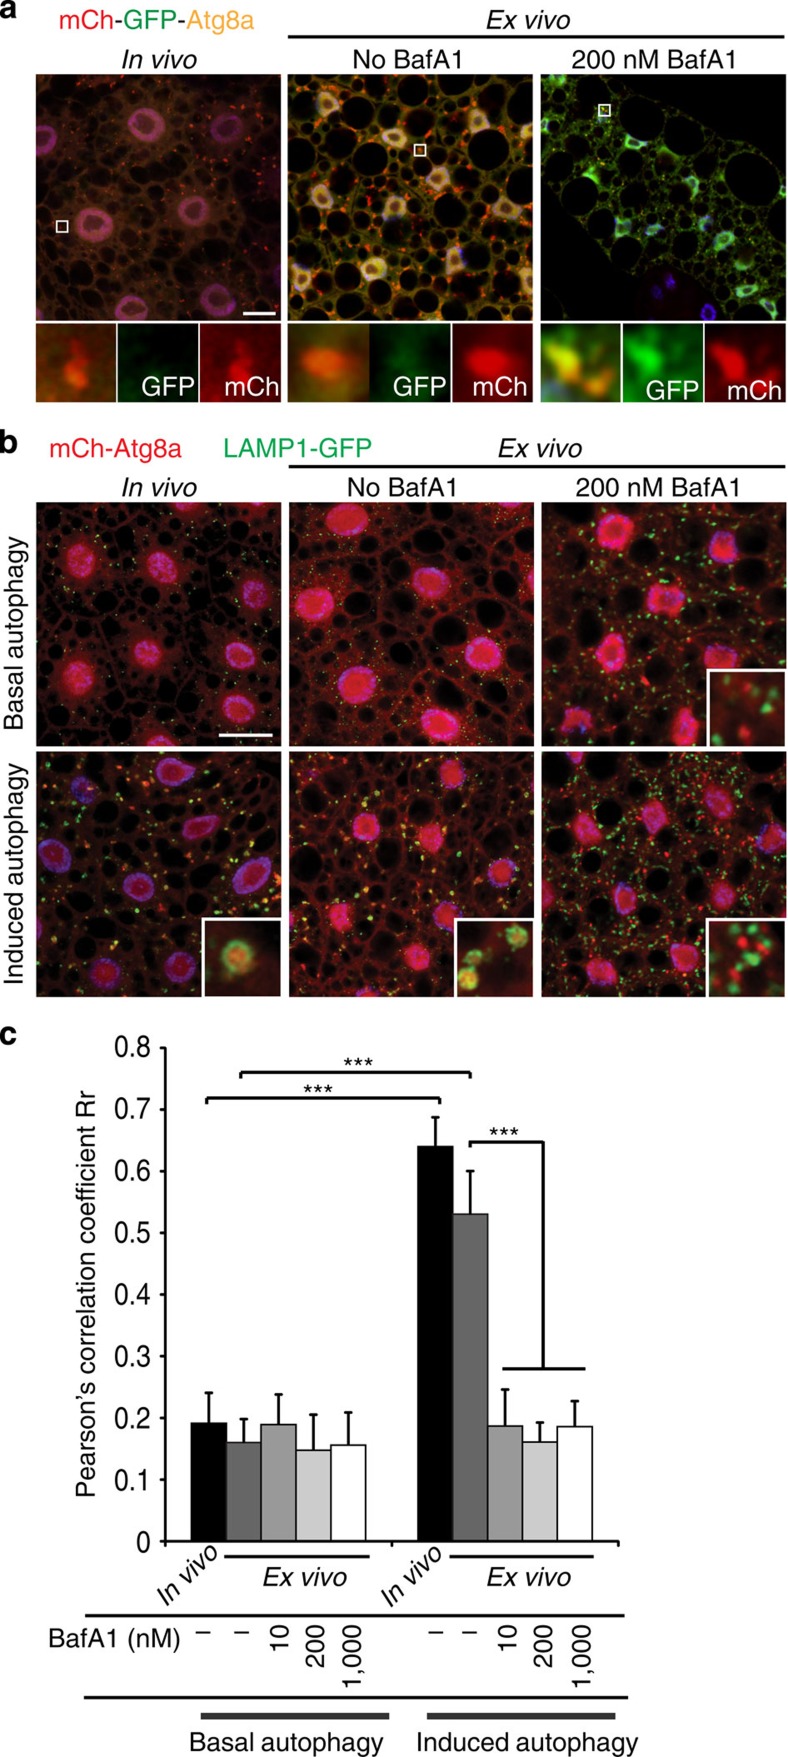
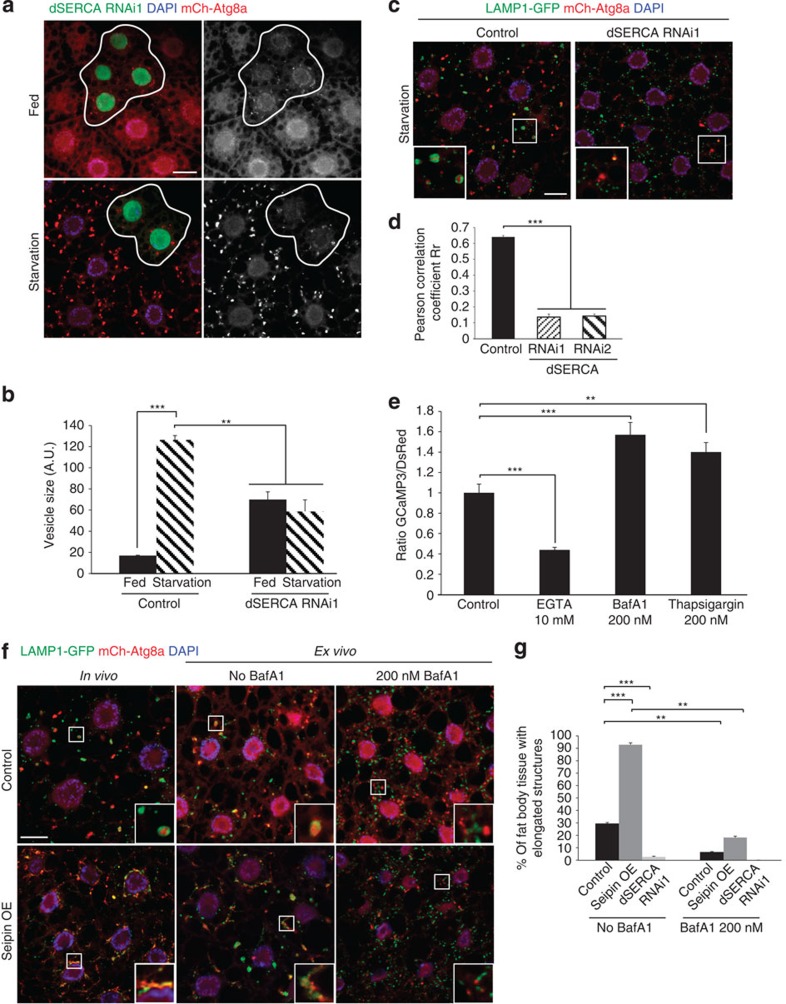
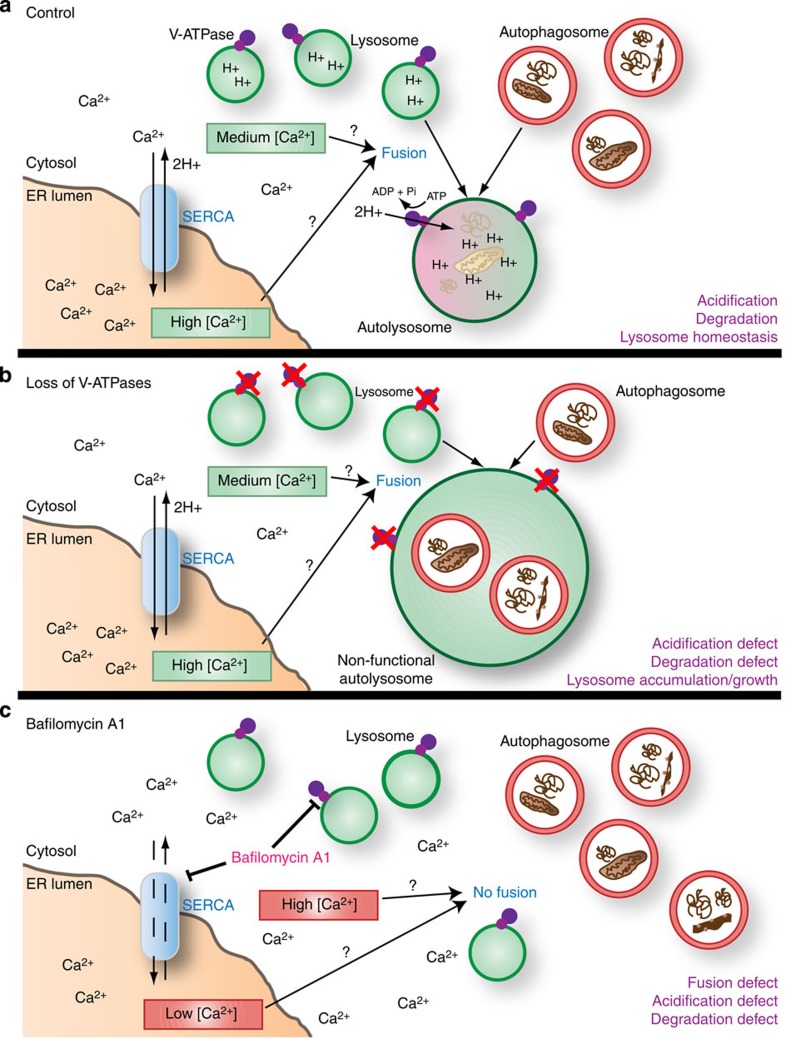
The ATP-dependent proton pump V-ATPase ensures low intralysosomal pH, which is essential for lysosomal hydrolase activity. Based on studies with the V-ATPase inhibitor BafilomycinA1, lysosomal acidification is also thought to be required for fusion with incoming vesicles from the autophagic and endocytic pathways. Here we show that loss of V-ATPase subunits in the Drosophila fat body causes an accumulation of non-functional lysosomes, leading to a block in autophagic flux. However, V-ATPase-deficient lysosomes remain competent to fuse with autophagosomes and endosomes, resulting in a time-dependent formation of giant autolysosomes. In contrast, BafilomycinA1 prevents autophagosome–lysosome fusion in these cells, and this defect is phenocopied by depletion of the Ca 2+ pump SERCA, a secondary target of this drug. Moreover, activation of SERCA promotes fusion in a BafilomycinA1-sensitive manner. Collectively, our results indicate that lysosomal acidification is not a prerequisite for fusion, and that BafilomycinA1 inhibits fusion independent of its effect on lysosomal pH.
Overview
The claims and statistics of this paper haven’t been checked yet.
Run the check — free, no account needed. It reads the open-access text and checks the sources it cites.
Integrity signals
Registry
Cites
Statistics
Figures
Verification
Claims the paper makes
The claims and statistics of this paper haven’t been checked yet.
Run the check — free, no account needed. It reads the open-access text and checks the sources it cites.
Claims other papers make about this one
Each is checked against this paper’s own text: does it say what the citing paper says it does?
The check wasn’t confident either way, so it gives no verdict — never disputed.
In the citing paper
“An additional caveat when using the photoactivatable construct PA-GFP [303] is that the process of activation by photons may induce DNA damage, which could, in turn, induce autophagy.”
From Guidelines for the use and interpretation of assays for monitoring autophagy (4th edition) 1 (2021) · cites this paper as [303]
Experimental — accuracy not yet measured
Self-check
Percentages, sums and reported differences re-computed from the paper’s own numbers.
The self-check needs the paper’s full text.
Citations
Cites
Guidelines for the use and interpretation of assays for monitoring autophagy
Klionsky, D. J., Abdalla, F. C., Abeliovich, H., Abraham, R. T., Acevedo-Arozena, A., Adeli, K., Agholme, L., Agnello, M., Agostinis, P., Aguirre-Ghiso, J. A., et al. (2012) · Autophagy · doi:10.4161/auto.19496 · Cited by 3,996 · cited 3×
“BafilomycinA1, a chemical inhibitor of the V-ATPase, is commonly used to block autophagosome-lysosome fusion in mammalian cell culture studies, and causes an accumulation of autophagosomes upon autophagy induction 14,24 .”
Self-citationKimura, S., Noda, T., & Yoshimori, T. (2007) · Autophagy · doi:10.4161/auto.4451 · Cited by 2,278
Yamamoto, A., Tagawa, Y., Yoshimori, T., Moriyama, Y., Masaki, R., & Tashiro, Y. (1998) · Cell Structure and Function · doi:10.1247/csf.23.33 · Cited by 1,312
Pryor, P. R., Mullock, B. M., Bright, N. A., Gray, S. R., & Luzio, J. P. (2000) · The Journal of Cell Biology · doi:10.1083/jcb.149.5.1053 · Cited by 347
Nezis, I. P., Shravage, B. V., Sagona, A. P., Lamark, T., Bjørkøy, G., Johansen, T., Rusten, T. E., Brech, A., Baehrecke, E. H., & Stenmark, H. (2010) · Journal of Cell Biology · doi:10.1083/jcb.201002035 · Cited by 252
Modulation of intracellular calcium homeostasis blocks autophagosome formation
Engedal, N., Torgersen, M. L., Guldvik, I. J., Barfeld, S. J., Bakula, D., Sætre, F., Hagen, L. K., Patterson, J. B., Proikas-Cezanne, T., Seglen, P. O., et al. (2013) · Autophagy · doi:10.4161/auto.25900 · Cited by 104
Research works printed but not linked: 64
- Beau, I., Mehrpour, M. & Codogno, P. Autophagosomes and human diseases. Int. J. Biochem. Cell Biol. 43, 460–464 (2011). · DOI
- Mauvezin, C., Ayala, C., Braden, C. R., Kim, J. & Neufeld, T. P. Assays to monitor autophagy in Drosophila. Methods 68, 134–139 (2014). · DOI
- Shibutani, S. T. & Yoshimori, T. A current perspective of autophagosome biogenesis. Cell Res. 24, 58–68 (2014). · DOI
- Dechant, R. et al. Cytosolic pH is a second messenger for glucose and regulates the PKA pathway through V-ATPase. EMBO J. 29, 2515–2526 (2010). · DOI
- Alzamora, R. et al. PKA regulates vacuolar H+-ATPase localization and activity via direct phosphorylation of the a subunit in kidney cells. J. Biol. Chem. 285, 24676–24685 (2010). · DOI
- Marshansky, V. & Futai, M. The V-type H+-ATPase in vesicular trafficking: targeting, regulation and function. Curr. Opin. Cell Biol. 20, 415–426 (2008). · DOI
- Rath, S., Liebl, J., Furst, R., Vollmar, A. M. & Zahler, S. Regulation of endothelial signaling and migration by v-ATPase. Angiogenesis 17, 587–601 (2014). · DOI
- Hinton, A., Bond, S. & Forgac, M. V-ATPase functions in normal and disease processes. Pflugers Arch. 457, 589–598 (2009). · DOI
- Zhang, J., Feng, Y. & Forgac, M. Proton conduction and bafilomycin binding by the V0 domain of the coated vesicle V-ATPase. J. Biol. Chem. 269, 23518–23523 (1994). · DOI
- Yoshimori, T., Yamamoto, A., Moriyama, Y., Futai, M. & Tashiro, Y. Bafilomycin A1, a specific inhibitor of vacuolar-type H(+)-ATPase, inhibits acidification and protein degradation in lysosomes of cultured cells. J. Biol. Chem. 266, 17707–17712 (1991). · DOI
- Wang, D. et al. Ca2+-Calmodulin regulates SNARE assembly and spontaneous neurotransmitter release via v-ATPase subunit V0a1. J. Cell Biol. 205, 21–31 (2014). · DOI
- Marshansky, V., Rubinstein, J. L. & Gruber, G. Eukaryotic V-ATPase: novel structural findings and functional insights. Biochim. Biophys. Acta. 1837, 857–879 (2014). · DOI
- Forgac, M. Vacuolar ATPases: rotary proton pumps in physiology and pathophysiology. Nat. Rev. Mol. Cell Biol. 8, 917–929 (2007). · DOI
- Scott, R. C., Schuldiner, O. & Neufeld, T. P. Role and regulation of starvation-induced autophagy in the Drosophila fat body. Dev. Cell 7, 167–178 (2004). · DOI
- Rusten, T. E. et al. Programmed autophagy in the Drosophila fat body is induced by ecdysone through regulation of the PI3K pathway. Dev. Cell 7, 179–192 (2004). · DOI
- Lindmo, K. et al. The PI 3-kinase regulator Vps15 is required for autophagic clearance of protein aggregates. Autophagy 4, 500–506 (2008). · DOI
- Chang, Y. Y. & Neufeld, T. P. An Atg1/Atg13 complex with multiple roles in TOR-mediated autophagy regulation. Mol. Biol. Cell 20, 2004–2014 (2009). · DOI
- Nezis, I. P. et al. Ref(2)P, the Drosophila melanogaster homologue of mammalian p62, is required for the formation of protein aggregates in adult brain. J. Cell Biol. 180, 1065–1071 (2008). · DOI · Paper page
- Pircs, K. et al. Advantages and limitations of different p62-based assays for estimating autophagic activity in Drosophila. PLoS ONE 7, e44214 (2012). · DOI
- Kovacs, A. L., Reith, A. & Seglen, P. O. Accumulation of autophagosomes after inhibition of hepatocytic protein degradation by vinblastine, leupeptin or a lysosomotropic amine. Exp. Cell Res. 137, 191–201 (1982). · DOI · Paper page
- Klionsky, D. J., Elazar, Z., Seglen, P. O. & Rubinsztein, D. C. Does bafilomycin A1 block the fusion of autophagosomes with lysosomes? Autophagy 4, 849–850 (2008). · DOI · Paper page
- Drose, S. & Altendorf, K. Bafilomycins and concanamycins as inhibitors of V-ATPases and P-ATPases. J. Exp. Biol. 200, 1–8 (1997). · DOI
- Takats, S. et al. Autophagosomal Syntaxin17-dependent lysosomal degradation maintains neuronal function in Drosophila. J. Cell Biol. 201, 531–539 (2013). · DOI
- Itakura, E., Kishi-Itakura, C. & Mizushima, N. The hairpin-type tail-anchored SNARE syntaxin 17 targets to autophagosomes for fusion with endosomes/lysosomes. Cell 151, 1256–1269 (2012). · DOI
- Baba, M., Osumi, M. & Ohsumi, Y. Analysis of the membrane structures involved in autophagy in yeast by freeze-replica method. Cell Struct. Funct. 20, 465–471 (1995). · DOI · Paper page
- Takeshige, K., Baba, M., Tsuboi, S., Noda, T. & Ohsumi, Y. Autophagy in yeast demonstrated with proteinase-deficient mutants and conditions for its induction. J. Cell Biol. 119, 301–311 (1992). · DOI
- Bowman, B. J. & Bowman, E. J. Mutations in subunit C of the vacuolar ATPase confer resistance to bafilomycin and identify a conserved antibiotic binding site. J. Biol. Chem. 277, 3965–3972 (2002). · DOI
- Jahreiss, L., Menzies, F. M. & Rubinsztein, D. C. The itinerary of autophagosomes: from peripheral formation to kiss-and-run fusion with lysosomes. Traffic. 9, 574–587 (2008). · DOI
- Kim, J. & Neufeld, T. P. Dietary sugar promotes systemic TOR activation in Drosophila through AKH-dependent selective secretion of Dilp3. Nat. Commun doi:10.1038/ncomms7846 (2015). · DOI
- Bowman, E. J., Siebers, A. & Altendorf, K. Bafilomycins: a class of inhibitors of membrane ATPases from microorganisms, animal cells, and plant cells. Proc. Natl Acad. Sci. USA 85, 7972–7976 (1988). · DOI
- Gunteski-Hamblin, A. M., Greeb, J. & Shull, G. E. A novel Ca2+ pump expressed in brain, kidney, and stomach is encoded by an alternative transcript of the slow-twitch muscle sarcoplasmic reticulum Ca-ATPase gene. J. Biol. Chem. 263, 15032–15040 (1988). · DOI
- Lytton, J., Westlin, M. & Hanley, M. R. Thapsigargin inhibits the sarcoplasmic or endoplasmic reticulum Ca-ATPase family of calcium pumps. J. Biol. Chem. 266, 17067–17071 (1991). · DOI
- Ganley, I. G., Wong, P. M., Gammoh, N. & Jiang, X. Distinct autophagosomal-lysosomal fusion mechanism revealed by thapsigargin-induced autophagy arrest. Mol. Cell 42, 731–743 (2011). · DOI
- Bi, J. et al. Seipin promotes adipose tissue fat storage through the ER Ca(2)(+)-ATPase SERCA. Cell Metab. 19, 861–871 (2014). · DOI
- Sagne, C. & Gasnier, B. Molecular physiology and pathophysiology of lysosomal membrane transporters. J. Inherit. Metab. Dis. 31, 258–266 (2008). · DOI
- Christensen, K. A., Myers, J. T. & Swanson, J. A. pH-dependent regulation of lysosomal calcium in macrophages. J. Cell Sci. 115, 599–607 (2002). · DOI
- Strasser, B., Iwaszkiewicz, J., Michielin, O. & Mayer, A. The V-ATPase proteolipid cylinder promotes the lipid-mixing stage of SNARE-dependent fusion of yeast vacuoles. EMBO J. 30, 4126–4141 (2011). · DOI
- Williamson, W. R., Wang, D., Haberman, A. S. & Hiesinger, P. R. A dual function of V0-ATPase a1 provides an endolysosomal degradation mechanism in Drosophila melanogaster photoreceptors. J. Cell Biol. 189, 885–899 (2010). · DOI
- Baars, T. L., Petri, S., Peters, C. & Mayer, A. Role of the V-ATPase in regulation of the vacuolar fission-fusion equilibrium. Mol. Biol. Cell. 18, 3873–3882 (2007). · DOI
- Coonrod, E. M. et al. Homotypic vacuole fusion in yeast requires organelle acidification and not the V-ATPase membrane domain. Dev. Cell 27, 462–468 (2013). · DOI
- Poea-Guyon, S. et al. The V-ATPase membrane domain is a sensor of granular pH that controls the exocytotic machinery. J. Cell Biol. 203, 283–298 (2013). · DOI
- Kawai, A., Uchiyama, H., Takano, S., Nakamura, N. & Ohkuma, S. Autophagosome-lysosome fusion depends on the pH in acidic compartments in CHO cells. Autophagy 3, 154–157 (2007). · DOI
- Mangieri, L. R. et al. ATP6V0C knockdown in neuroblastoma cells alters autophagy-lysosome pathway function and metabolism of proteins that accumulate in neurodegenerative disease. PLoS ONE 9, e93257 (2014). · DOI
- Sobota, J. A., Back, N., Eipper, B. A. & Mains, R. E. Inhibitors of the V0 subunit of the vacuolar H+-ATPase prevent segregation of lysosomal- and secretory-pathway proteins. J. Cell Sci. 122, 3542–3553 (2009). · DOI
- Teplova, V. V., Tonshin, A. A., Grigoriev, P. A., Saris, N. E. & Salkinoja-Salonen, M. S. Bafilomycin A1 is a potassium ionophore that impairs mitochondrial functions. J. Bioenerg. Biomembr. 39, 321–329 (2007). · DOI
- Shacka, J. J. et al. Bafilomycin A1 inhibits chloroquine-induced death of cerebellar granule neurons. Mol. Pharmacol. 69, 1125–1136 (2006). · DOI
- Lopez, J. J., Camello-Almaraz, C., Pariente, J. A., Salido, G. M. & Rosado, J. A. Ca2+ accumulation into acidic organelles mediated by Ca2+- and vacuolar H+-ATPases in human platelets. Biochem. J. 390, 243–252 (2005). · DOI
- Goldman, F. D. et al. Hydroxychloroquine inhibits calcium signals in T cells: a new mechanism to explain its immunomodulatory properties. Blood 95, 3460–3466 (2000). · DOI
- Minelli, A., Lyons, S., Nolte, C., Verkhratsky, A. & Kettenmann, H. Ammonium triggers calcium elevation in cultured mouse microglial cells by initiating Ca(2+) release from thapsigargin-sensitive intracellular stores. Pflugers Arch. 439, 370–377 (2000).
- Parkinson, K. et al. Calcium-dependent regulation of Rab activation and vesicle fusion by an intracellular P2X ion channel. Nat. Cell. Biol. 16, 87–98 (2014). · DOI
- Jena, B. P. Role of SNAREs in membrane fusion. Adv. Exp. Med. Biol. 713, 13–32 (2011). · DOI
- Hay, J. C. Calcium: a fundamental regulator of intracellular membrane fusion? EMBO Rep. 8, 236–240 (2007). · DOI
- Kilpatrick, B. S., Eden, E. R., Schapira, A. H., Futter, C. E. & Patel, S. Direct mobilisation of lysosomal Ca2+ triggers complex Ca2+ signals. J. Cell Sci. 126, 60–66 (2013). · DOI
- Morgan, A. J. et al. Bidirectional Ca(2)(+) signaling occurs between the endoplasmic reticulum and acidic organelles. J. Cell Biol. 200, 789–805 (2013). · DOI
- Lopez-Sanjurjo, C. I., Tovey, S. C., Prole, D. L. & Taylor, C. W. Lysosomes shape Ins(1,4,5)P3-evoked Ca2+ signals by selectively sequestering Ca2+ released from the endoplasmic reticulum. J. Cell Sci. 126, 289–300 (2013). · DOI
- Wong, C. O., Li, R., Montell, C. & Venkatachalam, K. Drosophila TRPML is required for TORC1 activation. Curr. Biol. 22, 1616–1621 (2012). · DOI
- Park, H. W. et al. Pharmacological correction of obesity-induced autophagy arrest using calcium channel blockers. Nat. Commun. 5, 4834 (2014). · DOI
- Decuypere, J. P., Bultynck, G. & Parys, J. B. A dual role for Ca(2+) in autophagy regulation. Cell Calcium 50, 242–250 (2011). · DOI
- Arsham, A. M. & Neufeld, T. P. A genetic screen in Drosophila reveals novel cytoprotective functions of the autophagy-lysosome pathway. PLoS ONE 4, e6068 (2009). · DOI
- Zhang, J. et al. Thirty-one flavors of Drosophila rab proteins. Genetics 176, 1307–1322 (2007). · DOI
- Buechling, T. et al. Wnt/Frizzled signaling requires dPRR, the Drosophila homolog of the prorenin receptor. Curr. Biol. 20, 1263–1268 (2010). · DOI
- Pulipparacharuvil, S. et al. Drosophila Vps16A is required for trafficking to lysosomes and biogenesis of pigment granules. J. Cell. Sci. 118, 3663–3673 (2005). · DOI
- Sun, X. R. et al. Fast GCaMPs for improved tracking of neuronal activity. Nat. Commun. 4, 2170 (2013). · DOI
- Hennig, K. M., Colombani, J. & Neufeld, T. P. TOR coordinates bulk and targeted endocytosis in the Drosophila melanogaster fat body to regulate cell growth. J. Cell Biol. 173, 963–974 (2006). · DOI
Cited by
Sorted by citations
Guidelines for the use and interpretation of assays for monitoring autophagy (3rd edition).
Klionsky, D. J., Abdelmohsen, K., Abe, A., Abedin, M. J., Abeliovich, H., Acevedo Arozena, A., Adachi, H., Adams, C. M., Adams, P. D., Adeli, K., et al. (2016) · Autophagy · doi:10.1080/15548627.2015.1100356 · Cited by 5,894
Self-citationGuidelines for the use and interpretation of assays for monitoring autophagy (4th edition) 1
Klionsky, D. J., Abdel-Aziz, A. K., Abdelfatah, S., Abdellatif, M., Abdoli, A., Abel, S., Abeliovich, H., Abildgaard, M. H., Abudu, Y. P., Acevedo-Arozena, A., et al. (2021) · Autophagy · doi:10.1080/15548627.2020.1797280 · Cited by 2,897
Self-citationChloroquine inhibits autophagic flux by decreasing autophagosome-lysosome fusion
Mauthe, M., Orhon, I., Rocchi, C., Zhou, X., Luhr, M., Hijlkema, K.-J., Coppes, R. P., Engedal, N., Mari, M., & Reggiori, F. (2018) · Autophagy · doi:10.1080/15548627.2018.1474314 · Cited by 2,122
Lőrincz, P., & Juhász, G. (2020) · Journal of Molecular Biology · doi:10.1016/j.jmb.2019.10.028 · Cited by 328
Self-citationTargeting lysosomes in human disease: from basic research to clinical applications
Cao, M., Luo, X., Wu, K., & He, X. (2021) · Signal Transduction and Targeted Therapy · doi:10.1038/s41392-021-00778-y · Cited by 225
TDP‐43 loss of function increases TFEB activity and blocks autophagosome–lysosome fusion
Xia, Q., Wang, H., Hao, Z., Fu, C., Hu, Q., Gao, F., Ren, H., Chen, D., Han, J., Ying, Z., et al. (2016) · The EMBO Journal · doi:10.15252/embj.201591998 · Cited by 195
Drug Delivery with polymeric nanocarriers-cellular uptake mechanisms
Nelemans, L. C., & Gurevich, L. (2020) · Materials · doi:10.3390/ma13020366 · Cited by 173
Silva, M. C., Nandi, G. A., Tentarelli, S., Gurrell, I. K., Jamier, T., Lucente, D., Dickerson, B. C., Brown, D. G., Brandon, N. J., & Haggarty, S. J. (2020) · Nature Communications · doi:10.1038/s41467-020-16984-1 · Cited by 157
Ubiquilins regulate autophagic flux through mTOR signalling and lysosomal acidification
Şentürk, M., Lin, G., Zuo, Z., Mao, D., Watson, E., Mikos, A. G., & Bellen, H. J. (2019) · Nature Cell Biology · doi:10.1038/s41556-019-0281-x · Cited by 124
Ca2+ Dyshomeostasis Disrupts Neuronal and Synaptic Function in Alzheimer’s Disease
McDaid, J., Mustaly-Kalimi, S., & Stutzmann, G. E. (2020) · Cells · doi:10.3390/cells9122655 · Cited by 73
The GATOR2 Component Wdr24 Regulates TORC1 Activity and Lysosome Function
Cai, W., Wei, Y., Jarnik, M., Reich, J., & Lilly, M. A. (2016) · PLOS Genetics · doi:10.1371/journal.pgen.1006036 · Cited by 61
Autolysosome biogenesis and developmental senescence are regulated by both Spns1 and v-ATPase
Sasaki, T., Lian, S., Khan, A., Llop, J. R., Samuelson, A. V., Chen, W., Klionsky, D. J., & Kishi, S. (2017) · Autophagy · doi:10.1080/15548627.2016.1256934 · Cited by 60
Hannan, S. B., Dräger, N. M., Rasse, T. M., Voigt, A., & Jahn, T. R. (2016) · Journal of Neurochemistry · doi:10.1111/jnc.13532 · Cited by 38
Balsamo, J. A., Penton, K. E., Zhao, Z., Hayes, M. J., Lima, S. M., Irish, J. M., & Bachmann, B. O. (2022) · Journal of Biological Chemistry · doi:10.1016/j.jbc.2022.102300 · Cited by 12
Metadata
- Authors
- Mauvezin, C., Nagy, P., Juhász, G., & Neufeld, T. P.
- ORCID
- Mauvezin, Caroline
- Venue
- Nature Communications
- Published
- 2015-05-11
- Volume
- 6
- Issue
- 1
- ISSN
- 2041-1723
- PMC
- PMC4428688
- Cited by
- 424
- References
- 6
- Language
- en
About these checks
Registry, retraction, Cites and statistics results are computed, not judged, with one exception: a printed reference that no index lists is read once by a model before it counts as a citation error. Claims are extracted by a model and kept only when their quote appears verbatim in the text; each cited source is then checked, with a model’s help, for whether it says what the claim relies on. Those verdicts can be wrong — read the claim’s quote and the cited source before relying on one.
Statistics and arithmetic are recomputed, not judged.
Confidence bands are shown only for fields calibrated on our annotated test set. None is calibrated yet, so no band is shown.
What counts as a claim ›How we measure confidence ›How we check this ›
Are you an author, or do you see a problem with this page? Request a review
