

An insula-frontostriatal network mediates flexible cognitive control by adaptively predicting changing control demands
Open accessThe DOI matches its Crossref record; 54 of the 55 references it cites were found in a registry or an index.
Abstract
The anterior cingulate and lateral prefrontal cortices have been implicated in implementing context-appropriate attentional control, but the learning mechanisms underlying our ability to flexibly adapt the control settings to changing environments remain poorly understood. Here we show that human adjustments to varying control demands are captured by a reinforcement learner with a flexible, volatility-driven learning rate. Using model-based functional magnetic resonance imaging, we demonstrate that volatility of control demand is estimated by the anterior insula, which in turn optimizes the prediction of forthcoming demand in the caudate nucleus. The caudate’s prediction of control demand subsequently guides the implementation of proactive and reactive attentional control in dorsal anterior cingulate and dorsolateral prefrontal cortices. These data enhance our understanding of the neuro-computational mechanisms of adaptive behaviour by connecting the classic cingulate-prefrontal cognitive control network to a subcortical control-learning mechanism that infers future demands by flexibly integrating remote and recent past experiences.
Overview
The claims and statistics of this paper haven’t been checked yet.
Free: it reads the open-access text and checks the first 5 claims that cite a source we can check. Create a free account to check every claim.
Integrity signals
Registry
Cites
Statistics
Figures



Verification
Claims the paper makes
The claims and statistics of this paper haven’t been checked yet.
Free: it reads the open-access text and checks the first 5 claims that cite a source we can check. Create a free account to check every claim.
Claims other papers make about this one
Each is checked against this paper’s own text: does it say what the citing paper says it does?
In the citing paper
“In addition to emotional perception, the AI is proposed to estimate changing environmental demands to modulate flexible cognitive control (Jiang et al., 2015).”
From Cortico-striatal-thalamic loop circuits of the salience network: A central pathway in psychiatric disease and treatment (2016) · cites this paper as Jiang et al., 2015
Self-check
Percentages, sums and reported differences re-computed from the paper’s own numbers.
The self-check needs the paper’s full text.
Citations
Cites
An Integrative Theory of Prefrontal Cortex Function
Miller, E. K., & Cohen, J. D. (2001) · Annual Review of Neuroscience · doi:10.1146/annurev.neuro.24.1.167 · Cited by 12,803 · cited 1×
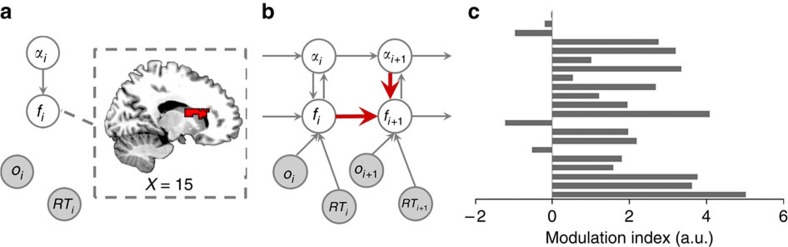
“1a, lower panel), namely (1) the (volatility-driven) flexible LR (a) that quantifies the model’s (or a subject’s) belief concerning the rate of change of control demand (here, trial congruency) in the environment; (2) predicted conflict (f) that represents the believed probability of encountering an incongruent trial;…”
BackgroundConflict monitoring and cognitive control
Botvinick, M. M., Braver, T. S., Barch, D. M., Carter, C. S., & Cohen, J. D. (2001) · Psychological Review · doi:10.1037/0033-295x.108.3.624 · Cited by 7,351
Spectral Analysis and Time Series
Preston, D. B. (1983) · Technometrics · doi:10.1080/00401706.1983.10487866 · Cited by 5,011
Functional architecture of basal ganglia circuits: neural substrates of parallel processing
Alexander, G. E., & Crutcher, M. D. (1990) · Trends in Neurosciences · doi:10.1016/0166-2236(90)90107-l · Cited by 4,131
Conflict monitoring and anterior cingulate cortex: an update
Botvinick, M. M., Cohen, J. D., & Carter, C. S. (2004) · Trends in Cognitive Sciences · doi:10.1016/j.tics.2004.10.003 · Cited by 3,623
Anterior Cingulate Conflict Monitoring and Adjustments in Control
Kerns, J. G., Cohen, J. D., MacDonald, A. W., Cho, R. Y., Stenger, V. A., & Carter, C. S. (2004) · Science · doi:10.1126/science.1089910 · Cited by 2,891
Distinct brain networks for adaptive and stable task control in humans
Dosenbach, N. U. F., Fair, D. A., Miezin, F. M., Cohen, A. L., Wenger, K. K., Dosenbach, R. A. T., Fox, M. D., Snyder, A. Z., Vincent, J. L., Raichle, M. E., et al. (2007) · Proceedings of the National Academy of Sciences · doi:10.1073/pnas.0704320104 · Cited by 2,632
Common regions of the human frontal lobe recruited by diverse cognitive demands
Duncan, J., & Owen, A. M. (2000) · Trends in Neurosciences · doi:10.1016/s0166-2236(00)01633-7 · Cited by 2,498
The variable nature of cognitive control: a dual mechanisms framework
Braver, T. S. (2012) · Trends in Cognitive Sciences · doi:10.1016/j.tics.2011.12.010 · Cited by 2,482
Information-based functional brain mapping
Kriegeskorte, N., Goebel, R., & Bandettini, P. (2006) · Proceedings of the National Academy of Sciences · doi:10.1073/pnas.0600244103 · Cited by 2,113
Cited by
Items 101–162 of 162
Wang, T., Wu, X., Jiang, J., Liu, C., & Zhu, M. (2019) · International Journal of Imaging Systems and Technology · doi:10.1002/ima.22387 · Cited by 6
Self-citationPastötter, B., Haciahmet, C. C., Beste, C., Münchau, A. M., & Frings, C. (2024) · Cerebral Cortex · doi:10.1093/cercor/bhae326 · Cited by 6
Gao, Y.-Y., Fang, Z., Zhou, Q., & Zhang, R. (2024) · BMC Psychology · doi:10.1186/s40359-024-01952-x · Cited by 3
Neural correlates of preferred activities: development of an interest-specific go/nogo task
Bos, D. J., Ajodan, E. L., Silverman, M. R., Dyke, J. P., Durston, S., Power, J. D., & Jones, R. M. (2017) · Social Cognitive and Affective Neuroscience · doi:10.1093/scan/nsx127 · Cited by 4
Ylinen, A., Hannula‐Sormunen, M. M., McMullen, J. A., Lehtinen, E., Wikman, P. A., & Alho, K. (2024) · European Journal of Neuroscience · doi:10.1111/ejn.16616 · Cited by 10
Teng, C., Fulvio, J. M., Pietrelli, M., Jiang, J., & Postle, B. R. (2025) · Journal of Cognitive Neuroscience · doi:10.1162/jocn_a_02310 · Cited by 3
Self-citationAge-related changes in Bayesian belief updating during attentional deployment and motor intention
Mengotti, P., Kuhns, A. B., Fink, G. R., & Vossel, S. (2019) · Psychological Research · doi:10.1007/s00426-019-01154-w · Cited by 4
Emotion regulation in bipolar disorder type-I: multivariate analysis of fMRI data
Kondo, F., Whitehead, J. C., Corbalán, F., Beaulieu, S., & Armony, J. L. (2023) · International Journal of Bipolar Disorders · doi:10.1186/s40345-023-00292-w · Cited by 4
Learning of irrelevant stimulus-response associations modulates cognitive control
Xia, X., Guo, M., & Wang, L. E. (2023) · NeuroImage · doi:10.1016/j.neuroimage.2023.120206 · Cited by 3
Conflict Experience Regulates the Neural Encoding of Cognitive Conflict
Jiang, H., Huang, C., Li, Z., Wang, Q., Liang, W.-S., & Zhou, A. (2023) · Brain Sciences · doi:10.3390/brainsci13060880 · Cited by 3
Transdiagnostic Impairment in Cognitive Control Neurocircuits
McTeague, L. M., Goodkind, M. S., & Etkin, A. (2017) · Wiley eBooks · doi:10.1002/9781118920497.ch30 · Cited by 4
The medial frontal cortex, performance monitoring, cognitive control, and decision making
Kirschner, H., & Ullsperger, M. (2023) · Elsevier eBooks · doi:10.1016/b978-0-12-820480-1.00048-6 · Cited by 4
Jannatdoust, P., Valizadeh, P., Bagherieh, S., Cattarinussi, G., Sambataro, F., Cirella, L., & Delvecchio, G. (2025) · Journal of Affective Disorders · doi:10.1016/j.jad.2025.05.012 · Cited by 4
Distinct roles of alpha and theta oscillations in information-seeking in cognitive control
Prasad, S. G., & Beste, C. (2025) · Journal of Neurophysiology · doi:10.1152/jn.00205.2025 · Cited by 2
A Region of Interest Analysis Focusing on the Insular and Cingulate Cortices
Kouzalis, A., & Ershova, R. V. (2024) · Вестник Российского университета дружбы народов. Серия: Психология и педагогика · doi:10.22363/2313-1683-2024-21-1-328-339 · Cited by 3
Elmers, J., Mückschel, M., Ziemssen, T., & Beste, C. (2026) · Journal of Cognitive Neuroscience · doi:10.1162/jocn.a.2485 · Cited by 2
Investigating the Effects of Acute Stress on Neural Mechanisms of Self-controlled Decision-making
Stein, J., Kirschbaum, C., Korb, F. M., Goschke, T., & Zwosta, K. (2026) · Journal of Cognitive Neuroscience · doi:10.1162/jocn.a.2623 · Cited by 2
Flexible integration and segregation of large-scale networks during adaptive control
Li, Y., Wang, Y., & Chen, A. (2023) · Behavioural Brain Research · doi:10.1016/j.bbr.2023.114521 · Cited by 2
Cognitive control controls the effect of irrelevant stimulus-response learning
Shi, K., & Wang, L. E. (2024) · Attention Perception & Psychophysics · doi:10.3758/s13414-024-02860-3 · Cited by 2
Chen, Y., Li, Z., Li, Q., Wang, J., Hu, N., Zheng, Y., & Chen, A. (2024) · International Journal of Psychophysiology · doi:10.1016/j.ijpsycho.2024.112324 · Cited by 2
Janik, R. A., Podolak, I. T., Struski, Ł., Ceglarek, A., Lewandowska, K., Sikora-Wachowicz, B., Marek, T., & Fąfrowicz, M. (2022) · Scientific Reports · doi:10.1038/s41598-022-09141-9 · Cited by 2
Sequential Difficulty Effects on Task Performance: Pervasive, Persistent, and Protean
Meriwether, D. (2016) · University of Minnesota Digital Conservancy (University of Minnesota) · Cited by 2
Herman, A. M., Palmer, C. E., Azevedo, R. T., & Tsakiris, M. (2020) · bioRxiv (Cold Spring Harbor Laboratory) · doi:10.1101/2020.06.04.134288 · Cited by 2
Herman, A. M., Tsakiris, M., & Palmer, C. E. (2020) · doi:10.17605/osf.io/6v3h4 · Cited by 2
Asymmetrical adaptations to increases and decreases in environmental volatilityPreprint
Xu, J., Dam, N. T. V., Luo, Y., Aleman, A., Ai, H., & Xu, P. (2021) · bioRxiv (Cold Spring Harbor Laboratory) · doi:10.1101/2021.07.30.454486 · Cited by 2
Flavour through the lens of incongruity: a proposed frameworkPreprint
Drew, A. A., Zampini, M., & Soto‐Faraco, S. (2023) · PsyArXiv (OSF Preprints) · doi:10.31234/osf.io/hd6xj · Cited by 2
THE MEDIAL FRONTAL CORTEX, PERFORMANCE MONITORING, COGNITIVE CONTROL, AND DECISION MAKINGPreprint
Kirschner, H., & Ullsperger, M. (2024) · PsyArXiv (OSF Preprints) · doi:10.31234/osf.io/ytrxd · Cited by 2
Individual variability in sensorimotor learning reflects trait-like neurobehavioral subject factorsPreprint
Areshenkoff, C. N., de Brouwer, A. J., Standage, D., Nashed, J. Y., Gale, D. J., Flanagan, J. R., & Gallivan, J. P. (2024) · bioRxiv (Cold Spring Harbor Laboratory) · doi:10.1101/2024.04.11.589135 · Cited by 2
Sundermeier, M., Standke, I., Schubotz, R. I., Dannlowski, U., Lencer, R., Mecklenbrauck, F., Trempler, I., & Zahedi, A. (2025) · NeuroImage · doi:10.1016/j.neuroimage.2025.121416 · Cited by 1
Observational learning strategies impact the neural correlates of declarative memory formation
Yifrah, B., Morris, G., & Mendelsohn, A. (2025) · Communications Biology · doi:10.1038/s42003-025-08870-7 · Cited by 1
Directed Communication in Theta and Alpha Networks Supports Content Handling in Working Memory
Elmers, J., Mückschel, M., & Beste, C. (2026) · Human Brain Mapping · doi:10.1002/hbm.70537 · Cited by 4
Xing, J., Pourtois, G., & Yang, Q. (2025) · Biological Psychology · doi:10.1016/j.biopsycho.2025.109059 · Cited by 2
Reward masks the learning of cognitive control demand
Bustos, B., Jiang, J., & Kool, W. (2025) · Cognitive Neurodynamics · doi:10.1007/s11571-025-10307-0 · Cited by 3
Self-citationKim, J., & Widge, A. S. (2025) · bioRxiv (Cold Spring Harbor Laboratory) · doi:10.1101/2025.10.15.682151 · Cited by 1
Insular motor and error encoding supports self-correcting intracranial brain-computer interface
Weger, P., Gimple, S. S., Ottenhoff, M. C., Verwoert, M., Ostrowski, L. M., Colon, A., Wagner, L., van Dijk, J. P., Temel, Y., Kubben, P., et al. (2026) · Nature Communications · doi:10.1101/2025.11.17.688824 · Cited by 1
Dey, A. (2019) · Open Scholarship Institutional Repository (Washington University in St. Louis) · doi:10.7936/4ry8-2307
Trempler, I., Binder, E., Reuter, M., Plieger, T., Standke, I., Mecklenbrauck, F., Meinert, S., Forstner, A. J., Nöthen, M. M., Rietschel, M., et al. (2022) · Cerebral Cortex · doi:10.1093/cercor/bhac046
Belov, V. (2023) · eDiss (Georg-August-Universität Göttingen) · doi:10.53846/goediss-9834 · Cited by 1
Response and conflict expectations shape motor responses interactively
Sauter, A. E., Zabicki, A., Schüller, T., Baldermann, J. C., Fink, G. R., Mengotti, P., & Vossel, S. (2024) · Experimental Brain Research · doi:10.1007/s00221-024-06920-w
Frontostriatal connectivity dynamically modulates the adaptation to environmental volatility
Zhang, Y., Dam, N. T. V., Ai, H., & Xu, P. (2025) · NeuroImage · doi:10.1016/j.neuroimage.2025.121027
Insular-striatal activation during COVID-19 predicts stress reactivity in high-trait anxiety
Lee, S.-H., & Chou, T. (2025) · Biological Psychology · doi:10.1016/j.biopsycho.2025.108998
Huang, B., Ritz, H., & Jiang, J. (2026) · eLife · doi:10.7554/elife.108673.5
Self-citationHuang, B., Ritz, H., & Jiang, J. (2025) · eLife · doi:10.7554/elife.108673.1
Self-citationHuang, B., Ritz, H., & Jiang, J. (2025) · eLife · doi:10.7554/elife.108673
Self-citationTemporal dynamics of flexible cognitive control
Wu, C., Seger, C. A., Ku, Y., Luo, C., Zhou, Y., Jiang, J., & Chen, Q. (2026) · NeuroImage · doi:10.1101/2025.10.03.680146
Self-citationWenigmann, M., Neukel, C., Spieß, K., Bertsch, K., & Herpertz, S. C. (2025) · Psychopathology · doi:10.1159/000549876
The role of oxytocin and cultural tightness in model-based learning of social Incongruency
Wang, J.-X., & Mu, Y. (2025) · Hormones and Behavior · doi:10.1016/j.yhbeh.2025.105873
Huang, B., Ritz, H., & Jiang, J. (2026) · eLife · doi:10.7554/elife.108673.2
Self-citationImpact of PV interneuron - OPC synapse disruption on cognitive functioning
Vidal, M. (2021) · theses.fr (ABES) · doi:10.70675/66c1e527zbd3ez49f6z8736ze9817c27856d
Duda, J. M., Cannon, T. D., Paskewitz, S., Palmer, W. C., Suthaharan, P., Kenney, J. G., Corlett, P. R., & Joormann, J. (2026) · Biological Psychiatry Global Open Science · doi:10.1016/j.bpsgos.2026.100736 · Cited by 1
Ultra-high-field fMRI study of insular discrimination of taste quality and perceived taste valence
Canna, A., Roefs, A., Prinster, A., Franssen, S., Rosa, A. P. D., Ciarlo, A., Cantone, E., Formisano, E., Salle, F. D., & Esposito, F. (2026) · Chemical Senses · doi:10.1093/chemse/bjag011
Hou, J., van de Mortel, L. A., Popma, A., Smit, D. J. A., & van Wingen, G. A. (2026) · Human Brain Mapping · doi:10.1002/hbm.70606
Neurobehavioral correlates of changing one’s mind in ADHD and OCD
Zühlsdorff, K., Dalley, J. W., Robbins, T. W., & Morein‐Zamir, S. (2026) · Cerebral Cortex · doi:10.64898/2026.07.09.737533
Huang, B., Ritz, H., & Jiang, J. (2026) · eLife · doi:10.7554/elife.108673.4.sa0
Self-citationYu, Q., Zhang, M., Zhu, X., Wang, S., Wu, T., Li, Y., Wen, W., Bao, Y., Shi, J., Lü, L., et al. (2026) · General Psychiatry · doi:10.1002/gps3.70042
A push–pull gut–brain signal regulates flexible learning in Caenorhabditis elegans
Liu, H., Sun, Y., Jiang, C., Dong, N., Yang, Y. C., Zhu, Y., Qin, R., Jia, H., Zhang, K., Li, H. C., et al. (2026) · Proceedings of the National Academy of Sciences · doi:10.1073/pnas.2604270123
Viviani, G., Visalli, A., Montefinese, M., Pietro, I. D., Vallesi, A., Ruz, M., & Ambrosini, E. (2026) · bioRxiv (Cold Spring Harbor Laboratory) · doi:10.64898/2026.09.20.752953
Elmers, J., Mückschel, M., Ziemssen, T., & Beste, C. (2026) · Brain Communications · doi:10.1093/braincomms/fcag397
Metadata
- Authors
- Jiang, J., Beck, J., Heller, K., & Egner, T.
- Affiliations
- Duke University (US)
- Corresponding author
- Jiang, Jiefeng
- Venue
- Nature Communications
- Published
- 2015-09-22
- Volume
- 6
- Issue
- 1
- Pages
- 8165-8165
- ISSN
- 2041-1723 (ISSN-L)
- PMC
- PMC4595591
- OpenAlex
- W2259098601
- Cited by
- 160
- References
- 55
- Citations by year
- 2026: 10 · 2025: 16 · 2024: 22 · 2023: 20 · 2022: 18 · 2021: 19 · 2020: 15 · 2019: 16 · 2018: 7 · 2017: 9 · 2016: 7 · 2015: 1
- FWCI
- 4.81
- Type
- journal article
- Language
- en
- Open access
- gold
- doi.org
- Licence
- cc-by
- creativecommons.org/licenses/by/4.0 (tdm)
- creativecommons.org/licenses/by/4.0 (vor)
- Locations
- Nature Communications (publishedVersion, cc-by)
- Europe PMC (PubMed Central) (publishedVersion, cc-by)
- PubMed Central (publishedVersion, cc-by)
- PubMed (publishedVersion)
- RePEc: Research Papers in Economics (submittedVersion)
- Funders
- National Institute of Mental Health (R01MH087610)
- Topics
- Life Sciences › Neuroscience › Cognitive Neuroscience › Neural and Behavioral Psychology Studies
- Life Sciences › Neuroscience › Cellular and Molecular Neuroscience › Neurotransmitter Receptor Influence on Behavior
- Life Sciences › Neuroscience › Cognitive Neuroscience › Neural dynamics and brain function
- Keywords
- cognitive control, flexible control, anterior insula, caudate nucleus, anterior cingulate cortex, dorsolateral prefrontal cortex, reinforcement learning, prediction, adaptive behavior, model-based fMRI
- MeSH terms
- Facial Recognition, Adult, Cerebral Cortex, Cognition, Female, Humans, Male, Nerve Net
About these checks
Registry, retraction, Cites and statistics results are computed, not judged, with one exception: a printed reference that no index lists is read once by a model before it counts as a citation error. Claims are extracted by a model and kept only when their quote appears verbatim in the text; each cited source is then checked, with a model’s help, for whether it says what the claim relies on. Those verdicts can be wrong — read the claim’s quote and the cited source before relying on one.
Statistics and arithmetic are recomputed, not judged.
Confidence bands are shown only for fields calibrated on our annotated test set. None is calibrated yet, so no band is shown.
What counts as a claim ›How we measure confidence ›How we check this ›
Are you an author, or do you see a problem with this page? Request a review
Data sources
Bibliographic data: Semantic Scholar, OpenAlex, Crossref.
Contains information from the Semantic Scholar Academic Graph Datasets, made available under the ODC Attribution License (ODC-BY 1.0).
Semantic Scholar’s data is described in: Kinney, R., et al. (2023). The Semantic Scholar Open Data Platform. arXiv:2301.10140.
