Cited by 47

The DOI matches its Crossref record; 6 of the 6 references it cites were found in a registry or an index.

A PI3K p110β–Rac signalling loop mediates Pten-loss-induced perturbation of haematopoiesis and leukaemogenesis

Yuzugullu, Haluk, Baitsch, Lukas, Von, Thanh, Steiner, Allison, Tong, Haoxuan, Ni, Jing, Clayton, Linda K., Bronson, Roderick, Roberts, Thomas M., Gritsman, Kira, Zhao, Jean J.·2015·Nature Communications

Abstract

The tumour suppressor PTEN, which antagonizes PI3K signalling, is frequently inactivated in haematologic malignancies. In mice, deletion of PTEN in haematopoietic stem cells (HSCs) causes perturbed haematopoiesis, myeloproliferative neoplasia (MPN) and leukaemia. Although the roles of the PI3K isoforms have been studied in PTEN-deficient tumours, their individual roles in PTEN-deficient HSCs are unknown. Here we show that when we delete PTEN in HSCs using the Mx1–Cre system, p110β ablation prevents MPN, improves HSC function and suppresses leukaemia initiation. Pharmacologic inhibition of p110β in PTEN-deficient mice recapitulates these genetic findings, but suggests involvement of both Akt-dependent and -independent pathways. Further investigation reveals that a p110β–Rac signalling loop plays a critical role in PTEN-deficient HSCs. Together, these data suggest that myeloid neoplasia driven by PTEN loss is dependent on p110β via p110β–Rac-positive-feedback loop, and that disruption of this loop may offer a new and effective therapeutic strategy for PTEN-deficient leukaemia.

Overview

The claims and statistics of this paper haven’t been checked yet.

Run the check — free, no account needed. It reads the open-access text and checks the sources it cites.

A few free checks a day · papers already verified open instantly · results are public

Integrity signals

Registry

Crossref · 10.1038/ncomms9501

Cites

6 of 6 references verified0 citation errors · 0 not checkable

Statistics

Figures

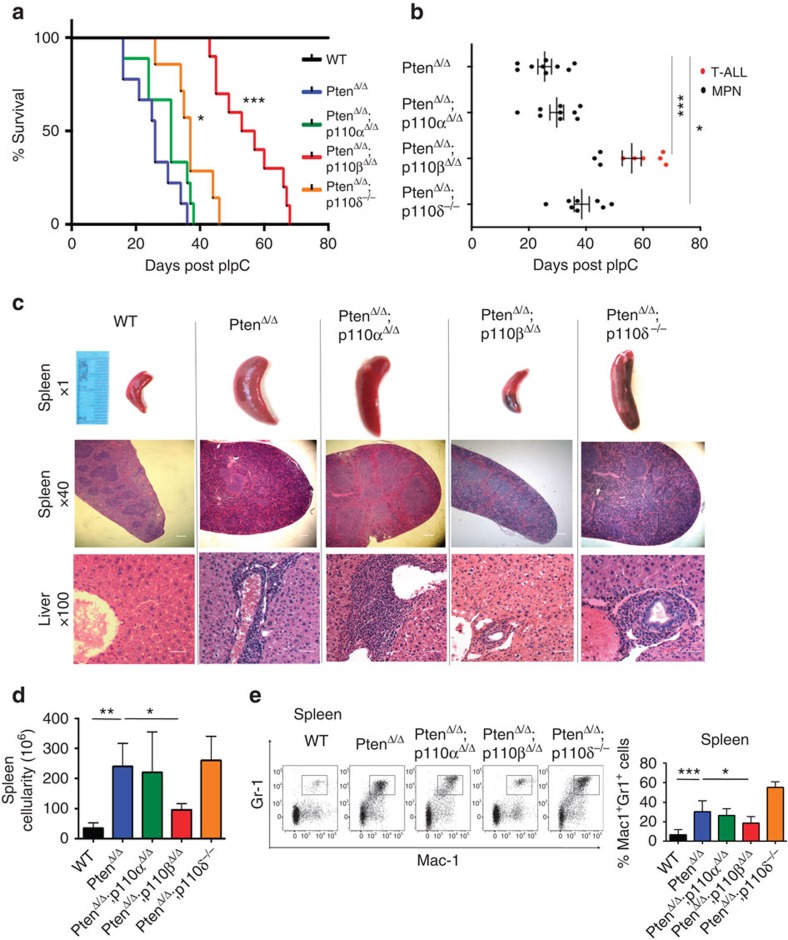
Figure 1 Ablation of p110β prolonged survival of animals on Pten loss. (a) Survival of PtenΔ/Δ (blue; n=9; median survival=26 days), PtenΔ/Δ;p110αΔ/Δ (green; n=9; median survival=31 days), PtenΔ/Δ;p110βΔ/Δ (red; n=9; median survival=55 days), PtenΔ/Δ;p110δ−/− (orange; n=7; median survival=37 days) and control animals (black) represented as DPI. The log-rank test was used to compare survival between groups. (b) Survival time and the development of MPN and T-ALL in each group of mice as indicated. Survival of PtenΔ/Δ (n=9; median survival=26 days), PtenΔ/Δ;p110αΔ/Δ (n=9; median survival=31 days), PtenΔ/Δ;p110βΔ/Δ (n=9; median survival=55 days), PtenΔ/Δ;p110δ−/− (n=7; median survival=37 days) and control animals (black) represented as DPI. Black dots represent MPN disease cases and red dots represent T-ALL cases in each group. The log-rank test was used to compare survival between groups. (c) Histopathology of the spleen (× 1 and × 40) and liver (× 100) taken at 26 DPI. Increased splenomegaly and disruption of spleen architecture as well as increased myeloid cell infiltration after Pten deletion. Scale bar, 5 μm. (d) Total cellularity of the spleen is represented as mean±s.d. of n=5 except PtenΔ/Δ;p110δ−/− (n=10). Two-way ANOVA test was applied to compare the spleen cellularity. (e) Representative flow cytometry plots of Mac1+Gr1+ cells in the spleen. Samples were analysed at 26 DPI. Bar graphs represent the mean±s.d. of n=9 (PtenΔ/Δ;p110δ−/−), 10 (PtenΔ/Δ;p110αΔ/Δ), 11 (ctrl) or 13 (PtenΔ/Δ and PtenΔ/Δ;p110βΔ/Δ). Two-way ANOVA test was applied to compare the Mac1-Gr1 cells in the spleen. *P<0.05, **P<0.01, ***P<0.001
Figure 1 Ablation of p110β prolonged survival of animals on Pten loss. (a) Survival of PtenΔ/Δ (blue; n=9; median survival=26 days), PtenΔ/Δ;p110αΔ/Δ (green; n=9; median survival=31 days), PtenΔ/Δ;p110βΔ/Δ (red; n=9; median survival=55 days), PtenΔ/Δ;p110δ−/− (orange; n=7; median survival=37 days) and control animals (black) represented as DPI. The log-rank test was used to compare survival between groups. (b) Survival time and the development of MPN and T-ALL in each group of mice as indicated. Survival of PtenΔ/Δ (n=9; median survival=26 days), PtenΔ/Δ;p110αΔ/Δ (n=9; median survival=31 days), PtenΔ/Δ;p110βΔ/Δ (n=9; median survival=55 days), PtenΔ/Δ;p110δ−/− (n=7; median survival=37 days) and control animals (black) represented as DPI. Black dots represent MPN disease cases and red dots represent T-ALL cases in each group. The log-rank test was used to compare survival between groups. (c) Histopathology of the spleen (× 1 and × 40) and liver (× 100) taken at 26 DPI. Increased splenomegaly and disruption of spleen architecture as well as increased myeloid cell infiltration after Pten deletion. Scale bar, 5 μm. (d) Total cellularity of the spleen is represented as mean±s.d. of n=5 except PtenΔ/Δ;p110δ−/− (n=10). Two-way ANOVA test was applied to compare the spleen cellularity. (e) Representative flow cytometry plots of Mac1+Gr1+ cells in the spleen. Samples were analysed at 26 DPI. Bar graphs represent the mean±s.d. of n=9 (PtenΔ/Δ;p110δ−/−), 10 (PtenΔ/Δ;p110αΔ/Δ), 11 (ctrl) or 13 (PtenΔ/Δ and PtenΔ/Δ;p110βΔ/Δ). Two-way ANOVA test was applied to compare the Mac1-Gr1 cells in the spleen. *P<0.05, **P<0.01, ***P<0.001CC BY · PubMed Central
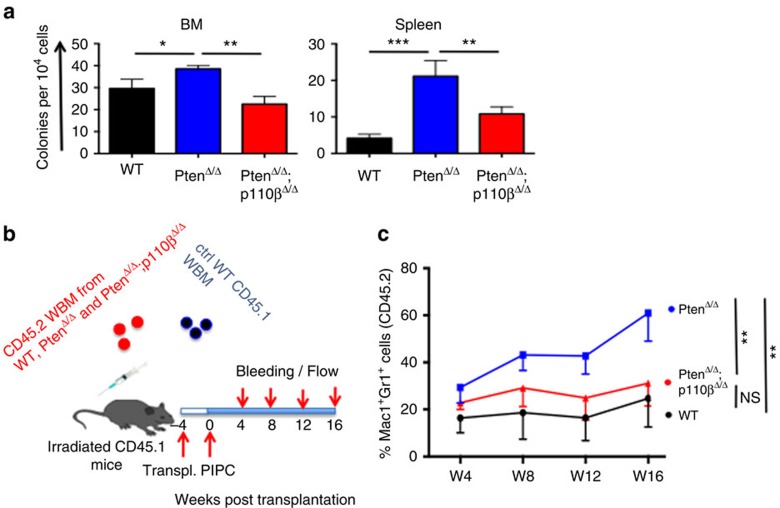
Figure 2 Ablation of p110β blocked MPN development in a cell-autonomous manner. (a) Colony-forming assays were performed with 1 × 10⁴ (BM) or 5 × 10⁴ (spleen) cells obtained from corresponding animals. Cells were cultured in M3434 medium. Colonies were counted 7 days after incubation. Data are represented as mean±s.e.m. (n=3, in duplicates). *P<0.05, **P<0.01, ***P<0.001. (b) BM cells were isolated from CD45.2+ WT, PtenΔ/Δ and PtenΔ/Δ;p110βΔ/Δ animals and transplanted into CD45.1+ mice as shown in the figure (n=10 for each group). (c) The myeloid cell reconstitution potential of the CD45.2+ cells was measured at regular intervals for 16 weeks. WT and PtenΔ/Δ;p110βΔ/Δ-derived myeloid cells have a stable amount of CD45.2+ myeloid cells; however, PtenΔ/Δ-derived myeloid cells expanded significantly and reached to 60% at week 16 (n=10 for all groups, **P<0.001). Two-way ANOVA test was applied to compare the myeloid cell potential.
Figure 2 Ablation of p110β blocked MPN development in a cell-autonomous manner. (a) Colony-forming assays were performed with 1 × 10⁴ (BM) or 5 × 10⁴ (spleen) cells obtained from corresponding animals. Cells were cultured in M3434 medium. Colonies were counted 7 days after incubation. Data are represented as mean±s.e.m. (n=3, in duplicates). *P<0.05, **P<0.01, ***P<0.001. (b) BM cells were isolated from CD45.2+ WT, PtenΔ/Δ and PtenΔ/Δ;p110βΔ/Δ animals and transplanted into CD45.1+ mice as shown in the figure (n=10 for each group). (c) The myeloid cell reconstitution potential of the CD45.2+ cells was measured at regular intervals for 16 weeks. WT and PtenΔ/Δ;p110βΔ/Δ-derived myeloid cells have a stable amount of CD45.2+ myeloid cells; however, PtenΔ/Δ-derived myeloid cells expanded significantly and reached to 60% at week 16 (n=10 for all groups, **P<0.001). Two-way ANOVA test was applied to compare the myeloid cell potential.CC BY · PubMed Central
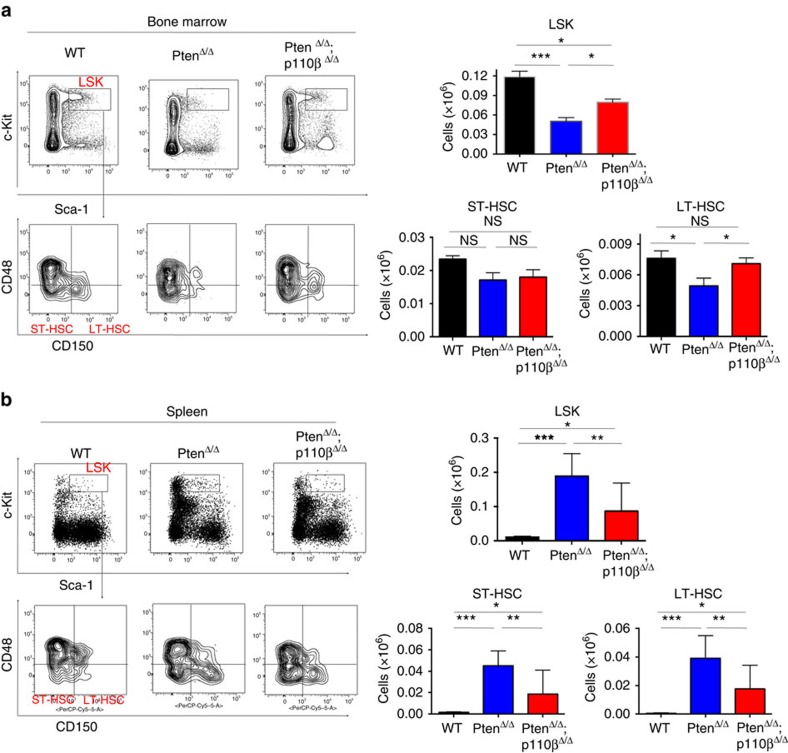
Figure 3 p110β deletion restores HSCs to both the bone marrow (BM) and the spleen. (a) Representative flow cytometric plots of ctrl, PtenΔ/Δ and PtenΔ/Δ;p110βΔ/Δ BM showing LSK cells (Lin–Sca-1+c-kit+), ST-HSC (CD150–CD48−Lin−Sca-1+c-kit+) and LT-HSC (CD150+CD48−Lin−Sca-1+c-kit+) cells (left panels) gated on total living CD45.2+Lin– cells. Total counts LSK (top) and LT-HSC (bottom right) of lineage-negative cells in the BM measured at 26 DPI in ctrl (n=13), PtenΔ/Δ (n=12) and PtenΔ/Δ;p110βΔ/Δ (n=18) animals. Two-way ANOVA test was applied to compare the stem cell numbers. (b) Representative flow cytometry plots of control, PtenΔ/Δ and PtenΔ/Δ;p110βΔ/Δ spleen cells showing LSK cells (Lin–Sca-1+c-kit+), ST-HSC (CD150–CD48−Lin−Sca-1+c-kit+) and LT-HSC (CD150+CD48−Lin−Sca-1+c-kit+) cells (left panels). Total LSK (top) and ST-HSC and LT-HSC (bottom right) cells in the spleen measured at 26 DPI. Numbers represent total cell counts per spleen (n=7 (ctrl, PtenΔ/Δ) and 10 (PtenΔ/Δ;p110βΔ/Δ)). Two-way ANOVA test was applied to compare the stem cell numbers. *P<0.05, **P<0.01, ***P<0.001
Figure 3 p110β deletion restores HSCs to both the bone marrow (BM) and the spleen. (a) Representative flow cytometric plots of ctrl, PtenΔ/Δ and PtenΔ/Δ;p110βΔ/Δ BM showing LSK cells (Lin–Sca-1+c-kit+), ST-HSC (CD150–CD48−Lin−Sca-1+c-kit+) and LT-HSC (CD150+CD48−Lin−Sca-1+c-kit+) cells (left panels) gated on total living CD45.2+Lin– cells. Total counts LSK (top) and LT-HSC (bottom right) of lineage-negative cells in the BM measured at 26 DPI in ctrl (n=13), PtenΔ/Δ (n=12) and PtenΔ/Δ;p110βΔ/Δ (n=18) animals. Two-way ANOVA test was applied to compare the stem cell numbers. (b) Representative flow cytometry plots of control, PtenΔ/Δ and PtenΔ/Δ;p110βΔ/Δ spleen cells showing LSK cells (Lin–Sca-1+c-kit+), ST-HSC (CD150–CD48−Lin−Sca-1+c-kit+) and LT-HSC (CD150+CD48−Lin−Sca-1+c-kit+) cells (left panels). Total LSK (top) and ST-HSC and LT-HSC (bottom right) cells in the spleen measured at 26 DPI. Numbers represent total cell counts per spleen (n=7 (ctrl, PtenΔ/Δ) and 10 (PtenΔ/Δ;p110βΔ/Δ)). Two-way ANOVA test was applied to compare the stem cell numbers. *P<0.05, **P<0.01, ***P<0.001CC BY · PubMed Central
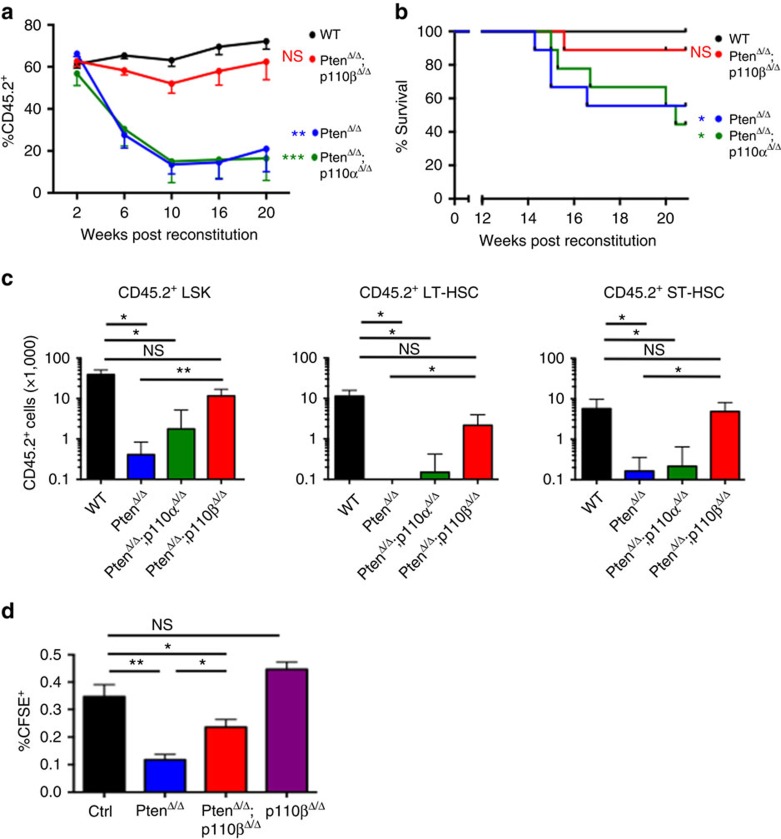
Figure 4 p110β deletion rescued long-term HSC (LT-HSC) reconstitution and suppressed leukaemia initiation and homing defects after Pten deletion. (a) Competitive repopulation experiment: bone marrow (BM) cells were isolated at 7 days post pIpC (DPI) from CD45.2+ ctrl, PtenΔ/Δ, PtenΔ/Δ;p110αΔ/Δ and PtenΔ/Δ;p110βΔ/Δ animals, and transplanted into lethally irradiated recipient animals along with CD45.1+ BM cells. The donor chimaerism in the peripheral blood was measured at regular intervals for 20 weeks, represented as the percentage of CD45.2+ cells among all leukocytes in the peripheral blood (n=9 for all groups). Two-way ANOVA test was applied to compare the donor derived cell numbers. (b) Disease-free survival of animals in the competitive repopulation experiment. Statistical analysis was performed at week 20 post transplantation using Fisher’s exact test. All samples were compared with the control group. Fischer exact test was applied to test overall survival. (c) After 20 weeks, the competitive repopulation experiment was terminated, and the remaining numbers of LSK, ST-HSC and LT-HSCs in the BM were measured by flow cytometry (n=4 for each group except n=5 for PtenΔ/Δ;p110δ−/−). Two-way ANOVA test was applied to compare the donor derived stem cell numbers. (d) Homing potential of CD45.2-positive carboxyfluorescein diacetate succinimidyl ester (CFSE)-labelled control, PtenΔ/Δ and PtenΔ/Δ;p110βΔ/Δ cells in 24 h in irradiated recipients (n=5) for each group. Two-way ANOVA test was applied to compare the donor derived stem cell numbers. *P<0.05, **P< 0.01, ***P<0.001
Figure 4 p110β deletion rescued long-term HSC (LT-HSC) reconstitution and suppressed leukaemia initiation and homing defects after Pten deletion. (a) Competitive repopulation experiment: bone marrow (BM) cells were isolated at 7 days post pIpC (DPI) from CD45.2+ ctrl, PtenΔ/Δ, PtenΔ/Δ;p110αΔ/Δ and PtenΔ/Δ;p110βΔ/Δ animals, and transplanted into lethally irradiated recipient animals along with CD45.1+ BM cells. The donor chimaerism in the peripheral blood was measured at regular intervals for 20 weeks, represented as the percentage of CD45.2+ cells among all leukocytes in the peripheral blood (n=9 for all groups). Two-way ANOVA test was applied to compare the donor derived cell numbers. (b) Disease-free survival of animals in the competitive repopulation experiment. Statistical analysis was performed at week 20 post transplantation using Fisher’s exact test. All samples were compared with the control group. Fischer exact test was applied to test overall survival. (c) After 20 weeks, the competitive repopulation experiment was terminated, and the remaining numbers of LSK, ST-HSC and LT-HSCs in the BM were measured by flow cytometry (n=4 for each group except n=5 for PtenΔ/Δ;p110δ−/−). Two-way ANOVA test was applied to compare the donor derived stem cell numbers. (d) Homing potential of CD45.2-positive carboxyfluorescein diacetate succinimidyl ester (CFSE)-labelled control, PtenΔ/Δ and PtenΔ/Δ;p110βΔ/Δ cells in 24 h in irradiated recipients (n=5) for each group. Two-way ANOVA test was applied to compare the donor derived stem cell numbers. *P<0.05, **P< 0.01, ***P<0.001CC BY · PubMed Central
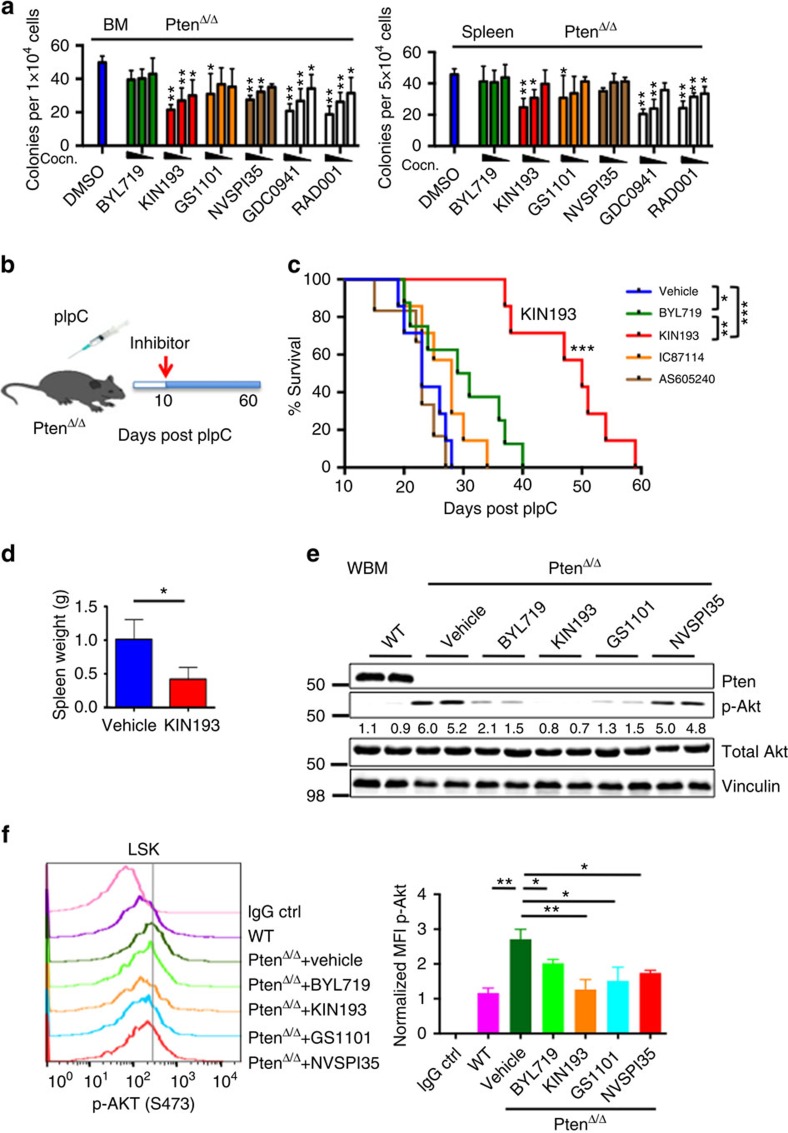
Figure 5 Pharmacological inhibition of p110β suppresses leukaemia in vitro and in Pten-deficient mice. (a) Colony-forming assays were performed with 1 × 10⁴ (BM) or 5 × 10⁴ (spleen) cells obtained from 7 DPI PtenΔ/Δ animals. Cells were cultured with added DMSO, BYL719, TGX221,GS1101, NVSPI35, GDC0941 or RAD001 with the following concentrations based on published data: 1, 0.5, 0.1 μM (BYL719, TGX221 and GDC0941); 5, 1, 0.5 μM (GS1101); 0.1, 0.05, 0.01 μM (NVSPI35 and RAD001). Colonies were counted 7 days after incubation. Data are represented as mean±s.e.m. (n=3, measured in duplicates) and all data are compared with the DMSO control for statistical analysis. *P<0.05; **P<0.001. Two-way ANOVA test was applied to compare the colony formation. (b) Schematic representation of drug treatment. (c) Survival of PtenΔ/Δ animals treated with vehicle (blue; n=7; median survival=23 days), BYL719 (green; n=8; median survival=32 days), KIN193 (red; n=7; median survival=50 days), IC87114 (orange; n=7; median survival=28 days) and AS605240 (brown; n=6; median survival=23 days). *P<0.05; **P<0.001; ***P<0.0001. The log-rank test was applied to compare survival. (d) Spleen weight of vehicle-treated (n=4) and KIN193-treated animals (n=3) at the moribund stage. *P<0.05. Student’s t-test was applied. (e) Western blot analysis of Akt signalling in whole BM cells at 7 DPI. Freshly isolated BM cells were treated with DMSO, BYL719, KIN193, GS1101 or NVSPI35 at the 1-μM dose for 2 h (n=6) for each treatment. (f) Phospho-flow analysis of p-Akt on isoform-selective inhibitor-treated animals. Freshly isolated lineage-negative BM cells were treated with inhibitors as in (e) and subjected to flow cytometry for LSK staining and intracellular P-Akt staining (n=3) for each, and median fluorescence intensities were normalized to control.
Figure 5 Pharmacological inhibition of p110β suppresses leukaemia in vitro and in Pten-deficient mice. (a) Colony-forming assays were performed with 1 × 10⁴ (BM) or 5 × 10⁴ (spleen) cells obtained from 7 DPI PtenΔ/Δ animals. Cells were cultured with added DMSO, BYL719, TGX221,GS1101, NVSPI35, GDC0941 or RAD001 with the following concentrations based on published data: 1, 0.5, 0.1 μM (BYL719, TGX221 and GDC0941); 5, 1, 0.5 μM (GS1101); 0.1, 0.05, 0.01 μM (NVSPI35 and RAD001). Colonies were counted 7 days after incubation. Data are represented as mean±s.e.m. (n=3, measured in duplicates) and all data are compared with the DMSO control for statistical analysis. *P<0.05; **P<0.001. Two-way ANOVA test was applied to compare the colony formation. (b) Schematic representation of drug treatment. (c) Survival of PtenΔ/Δ animals treated with vehicle (blue; n=7; median survival=23 days), BYL719 (green; n=8; median survival=32 days), KIN193 (red; n=7; median survival=50 days), IC87114 (orange; n=7; median survival=28 days) and AS605240 (brown; n=6; median survival=23 days). *P<0.05; **P<0.001; ***P<0.0001. The log-rank test was applied to compare survival. (d) Spleen weight of vehicle-treated (n=4) and KIN193-treated animals (n=3) at the moribund stage. *P<0.05. Student’s t-test was applied. (e) Western blot analysis of Akt signalling in whole BM cells at 7 DPI. Freshly isolated BM cells were treated with DMSO, BYL719, KIN193, GS1101 or NVSPI35 at the 1-μM dose for 2 h (n=6) for each treatment. (f) Phospho-flow analysis of p-Akt on isoform-selective inhibitor-treated animals. Freshly isolated lineage-negative BM cells were treated with inhibitors as in (e) and subjected to flow cytometry for LSK staining and intracellular P-Akt staining (n=3) for each, and median fluorescence intensities were normalized to control.CC BY · PubMed Central
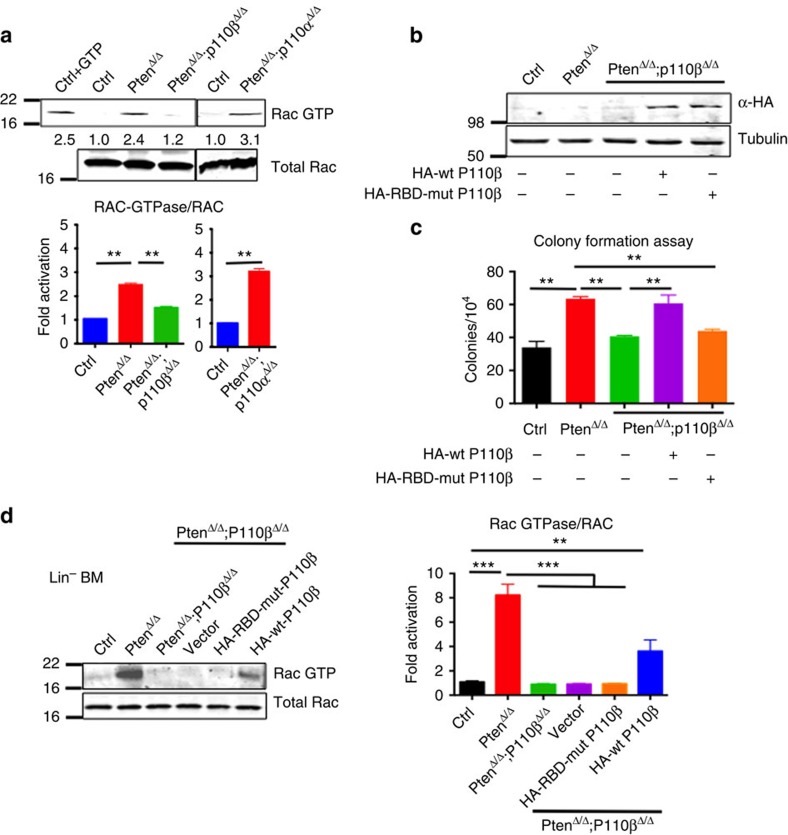
Figure 6 Pten-deficient haematopoietic cells depend on the p110β–Rac1 signalling axis. (a) Rac–GTP activity assay was performed on BM after 7 DPI in the corresponding genotypes. Rac–GTP and total Rac were measured and normalized (n=3; mean with s.e.m.). Two-way ANOVA test was applied to compare the RAC-GTPase/RAC levels. (b) PtenΔ/Δ;p110βΔ/Δ BM cells were transduced with retroviruses expressing HA-tagged wild-type P110β or RBD-mutant P110β, and briefly selected in the presence of puromycin. HA immunoblotting was performed to show expression of RBD-mutant and wild-type P110β (n=3 for each group). (c) Cells from WT control, PtenΔ/Δ or PtenΔ/Δ;p110βΔ/Δ animals were cultured in methylcellulose with myeloid growth factors in the presence of puromycin for 7 days, and colonies were counted at the end of day 7 (n=3 for each group). Two-way ANOVA test was applied to compare the colony numbers. (d) Lineage-negative cells were isolated from WT control, PtenΔ/Δ or PtenΔ/Δ;p110βΔ/Δ mice, and the Rac–GTP activity assay was performed as in (a). Rac–GTP and total Rac were measured and normalized to WT (n=6; mean with s.e.m.). Two-way ANOVA test was applied to compare the RAC-GTPase/RAC levels. **P< 0.01, ***P<0.001
Figure 6 Pten-deficient haematopoietic cells depend on the p110β–Rac1 signalling axis. (a) Rac–GTP activity assay was performed on BM after 7 DPI in the corresponding genotypes. Rac–GTP and total Rac were measured and normalized (n=3; mean with s.e.m.). Two-way ANOVA test was applied to compare the RAC-GTPase/RAC levels. (b) PtenΔ/Δ;p110βΔ/Δ BM cells were transduced with retroviruses expressing HA-tagged wild-type P110β or RBD-mutant P110β, and briefly selected in the presence of puromycin. HA immunoblotting was performed to show expression of RBD-mutant and wild-type P110β (n=3 for each group). (c) Cells from WT control, PtenΔ/Δ or PtenΔ/Δ;p110βΔ/Δ animals were cultured in methylcellulose with myeloid growth factors in the presence of puromycin for 7 days, and colonies were counted at the end of day 7 (n=3 for each group). Two-way ANOVA test was applied to compare the colony numbers. (d) Lineage-negative cells were isolated from WT control, PtenΔ/Δ or PtenΔ/Δ;p110βΔ/Δ mice, and the Rac–GTP activity assay was performed as in (a). Rac–GTP and total Rac were measured and normalized to WT (n=6; mean with s.e.m.). Two-way ANOVA test was applied to compare the RAC-GTPase/RAC levels. **P< 0.01, ***P<0.001CC BY · PubMed Central
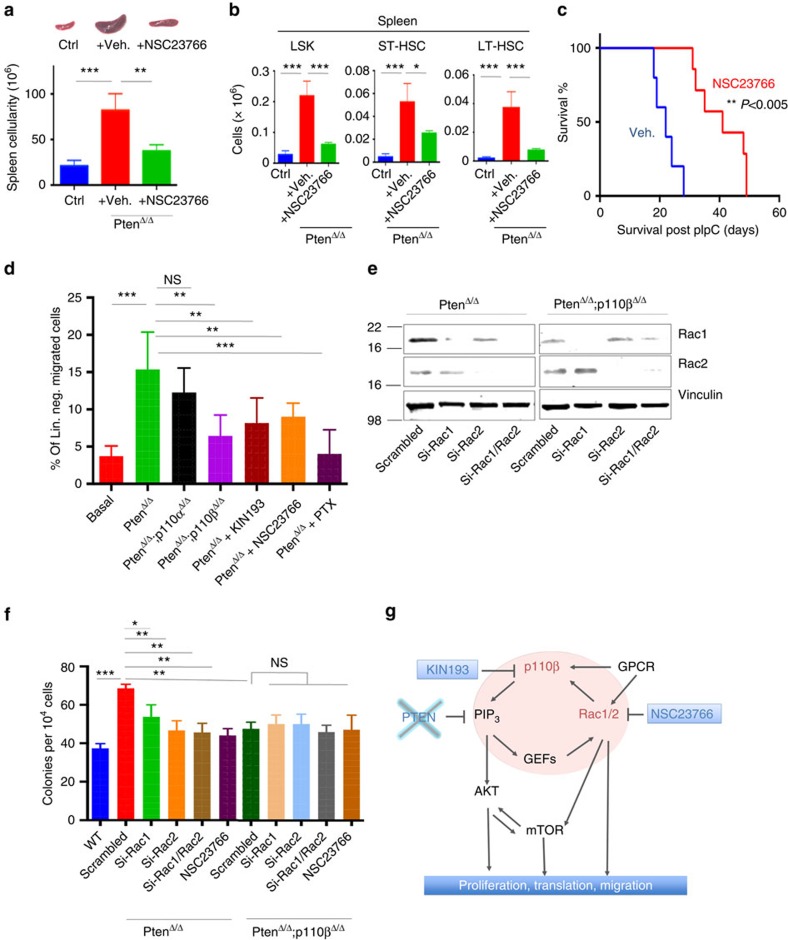
Figure 7 Pten-deficient haematopoietic cells depend on the p110β–Rac1 signalling axis. (a) NSC23766 was given at 2.5 μg g−1 daily intraperitoneally (IP). Spleen size and cellularity of vehicle-treated (n=3) and NSC23766-treated PtenΔ/Δ animals (n=3) at 17 DPI. *P<0.05; **P<0.001; ***P<0.0001. Two-way ANOVA test was applied to compare spleen size. (b) Quantification of the numbers of LSK (Lin–Sca-1+c-kit+), ST-HSC (CD150–CD48−Lin−Sca-1+c-kit+) or LT-HSC (CD150+CD48−Lin−Sca-1+c-kit+) cells in the spleens of control, PtenΔ/Δ animals treated with vehicle, or PtenΔ/Δ animals treated with NSC23766 at 17 DPI, determined by flow cytometry. The numbers represent total cell counts per spleen (n=3; ctrl, PtenΔ/Δ vehicle and NSC23766 treated). (c) Survival of PtenΔ/Δ animals treated with vehicle (blue; n=7; median survival=22 days) or NSC23766 (red; n=7; median survival=42 days). **P<0.005. The log-rank test was applied to compare survival. (d) Lineage-negative BM cells were isolated from control, PtenΔ/Δ or PtenΔ/Δ:P110βΔ/Δ PtenΔ/Δ:P110αΔ/Δ on 7 DPI, and lineage-negative cells were pretreated for 3 h with KIN193, NSC23766 (50 μM) or pertussis toxin (PTX; 100 ng ml−1). Migration towards the lower chamber (supplemented with CXCL12, 50 nM) was measured as the fraction of migrated cells relative to untreated Pten-null bone marrow-derived cells. Numbers of replicates are n=4 (basal, PtenΔ/Δ no Cxcl12; PtenΔ/Δ+PTX), 10 (PtenΔ/Δ), 6 (PtenΔ/Δ:P110βΔ/Δ) and 6 (PtenΔ/Δ+KIN193). Statistical comparisons were all performed relative to the PtenΔ/Δ group. (e) PtenΔ/Δ and PtenΔ/Δ;p110βΔ/Δ BM cells were transfected with two different siRNAs targeting scrambled, mouse Rac1, mouse Rac2 alone, or both Rac1 and Rac2 and subjected to immunoblotting 48 h later. (f) PtenΔ/Δ and PtenΔ/Δ;p110βΔ/Δ BM cells from knockdown were transfected with two different siRNAs targeting scrambled, mouse Rac1, mouse Rac2 alone, or both Rac1 and Rac2, or treated with NSC23766 (50 μM) and then colony assays were performed in methylcellulose with myeloid growth factors. Colonies were counted after 7 days (n=3) for each group. Two-way ANOVA test was applied to calculate colony formation. (g) A working model of signalling cascades downstream of P110β and the signalling loop of P110β and Rac1.
Figure 7 Pten-deficient haematopoietic cells depend on the p110β–Rac1 signalling axis. (a) NSC23766 was given at 2.5 μg g−1 daily intraperitoneally (IP). Spleen size and cellularity of vehicle-treated (n=3) and NSC23766-treated PtenΔ/Δ animals (n=3) at 17 DPI. *P<0.05; **P<0.001; ***P<0.0001. Two-way ANOVA test was applied to compare spleen size. (b) Quantification of the numbers of LSK (Lin–Sca-1+c-kit+), ST-HSC (CD150–CD48−Lin−Sca-1+c-kit+) or LT-HSC (CD150+CD48−Lin−Sca-1+c-kit+) cells in the spleens of control, PtenΔ/Δ animals treated with vehicle, or PtenΔ/Δ animals treated with NSC23766 at 17 DPI, determined by flow cytometry. The numbers represent total cell counts per spleen (n=3; ctrl, PtenΔ/Δ vehicle and NSC23766 treated). (c) Survival of PtenΔ/Δ animals treated with vehicle (blue; n=7; median survival=22 days) or NSC23766 (red; n=7; median survival=42 days). **P<0.005. The log-rank test was applied to compare survival. (d) Lineage-negative BM cells were isolated from control, PtenΔ/Δ or PtenΔ/Δ:P110βΔ/Δ PtenΔ/Δ:P110αΔ/Δ on 7 DPI, and lineage-negative cells were pretreated for 3 h with KIN193, NSC23766 (50 μM) or pertussis toxin (PTX; 100 ng ml−1). Migration towards the lower chamber (supplemented with CXCL12, 50 nM) was measured as the fraction of migrated cells relative to untreated Pten-null bone marrow-derived cells. Numbers of replicates are n=4 (basal, PtenΔ/Δ no Cxcl12; PtenΔ/Δ+PTX), 10 (PtenΔ/Δ), 6 (PtenΔ/Δ:P110βΔ/Δ) and 6 (PtenΔ/Δ+KIN193). Statistical comparisons were all performed relative to the PtenΔ/Δ group. (e) PtenΔ/Δ and PtenΔ/Δ;p110βΔ/Δ BM cells were transfected with two different siRNAs targeting scrambled, mouse Rac1, mouse Rac2 alone, or both Rac1 and Rac2 and subjected to immunoblotting 48 h later. (f) PtenΔ/Δ and PtenΔ/Δ;p110βΔ/Δ BM cells from knockdown were transfected with two different siRNAs targeting scrambled, mouse Rac1, mouse Rac2 alone, or both Rac1 and Rac2, or treated with NSC23766 (50 μM) and then colony assays were performed in methylcellulose with myeloid growth factors. Colonies were counted after 7 days (n=3) for each group. Two-way ANOVA test was applied to calculate colony formation. (g) A working model of signalling cascades downstream of P110β and the signalling loop of P110β and Rac1.CC BY · PubMed Central

Verification

Claims the paper makes

The claims and statistics of this paper haven’t been checked yet.

Run the check — free, no account needed. It reads the open-access text and checks the sources it cites.

A few free checks a day · papers already verified open instantly · results are public

Claims other papers make about this one

Each is checked against this paper’s own text: does it say what the citing paper says it does?

Self-check

Percentages, sums and reported differences re-computed from the paper’s own numbers.

The self-check needs the paper’s full text.

Citations

Cites

Research works printed but not linked: 50

  1. Martelli, A. M. et al. Phosphoinositide 3-kinase/Akt signaling pathway and its therapeutical implications for human acute myeloid leukemia. Leukemia 20, 911–928 (2006) . · DOI
  2. Peng, C. et al. PTEN is a tumor suppressor in CML stem cells and BCR-ABL-induced leukemias in mice. Blood 115, 626–635 (2010) . · DOI
  3. Gutierrez, A. et al. High frequency of PTEN, PI3K, and AKT abnormalities in T-cell acute lymphoblastic leukemia. Blood 114, 647–650 (2009) . · DOI
  4. Dahia, P. L. et al. PTEN is inversely correlated with the cell survival factor Akt/PKB and is inactivated via multiple mechanismsin haematological malignancies. Hum. Mol. Genet. 8, 185–193 (1999) . · DOI
  5. Patel, J. P. et al. Prognostic relevance of integrated genetic profiling in acute myeloid leukemia. N. Engl. J. Med. 366, 1079–1089 (2012) . · DOI
  6. Li, Y. et al. Epigenetic silencing of microRNA-193a contributes to leukemogenesis in t(8;21) acute myeloid leukemia by activating the PTEN/PI3K signal pathway. Blood 121, 499–509 (2013) . · DOI
  7. Noguera, N. I. et al. Nucleophosmin/B26 regulates PTEN through interaction with HAUSP in acute myeloid leukemia. Leukemia 27, 1037–1043 (2013) . · DOI
  8. Yang, J. et al. A reappraisal by quantitative flow cytometry analysis of PTEN expression in acute leukemia. Leukemia 21, 2072–2074 (2007) . · DOI
  9. Xu, Q., Simpson, S. E., Scialla, T. J., Bagg, A. & Carroll, M. Survival of acute myeloid leukemia cells requires PI3 kinase activation. Blood 102, 972–980 (2003) . · DOI · Paper page
  10. Yilmaz, O. H. et al. Pten dependence distinguishes haematopoietic stem cells from leukaemia-initiating cells. Nature 441, 475–482 (2006) . · DOI · Paper page
  11. Tang, P. et al. Differential roles of Kras and Pten in murine leukemogenesis. Leukemia 27, 1210–1214 (2013) . · DOI
  12. Thorpe, L. M., Yuzugullu, H. & Zhao, J. J. PI3K in cancer: divergent roles of isoforms, modes of activation and therapeutic targeting. Nat. Rev. Cancer 15, 7–24 (2014) . · DOI
  13. Utermark, T. et al. The p110alpha and p110beta isoforms of PI3K play divergent roles in mammary gland development and tumorigenesis. Genes Dev. 26, 1573–1586 (2012) . · DOI
  14. Castellano, E. et al. Requirement for interaction of PI3-kinase p110alpha with RAS in lung tumor maintenance. Cancer Cell 24, 617–630 (2013) . · DOI
  15. Gritsman, K. et al. Hematopoiesis and RAS-driven myeloid leukemia differentially require PI3K isoform p110alpha. J. Clin. Invest. 124, 1794–1809 (2014) . · DOI
  16. Ciraolo, E. et al. Phosphoinositide 3-kinase p110beta activity: key role in metabolism and mammary gland cancer but not development. Sci. Signal. 1, ra3 (2008) . · DOI
  17. Guillermet-Guibert, J. et al. The p110beta isoform of phosphoinositide 3-kinase signals downstream of G protein-coupled receptors and is functionally redundant with p110gamma. Proc. Natl Acad. Sci. USA 105, 8292–8297 (2008) . · DOI
  18. Jia, S. et al. Essential roles of PI(3)K-p110beta in cell growth, metabolism and tumorigenesis. Nature 454, 776–779 (2008) . · DOI
  19. Fritsch, R. et al. RAS and RHO families of GTPases directly regulate distinct phosphoinositide 3-kinase isoforms. Cell 153, 1050–1063 (2013) . · DOI
  20. Ni, J. et al. Functional characterization of an isoform-selective inhibitor of PI3K-p110beta as a potential anticancer agent. Cancer Discov. 2, 425–433 (2012) . · DOI
  21. Wee, S. et al. PTEN-deficient cancers depend on PIK3CB. Proc. Natl Acad. Sci. USA 105, 13057–13062 (2008) . · DOI
  22. Furman, R. R. et al. Idelalisib and rituximab in relapsed chronic lymphocytic leukemia. N. Engl. J. Med. 370, 997–1007 (2014) . · DOI
  23. Zhao, J. J. et al. The p110alpha isoform of PI3K is essential for proper growth factor signaling and oncogenic transformation. Proc. Natl Acad. Sci. USA 103, 16296–16300 (2006) . · DOI
  24. Jou, S. T. et al. Essential, nonredundant role for the phosphoinositide 3-kinase p110delta in signaling by the B-cell receptor complex. Mol. Cell. Biol. 22, 8580–8591 (2002) . · DOI
  25. Kuhn, R., Schwenk, F., Aguet, M. & Rajewsky, K. Inducible gene targeting in mice. Science 269, 1427–1429 (1995) . · DOI · Paper page
  26. Subramaniam, P. S. et al. Targeting nonclassical oncogenes for therapy in T-ALL. Cancer Cell 21, 459–472 (2012) . · DOI
  27. Hagenbeek, T. J. & Spits, H. T-cell lymphomas in T-cell-specific Pten-deficient mice originate in the thymus. Leukemia 22, 608–619 (2008) . · DOI
  28. Hagenbeek, T. J. et al. The loss of PTEN allows TCR alphabeta lineage thymocytes to bypass IL-7 and Pre-TCR-mediated signaling. J. Exp. Med. 200, 883–894 (2004) . · DOI
  29. Tesio, M. et al. Pten loss in the bone marrow leads to G-CSF-mediated HSC mobilization. J. Exp. Med. 210, 2337–2349 (2013) . · DOI · Paper page
  30. Juric, D. et al. Phase I study of BYL719, an alpha-specific PI3K inhibitor, in patients with PIK3CA mutant advanced solid tumors: preliminary efficacy and safety in patients with PIK3CA mutant ER-positive (ER+) metastatic breast cancer (MBC). Cancer Res. 72, P6-10-07 (2012) . · DOI
  31. Lannutti, B. J. et al. CAL-101, a p110delta selective phosphatidylinositol-3-kinase inhibitor for the treatment of B-cell malignancies, inhibits PI3K signaling and cellular viability. Blood 117, 591–594 (2011) . · DOI
  32. Bruce, I. et al. Development of isoform selective PI3-kinase inhibitors as pharmacological tools for elucidating the PI3K pathway. Bioorg. Med. Chem. Lett. 22, 5445–5450 (2012) . · DOI
  33. Sujobert, P. et al. Essential role for the p110delta isoform in phosphoinositide 3-kinase activation and cell proliferation in acute myeloid leukemia. Blood 106, 1063–1066 (2005) . · DOI
  34. Camps, M. et al. Blockade of PI3Kgamma suppresses joint inflammation and damage in mouse models of rheumatoid arthritis. Nat. Med. 11, 936–943 (2005) . · DOI
  35. Wang, Q. et al. Spatially distinct roles of class Ia PI3K isoforms in the development and maintenance of PTEN hamartoma tumor syndrome. Genes Dev. 27, 1568–1580 (2013) . · DOI
  36. Ali, K. et al. Essential role for the p110delta phosphoinositide 3-kinase in the allergic response. Nature 431, 1007–1011 (2004) . · DOI
  37. Kang, J. H. et al. Phosphorylation of Rho-associated kinase (Rho-kinase/ROCK/ROK) substrates by protein kinases A and C. Biochimie 89, 39–47 (2007) . · DOI
  38. Denley, A., Kang, S., Karst, U. & Vogt, P. K. Oncogenic signaling of class I PI3K isoforms. Oncogene 27, 2561–2574 (2008) . · DOI
  39. Klarlund, J. K. et al. Signaling by phosphoinositide-3,4,5-trisphosphate through proteins containing pleckstrin and Sec7 homology domains. Science 275, 1927–1930 (1997) . · DOI
  40. Welch, H. C. et al. P-Rex1, a PtdIns(3,4,5)P3- and Gbetagamma-regulated guanine-nucleotide exchange factor for Rac. Cell 108, 809–821 (2002) . · DOI
  41. Gu, Y. et al. Hematopoietic cell regulation by Rac1 and Rac2 guanosine triphosphatases. Science 302, 445–449 (2003) . · DOI · Paper page
  42. Gao, Y., Dickerson, J. B., Guo, F., Zheng, J. & Zheng, Y. Rational design and characterization of a Rac GTPase-specific small molecule inhibitor. Proc. Natl Acad. Sci. USA 101, 7618–7623 (2004) . · DOI · Paper page
  43. Schwartz, S. et al. Feedback suppression of PI3Kalpha signaling in PTEN-mutated tumors is relieved by selective inhibition of PI3Kbeta. Cancer Cell 27, 109–122 (2015) . · DOI
  44. Berenjeno, I. M. et al. Both p110alpha and p110beta isoforms of PI3K can modulate the impact of loss-of-function of the PTEN tumour suppressor. Biochem. J. 442, 151–159 (2012) . · DOI
  45. Weiner, O. D. et al. A PtdInsP(3)- and Rho GTPase-mediated positive feedback loop regulates neutrophil polarity. Nat. Cell Biol. 4, 509–513 (2002) . · DOI
  46. Shirsat, N. V., Pignolo, R. J., Kreider, B. L. & Rovera, G. A member of the ras gene superfamily is expressed specifically in T, B and myeloid hemopoietic cells. Oncogene 5, 769–772 (1990) .
  47. Kalaitzidis, D. et al. mTOR complex 1 plays critical roles in hematopoiesis and Pten-loss-evoked leukemogenesis. Cell Stem Cell 11, 429–439 (2012) . · DOI
  48. Magee, J. A. et al. Temporal changes in PTEN and mTORC2 regulation of hematopoietic stem cell self-renewal and leukemia suppression. Cell Stem Cell 11, 415–428 (2012) . · DOI
  49. Saci, A., Cantley, L. C. & Carpenter, C. L. Rac1 regulates the activity of mTORC1 and mTORC2 and controls cellular size. Mol. Cell. 42, 50–61 (2011) . · DOI · Paper page
  50. Kalaitzidis, D. & Neel, B. G. Flow-cytometric phosphoprotein analysis reveals agonist and temporal differences in responses of murine hematopoietic stem/progenitor cells. PLoS ONE 3, e3776 (2008) . · DOI

Cited by

See all 47

Metadata

Authors
Yuzugullu, H., Baitsch, L., Von, T., Steiner, A., Tong, H., Ni, J., Clayton, L. K., Bronson, R., Roberts, T. M., Gritsman, K., & Zhao, J. J.
Venue
Nature Communications
Published
2015-10-07
Volume
6
Issue
1
ISSN
2041-1723
Cited by
47
References
6
Language
en

About these checks

Registry, retraction, Cites and statistics results are computed, not judged, with one exception: a printed reference that no index lists is read once by a model before it counts as a citation error. Claims are extracted by a model and kept only when their quote appears verbatim in the text; each cited source is then checked, with a model’s help, for whether it says what the claim relies on. Those verdicts can be wrong — read the claim’s quote and the cited source before relying on one.

Statistics and arithmetic are recomputed, not judged.

Confidence bands are shown only for fields calibrated on our annotated test set. None is calibrated yet, so no band is shown.

What counts as a claim ›How we measure confidence ›How we check this ›

Are you an author, or do you see a problem with this page? Request a review