Cited by 2Cell death mechanisms and regulationMitochondrial Function and PathologyPhotoreceptor and optogenetics research

The DOI matches its Crossref record; 3 of the 3 references it cites were found in a registry or an index.

Optogenetic engineering of BAX to control mitochondrial permeabilization and attenuate apoptosis in cells

Open access
Lee, Dain, Bae, Hyunjun, Oh, Dongwoo, Kim, Minseop, Kim, Ju-Hee, Ahn, Jinchul, Kang, Seok-Hyeon, You, Seo-Hee, Kim, Dong-Hwee, Oh, Hyun Jeong, Heo, Won Do, Chung, Seok·2025·Experimental & Molecular Medicine

Published version of a preprint

Abstract

Although considerable research has focused on enhancing the apoptotic function of BAX for several decades, inhibition of its functionality remains relatively underexplored, despite intensive BAX activation occurring in various neurodegenerative diseases. Here we present a protein engineering approach to modulate BAX integration into the mitochondrial outer membrane, establishing a tunable strategy for antiapoptosis. Utilizing optogenetic methods that employ cryptochrome 2 and its binding partner cryptochrome-interacting basic helix loop helix 1, we achieved precise spatial control over BAX localization, a critical determinant of its function. Our results demonstrate that the engineered BAX variant is effectively incapacitated in its apoptotic function while also modulating endogenous BAX activity to enhance cellular resistance to apoptosis. These findings not only advance our understanding of BAX regulation but also offer promising prospects for the development of therapeutic strategies against apoptosis-related diseases.

Overview

The claims and statistics of this paper haven’t been checked yet.

Run the check — free, no account needed. It reads the open-access text and checks the sources it cites.

A few free checks a day · papers already verified open instantly · results are public

Integrity signals

Registry

Crossref · 10.1038/s12276-025-01605-y

Cites

3 of 3 references verified0 citation errors · 0 not checkable

Statistics

Figures

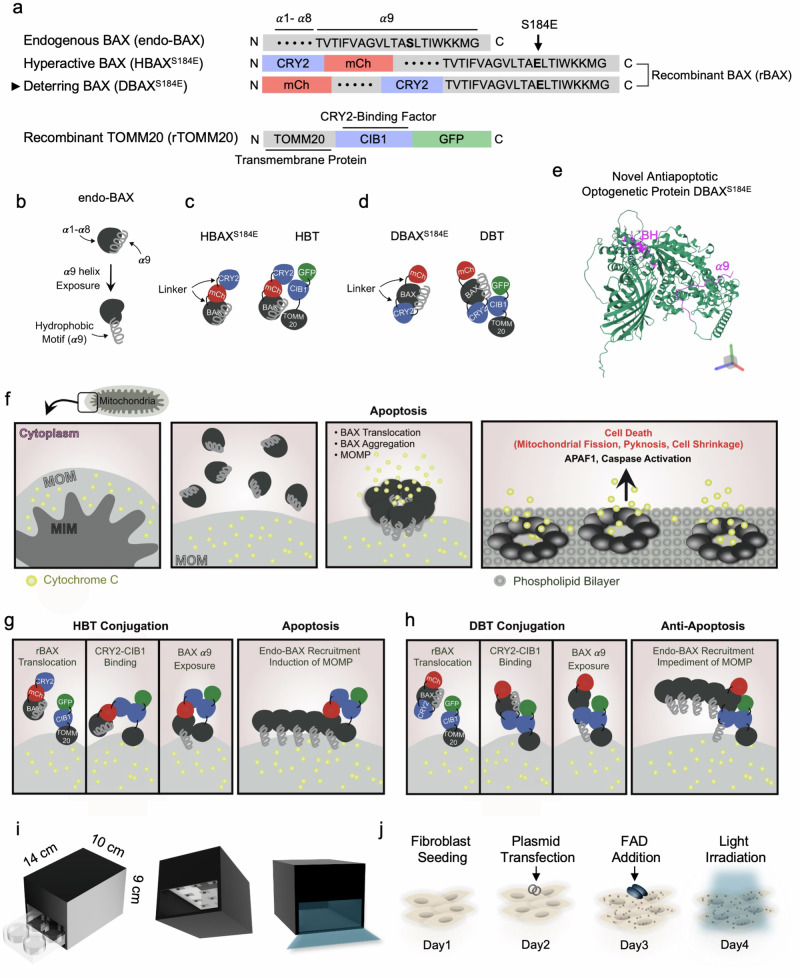
Fig. 1 Design and working principles of endo-BAX and engineered BAX variants. a A schematic depiction of the functional domains in endo-BAX, rBAX and recombinant TOMM20 (rTOMM20). In hyperactive BAX (HBAXS184E), the residue at position 184 in the α9 domain is mutated to glutamic acid, and the resulting construct is fused to CRY2 and mCherry (mCh). Deterring BAX (DBAXS184E) is a novel BAX variant developed in this study; it also carries the S184E mutation but differs by having CRY2 inserted between the α8 and α9 domains, in addition to an mCh fusion. rTOMM20 is fused to CIB1, as well as to GFP. All recombinant proteins contain nonfunctional linker sequences. b An illustration of endo-BAX with its nine α-helical segments. The C-terminal α9 helix contains a hydrophobic motif. c Optogenetically modified constructs in the HBT system. HBAXS184E and rTOMM20 are shown along with their proposed interaction. d Optogenetically modified constructs in the DBT system. DBAXS184E and rTOMM20 are illustrated, including their predicted interaction. e The predicted PDB structure of DBAXS184E. f Model of mitochondrial membranes (outer, MOM; inner, mitochondrial inner membrane (MIM)), with CytC in the intermembrane space and endo-BAX in the cytoplasm. Upon receiving apoptotic signals, the α9 helix of BAX is exposed, allowing BAX insertion into the MOM, aggregation and subsequent release of CytC into the cytosol, which triggers apoptotic signaling. g Mechanism of HBT complex formation under blue light stimulation. HBAXS184E translocates to the MOM, where CRY2 binds to CIB1 in rTOMM20. The exposed α9 helix of HBAXS184E inserts into the MOM, recruiting endo-BAX and inducing MOMP. h Mechanism of DBT complex formation upon optogenetic stimulation. DBAXS184E also translocates to the MOM and binds rTOMM20 via CRY2–CIB1 interaction. Although its α9 helix is inserted into the MOM, the binding of CRY2–CIB1 above the hydrophobic motif in DBAXS184E disrupts BAX oligomerization, limiting MOMP. i A schematic of the blue light irradiation chamber and calibration. The light chamber is depicted with a 4 × 9 cm² entrance, accommodating a standard six-well cell culture plate. j Workflow for recombinant protein expression in cells. See also Supplementary Figs. 1 and 2 and Supplementary Table 1 for more details.
Fig. 1 Design and working principles of endo-BAX and engineered BAX variants. a A schematic depiction of the functional domains in endo-BAX, rBAX and recombinant TOMM20 (rTOMM20). In hyperactive BAX (HBAXS184E), the residue at position 184 in the α9 domain is mutated to glutamic acid, and the resulting construct is fused to CRY2 and mCherry (mCh). Deterring BAX (DBAXS184E) is a novel BAX variant developed in this study; it also carries the S184E mutation but differs by having CRY2 inserted between the α8 and α9 domains, in addition to an mCh fusion. rTOMM20 is fused to CIB1, as well as to GFP. All recombinant proteins contain nonfunctional linker sequences. b An illustration of endo-BAX with its nine α-helical segments. The C-terminal α9 helix contains a hydrophobic motif. c Optogenetically modified constructs in the HBT system. HBAXS184E and rTOMM20 are shown along with their proposed interaction. d Optogenetically modified constructs in the DBT system. DBAXS184E and rTOMM20 are illustrated, including their predicted interaction. e The predicted PDB structure of DBAXS184E. f Model of mitochondrial membranes (outer, MOM; inner, mitochondrial inner membrane (MIM)), with CytC in the intermembrane space and endo-BAX in the cytoplasm. Upon receiving apoptotic signals, the α9 helix of BAX is exposed, allowing BAX insertion into the MOM, aggregation and subsequent release of CytC into the cytosol, which triggers apoptotic signaling. g Mechanism of HBT complex formation under blue light stimulation. HBAXS184E translocates to the MOM, where CRY2 binds to CIB1 in rTOMM20. The exposed α9 helix of HBAXS184E inserts into the MOM, recruiting endo-BAX and inducing MOMP. h Mechanism of DBT complex formation upon optogenetic stimulation. DBAXS184E also translocates to the MOM and binds rTOMM20 via CRY2–CIB1 interaction. Although its α9 helix is inserted into the MOM, the binding of CRY2–CIB1 above the hydrophobic motif in DBAXS184E disrupts BAX oligomerization, limiting MOMP. i A schematic of the blue light irradiation chamber and calibration. The light chamber is depicted with a 4 × 9 cm² entrance, accommodating a standard six-well cell culture plate. j Workflow for recombinant protein expression in cells. See also Supplementary Figs. 1 and 2 and Supplementary Table 1 for more details.CC BY · PubMed Central
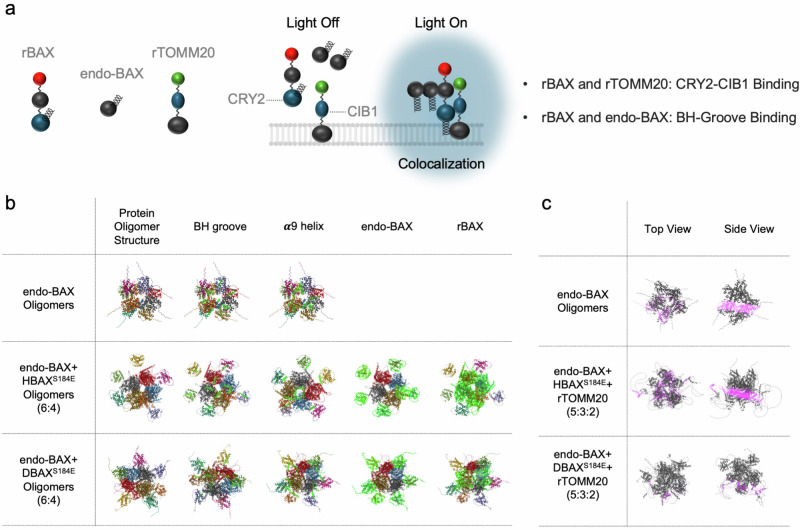
Fig. 2 Simulations of protein aggregation. a A schematic representation of rBAX, endo-BAX and rTOMM20 interactions. Under dark conditions, the three components remain dissociated. Upon blue light exposure, however, they assemble at the MOM. In this system, rBAX and rTOMM20 interact via CRY2–CIB1 binding, whereas rBAX and endo-BAX associate through their BH grooves. b To model optogenetically induced BAX aggregation, AlphaFold Multimer simulations were performed using either HBAXS184E or DBAXS184E at a 6:4 ratio to endo-BAX (total of ten proteins). Each protein is rendered in a different color, with BH grooves, α9 helices, endo-BAX or rBAX highlighted in green. In contrast to endo-BAX and HBAXS184E, the DBAXS184E complex exhibits minimal pore formation. c To simulate conditions in which rTOMM20 associates with rBAX under blue light irradiation, endo-BAX, rBAX and rTOMM20 were combined in a 5:3:2 ratio. Membrane-embedded residues are highlighted in pink, and the remnants are shown in gray. Both the top and side views are presented. The DBAXS184E–rTOMM20 (DBT) complex displays limited hydrophobic motif insertion into the MOM compared to the HBAXS184E–rTOMM20 (HBT) complex.
Fig. 2 Simulations of protein aggregation. a A schematic representation of rBAX, endo-BAX and rTOMM20 interactions. Under dark conditions, the three components remain dissociated. Upon blue light exposure, however, they assemble at the MOM. In this system, rBAX and rTOMM20 interact via CRY2–CIB1 binding, whereas rBAX and endo-BAX associate through their BH grooves. b To model optogenetically induced BAX aggregation, AlphaFold Multimer simulations were performed using either HBAXS184E or DBAXS184E at a 6:4 ratio to endo-BAX (total of ten proteins). Each protein is rendered in a different color, with BH grooves, α9 helices, endo-BAX or rBAX highlighted in green. In contrast to endo-BAX and HBAXS184E, the DBAXS184E complex exhibits minimal pore formation. c To simulate conditions in which rTOMM20 associates with rBAX under blue light irradiation, endo-BAX, rBAX and rTOMM20 were combined in a 5:3:2 ratio. Membrane-embedded residues are highlighted in pink, and the remnants are shown in gray. Both the top and side views are presented. The DBAXS184E–rTOMM20 (DBT) complex displays limited hydrophobic motif insertion into the MOM compared to the HBAXS184E–rTOMM20 (HBT) complex.CC BY · PubMed Central
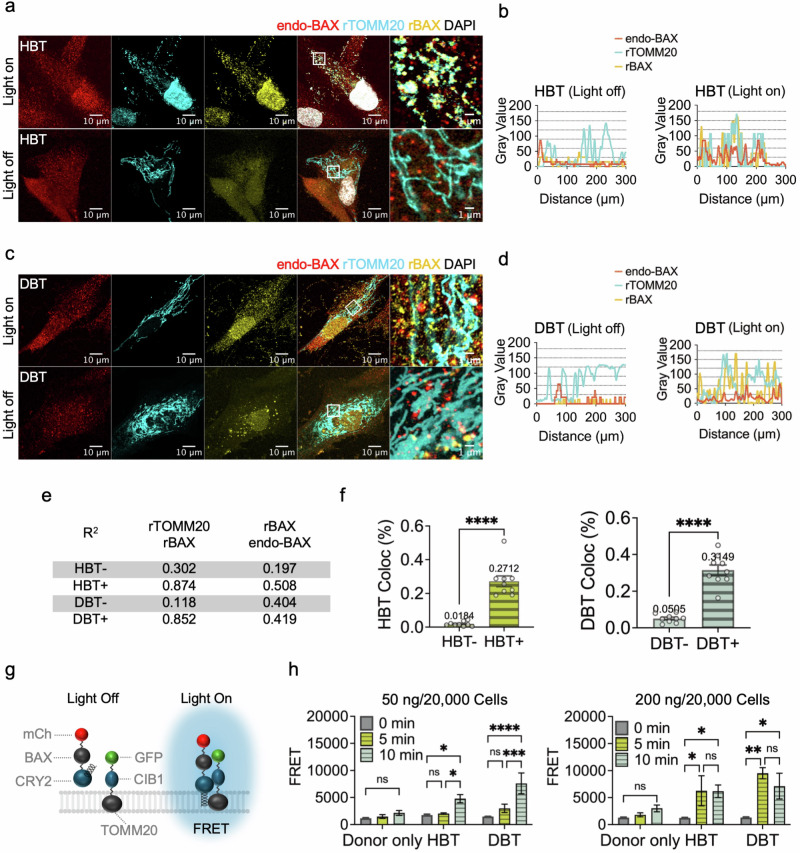
Fig. 3 Optogenetic control of DBT and its impact on endo-BAX. a, c Representative immunofluorescence images illustrating the colocalization of endo-BAX, rTOMM20 and rBAX in cells transfected with either the HBT (a) or DBT (c) complex and subjected to blue light irradiation. The images are shown under conditions of continuous blue light exposure (‘Light On’) or in the absence of light (‘Light Off’). b, d The intensity profiles corresponding to the boxed regions in the microscopy images for a (b) and c (d). The red, cyan and yellow lines represent the intensities of endo-BAX, rTOMM20 and rBAX, respectively. e The R² values (coefficient of determination) from simple linear regression analyses of rTOMM20–rBAX and rBAX–endo-BAX interactions in HBT or DBT conditions under dark and blue light conditions (n = 5 per group). f Bar graphs showing the colocalization ratio (Coloc%) between rTOMM20 and rBAX in cells transfected with HBT or DBT (n = 6 per group). The negative sign indicates nonirradiated cells, and the positive sign indicates blue-light-irradiated cells. Statistical significance was determined by unpaired t-tests (****P < 0.0001). g A schematic of rBAX within the DBT unit. Upon blue light irradiation, DBT units associate, facilitating interactions between mCherry (mCh) and GFP, which enables FRET. h A quantification of FRET efficiency between the GFP donor and mCh acceptor, showing increased efficiency under prolonged blue light irradiation (n = 6 per group). The data were analyzed by two-way ANOVA with Tukey’s multiple comparisons test. *P < 0.05; **P < 0.01; ***P < 0.001; ****P < 0.0001; ns, not significant; mean ± s.e.m. for all data. See also Supplementary Figs. 8 and 9 for more details.
Fig. 3 Optogenetic control of DBT and its impact on endo-BAX. a, c Representative immunofluorescence images illustrating the colocalization of endo-BAX, rTOMM20 and rBAX in cells transfected with either the HBT (a) or DBT (c) complex and subjected to blue light irradiation. The images are shown under conditions of continuous blue light exposure (‘Light On’) or in the absence of light (‘Light Off’). b, d The intensity profiles corresponding to the boxed regions in the microscopy images for a (b) and c (d). The red, cyan and yellow lines represent the intensities of endo-BAX, rTOMM20 and rBAX, respectively. e The R² values (coefficient of determination) from simple linear regression analyses of rTOMM20–rBAX and rBAX–endo-BAX interactions in HBT or DBT conditions under dark and blue light conditions (n = 5 per group). f Bar graphs showing the colocalization ratio (Coloc%) between rTOMM20 and rBAX in cells transfected with HBT or DBT (n = 6 per group). The negative sign indicates nonirradiated cells, and the positive sign indicates blue-light-irradiated cells. Statistical significance was determined by unpaired t-tests (****P < 0.0001). g A schematic of rBAX within the DBT unit. Upon blue light irradiation, DBT units associate, facilitating interactions between mCherry (mCh) and GFP, which enables FRET. h A quantification of FRET efficiency between the GFP donor and mCh acceptor, showing increased efficiency under prolonged blue light irradiation (n = 6 per group). The data were analyzed by two-way ANOVA with Tukey’s multiple comparisons test. *P < 0.05; **P < 0.01; ***P < 0.001; ****P < 0.0001; ns, not significant; mean ± s.e.m. for all data. See also Supplementary Figs. 8 and 9 for more details.CC BY · PubMed Central
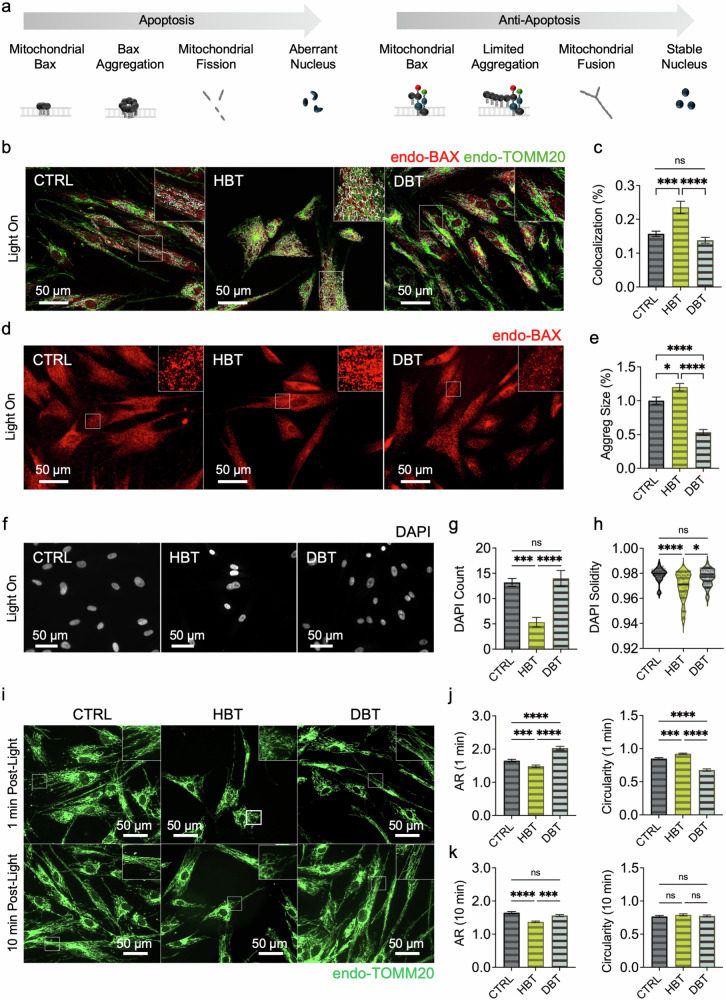
Fig. 4 Assessment of BAX translocation to mitochondria, nuclear aberrations and mitochondrial morphology. a A schematic representation of sequential events in apoptosis versus antiapoptotic pathways. In the apoptotic scenario, BAX translocates to mitochondria and aggregates, triggering fission and aberrant nuclear morphology. Conversely, the DBT unit limits mitochondrial BAX aggregation, thereby preserving fusion and maintaining stable nuclear morphology. b Representative immunofluorescence images of endo-BAX (red) and endo- TOMM20 (green). White regions indicate BAX–mitochondria colocalization. c A quantification of BAX–mitochondria colocalization (n = 10 per group). Statistical analysis was performed using the Kruskal–Wallis test with Dunn’s multiple comparisons. ***P < 0.001; ****P < 0.0001. d Microscopic images of endo-BAX aggregation using size-filtered puncta analysis. e A quantification of BAX aggregate size (n = 300 per group) analyzed by the Kruskal–Wallis test with Dunn’s multiple comparisons. *P < 0.05; ****P < 0.0001; ns, non-significant. f Representative DAPI-stained nuclei. g A quantification of cell number based on DAPI counts per ROI (n = 10 per group) analyzed by one-way ANOVA with Tukey’s post hoc test. h Analysis of nuclear solidity (defined as the ratio of nuclear area to its convex hull area; n = 40 per group). Data were analyzed by the Kruskal–Wallis test with Dunn’s multiple comparisons. *P < 0.05; ***P < 0.001; ****P < 0.0001; ns, non-significant. i Representative images of mitochondrial morphology in cells labeled with anti-TOMM20, captured immediately after 20 min blue light irradiation or following an additional 10 min dark incubation post irradiation. j, k A qantification of mitochondrial aspect ratio (AR) and circularity (n = 300 per group) analyzed by the Kruskal–Wallis test with Dunn’s multiple comparisons. *P < 0.05; ***P < 0.001; ****P < 0.0001; ns, non-significant; Q10 mean ± s.e.m. for all data. See also Supplementary Figs. 10–16 for more details.
Fig. 4 Assessment of BAX translocation to mitochondria, nuclear aberrations and mitochondrial morphology. a A schematic representation of sequential events in apoptosis versus antiapoptotic pathways. In the apoptotic scenario, BAX translocates to mitochondria and aggregates, triggering fission and aberrant nuclear morphology. Conversely, the DBT unit limits mitochondrial BAX aggregation, thereby preserving fusion and maintaining stable nuclear morphology. b Representative immunofluorescence images of endo-BAX (red) and endo- TOMM20 (green). White regions indicate BAX–mitochondria colocalization. c A quantification of BAX–mitochondria colocalization (n = 10 per group). Statistical analysis was performed using the Kruskal–Wallis test with Dunn’s multiple comparisons. ***P < 0.001; ****P < 0.0001. d Microscopic images of endo-BAX aggregation using size-filtered puncta analysis. e A quantification of BAX aggregate size (n = 300 per group) analyzed by the Kruskal–Wallis test with Dunn’s multiple comparisons. *P < 0.05; ****P < 0.0001; ns, non-significant. f Representative DAPI-stained nuclei. g A quantification of cell number based on DAPI counts per ROI (n = 10 per group) analyzed by one-way ANOVA with Tukey’s post hoc test. h Analysis of nuclear solidity (defined as the ratio of nuclear area to its convex hull area; n = 40 per group). Data were analyzed by the Kruskal–Wallis test with Dunn’s multiple comparisons. *P < 0.05; ***P < 0.001; ****P < 0.0001; ns, non-significant. i Representative images of mitochondrial morphology in cells labeled with anti-TOMM20, captured immediately after 20 min blue light irradiation or following an additional 10 min dark incubation post irradiation. j, k A qantification of mitochondrial aspect ratio (AR) and circularity (n = 300 per group) analyzed by the Kruskal–Wallis test with Dunn’s multiple comparisons. *P < 0.05; ***P < 0.001; ****P < 0.0001; ns, non-significant; Q10 mean ± s.e.m. for all data. See also Supplementary Figs. 10–16 for more details.CC BY · PubMed Central
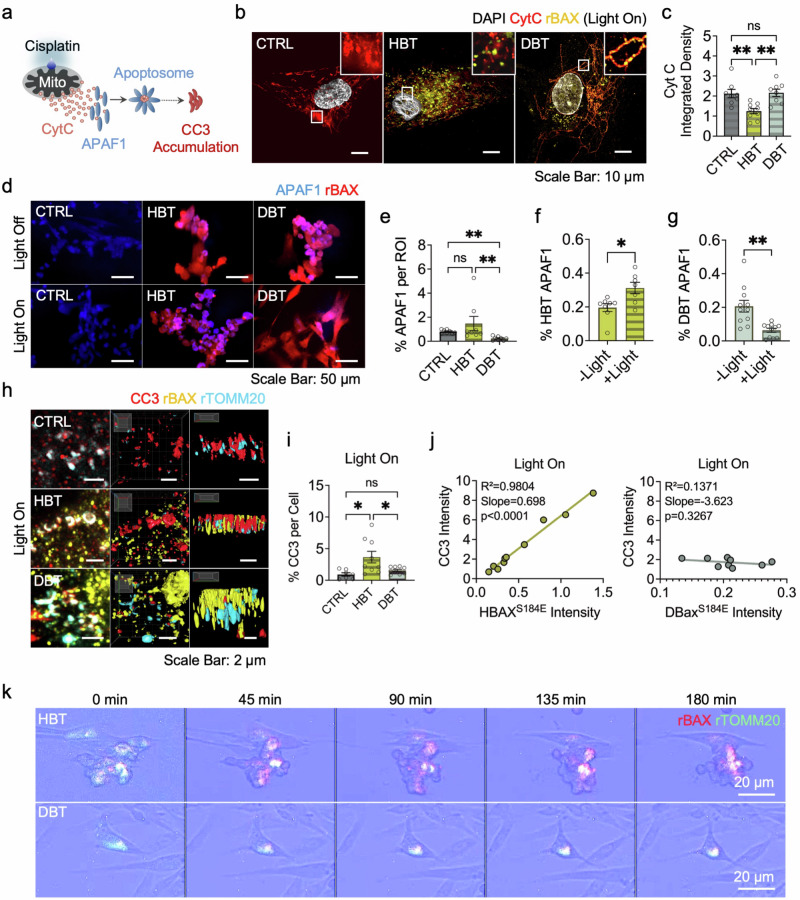
Fig. 5 Assessment of DBT antiapoptotic functionality following cisplatin-induced apoptosis using immunofluorescence and live-cell imaging. a A schematic of the experimental design. The cells were treated with cisplatin to induce apoptosis, followed by 10 min of blue light irradiation. Cisplatin triggers CytC release from mitochondria into the cytosol, where it binds APAF1 to form the apoptosome, leading to the accumulation of CC3. b CytC localization and rBAX distribution. Immunofluorescence analysis revealed that intact cells retain CytC within mitochondria, whereas apoptotic cells exhibit a diffuse, smudged CytC pattern indicative of leakage. A decrease in CytC integrated density indicates leakage. c A bar graph illustrating the decrease in CytC integrated density in the HBT condition, with statistical significance determined by one-way ANOVA and Tukey’s post hoc test (n = 9 per group). **P < 0.01; ns, non-significant. d A visualization of APAF1 accumulation in each condition. e A quantification of APAF1 accumulation under blue light irradiation was performed using the Kruskal–Wallis test with Dunn’s multiple comparisons (n = 8 per group) (see also Supplementary Figs. 20 and 21 for more details). f, g rBAX–APAF1 colocalization was assessed using an unpaired t-test for HBT (n = 8) (f) and the Mann–Whitney test for DBT (n = 11) (g). *P < 0.05; **P < 0.01; ns, non-significant. h–j CC3 accumulation and its colocalization with the rBAX–rTOMM20 unit. h Representative 3D-rendered z-stack images illustrate CC3 colocalizing with rBAX–rTOMM20 following drug treatment and blue light irradiation. i Analysis of normalized CC3 levels per cell was performed using one-way ANOVA with Tukey’s post hoc test (n = 8 per group). j To evaluate rBAX–CC3 colocalization, a correlation analysis was conducted under blue light conditions, with the R², slope and P value reported (n = 8 per group). k Live-cell imaging. Time-lapse recordings over 3 h demonstrate the spatial overlap of recombinant proteins and progressive changes in cell morphology; mean ± s.e.m. for all data. See also Supplementary Figs. 17–24 and Supplementary Video 1 for more details.
Fig. 5 Assessment of DBT antiapoptotic functionality following cisplatin-induced apoptosis using immunofluorescence and live-cell imaging. a A schematic of the experimental design. The cells were treated with cisplatin to induce apoptosis, followed by 10 min of blue light irradiation. Cisplatin triggers CytC release from mitochondria into the cytosol, where it binds APAF1 to form the apoptosome, leading to the accumulation of CC3. b CytC localization and rBAX distribution. Immunofluorescence analysis revealed that intact cells retain CytC within mitochondria, whereas apoptotic cells exhibit a diffuse, smudged CytC pattern indicative of leakage. A decrease in CytC integrated density indicates leakage. c A bar graph illustrating the decrease in CytC integrated density in the HBT condition, with statistical significance determined by one-way ANOVA and Tukey’s post hoc test (n = 9 per group). **P < 0.01; ns, non-significant. d A visualization of APAF1 accumulation in each condition. e A quantification of APAF1 accumulation under blue light irradiation was performed using the Kruskal–Wallis test with Dunn’s multiple comparisons (n = 8 per group) (see also Supplementary Figs. 20 and 21 for more details). f, g rBAX–APAF1 colocalization was assessed using an unpaired t-test for HBT (n = 8) (f) and the Mann–Whitney test for DBT (n = 11) (g). *P < 0.05; **P < 0.01; ns, non-significant. h–j CC3 accumulation and its colocalization with the rBAX–rTOMM20 unit. h Representative 3D-rendered z-stack images illustrate CC3 colocalizing with rBAX–rTOMM20 following drug treatment and blue light irradiation. i Analysis of normalized CC3 levels per cell was performed using one-way ANOVA with Tukey’s post hoc test (n = 8 per group). j To evaluate rBAX–CC3 colocalization, a correlation analysis was conducted under blue light conditions, with the R², slope and P value reported (n = 8 per group). k Live-cell imaging. Time-lapse recordings over 3 h demonstrate the spatial overlap of recombinant proteins and progressive changes in cell morphology; mean ± s.e.m. for all data. See also Supplementary Figs. 17–24 and Supplementary Video 1 for more details.CC BY · PubMed Central

Verification

Claims the paper makes

The claims and statistics of this paper haven’t been checked yet.

Run the check — free, no account needed. It reads the open-access text and checks the sources it cites.

A few free checks a day · papers already verified open instantly · results are public

Self-check

Percentages, sums and reported differences re-computed from the paper’s own numbers.

The self-check needs the paper’s full text.

Citations

Cites

Research works printed but not linked: 44

  1. Cory, S. & Adams, J. M. The Bcl2 family: regulators of the cellular life-or-death switch. Nat. Rev. Cancer 2, 647–656 (2002). · DOI · Paper page
  2. Cosentino, K. & García-Sáez, A. J. Bax and Bak pores: are we closing the circle?. Trends Cell Biol. 27, 266–275 (2017). · DOI
  3. Gavathiotis, E., Reyna, D. E., Davis, M. L., Bird, G. H. & Walensky, L. D. BH3-triggered structural reorganization drives the activation of proapoptotic BAX. Mol. Cell 40, 481–492 (2010). · DOI · Paper page
  4. Annis, M. G. et al. Bax forms multispanning monomers that oligomerize to permeabilize membranes during apoptosis. EMBO J. 24, 2096–2103 (2005). · DOI
  5. Suzuki, M., Youle, R. J. & Tjandra, N. Structure of Bax. Cell 103, 645–654 (2000). · DOI
  6. Peña-Blanco, A. & García-Sáez, A. J. Bax, Bak and beyond—mitochondrial performance in apoptosis. FEBS J. 285, 416–431 (2018). · DOI
  7. Bagci, E. Z., Vodovotz, Y., Billiar, T. R., Ermentrout, G. B. & Bahar, I. Bistability in apoptosis: roles of Bax, Bcl-2, and mitochondrial permeability transition pores. Biophys J. 90, 1546–1559 (2006). · DOI
  8. Tan, C. et al. Auto-activation of the apoptosis protein Bax increases mitochondrial membrane permeability and is inhibited by Bcl-2. J. Biol. Chem. 281, 14764–14775 (2006). · DOI
  9. Teles, A. V. F. F. et al. Increase in bax expression and apoptosis are associated in Huntington’s disease progression. Neurosci. Lett. 438, 59–63 (2008). · DOI
  10. Yin, C., Knudson, C. M., Korsmeyer, S. J. & Dyke, T. Van. Bax suppresses tumorigenesis and stimulates apoptosis in vivo. Nature 385, 637–640 (1997). · DOI
  11. MacGibbon, G. A. et al. Bax expression in mammalian neurons undergoing apoptosis, and in Alzheimer’s disease hippocampus. Brain Res. 750, 223–234 (1997). · DOI
  12. Aggarwal, S. & Gupta, S. Increased apoptosis of T cell subsets in aging humans: altered expression of Fas (CD95), Fas ligand, Bcl-2, and Bax. J. Immunol. 160, 1627–1637 (1998). · DOI
  13. Takeuchi, O. et al. Essential role of BAX,BAK in B cell homeostasis and prevention of autoimmune disease. Proc. Natl Acad. Sci. USA 102, 11272–11277 (2005). · DOI
  14. Lee, Y. & Gustafsson, ÅB. Role of apoptosis in cardiovascular disease. Apoptosis 14, 536–548 (2009). · DOI
  15. Kim, N.-H. & Kang, P. M. Apoptosis in cardiovascular diseases: mechanism and clinical implications. Korean Circ. J. 40, 299 (2010). · DOI
  16. Carneiro, B. A. & El-Deiry, W. S. Targeting apoptosis in cancer therapy. Nat. Rev. Clin. Oncol. 17, 395–417 (2020). · DOI
  17. Liu, Z. et al. Direct activation of bax protein for cancer therapy. Med. Res. Rev. 36, 313–341 (2016). · DOI
  18. Zhang, L., Yu, J., Park, B. H., Kinzler, K. W. & Vogelstein, B. Role of BAX in the apoptotic response to anticancer agents. Science 290, 989–992 (2000). · DOI · Paper page
  19. Jenner, P. & Warren Olanow, C. Understanding cell death in Parkinson's disease. Ann. Neurol 44, S72–S84 (1998). · DOI
  20. Moujalled, D., Strasser, A. & Liddell, J. R. Molecular mechanisms of cell death in neurological diseases. Cell Death Differ. 28, 2029–2044 (2021). · DOI · Paper page
  21. Emiliani, V. et al. Optogenetics for light control of biological systems. Nat. Rev. Methods Primers 2, 55 (2022). · DOI
  22. Duan, L. et al. Understanding CRY2 interactions for optical control of intracellular signaling. Nat. Commun. 8, 547 (2017). · DOI
  23. Che, D. L., Duan, L., Zhang, K. & Cui, B. The dual characteristics of light-induced cryptochrome 2, homo-oligomerization and heterodimerization, for optogenetic manipulation in mammalian cells. ACS Synth. Biol. 4, 1124–1135 (2015). · DOI
  24. Godwin, W. C., Hoffmann, G. F., Gray, T. J. & Hughes, R. M. Imaging of morphological and biochemical hallmarks of apoptosis with optimized optogenetic tools. J. Biol. Chem. 294, 16918–16929 (2019). · DOI
  25. Gavathiotis, E. et al. BAX activation is initiated at a novel interaction site. Nature 455, 1076–1081 (2008). · DOI · Paper page
  26. Garner, T. P. et al. An autoinhibited dimeric form of BAX regulates the BAX activation pathway. Mol. Cell 63, 485–497 (2016). · DOI · Paper page
  27. Hughes, R. M. et al. Optogenetic apoptosis: light-triggered cell death. Angewandte Chemie Int. Ed. 54, 12064–12068 (2015). · DOI
  28. Mirdita, M. et al. ColabFold: making protein folding accessible to all. Nat Methods 19, 679–682 (2022). · DOI · Paper page
  29. Baliga, B. & Kumar, S. Apaf-1/cytochrome c apoptosome: an essential initiatorof caspase activation or just a sideshow?. Cell Death Differ. 10, 16–18 (2003). · DOI
  30. Youle, R. J. & Karbowski, M. Mitochondrial fission in apoptosis. Nat. Rev. Mol. Cell Biol. 6, 657–663 (2005). · DOI
  31. Doonan, F. & Cotter, T. G. Morphological assessment of apoptosis. Methods 44, 200–204 (2008). · DOI
  32. Ma, L. et al. Structural insights into the photoactivation of Arabidopsis CRY2. Nat. Plants 6, 1432–1438 (2020). · DOI
  33. Hauseman, Z. J. et al. Homogeneous oligomers of pro-apoptotic BAX reveal structural determinants of mitochondrial membrane permeabilization. Mol. Cell 79, 68–83.e7 (2020). · DOI
  34. Nascimento, L. do, Nicoletti, N. F., Peletti-Figueiró, M., Marinowic, D. & Falavigna, A. Hyaluronic acid in vitro response: viability and proliferation profile of human chondrocytes in 3D-based culture. Cartilage 13, 1077S–1087S (2021). · DOI
  35. Shamseldin, H. E. et al. NUP214 deficiency causes severe encephalopathy and microcephaly in humans. Hum. Genet. 138, 221–229 (2019). · DOI
  36. Garcia, D. A., Powers, A. F., Bell, T. A., Guo, S. & Aghajan, M. Antisense oligonucleotide-mediated silencing of mitochondrial fusion and fission factors modulates mitochondrial dynamics and rescues mitochondrial dysfunction. Nucleic Acid Ther. 32, 51–65 (2022). · DOI
  37. Westrate, L. M., Drocco, J. A., Martin, K. R., Hlavacek, W. S. & MacKeigan, J. P. Mitochondrial morphological features are associated with fission and fusion events. PLoS ONE 9, e95265 (2014). · DOI
  38. Zhou, L. & Chang, D. C. Dynamics and structure of the Bax–Bak complex responsible for releasing mitochondrial proteins during apoptosis. J. Cell Sci. 121, 2186–2196 (2008). · DOI
  39. Nunnari, J. et al. Mitochondrial transmission during mating in Saccharomyces cerevisiae is determined by mitochondrial fusion and fission and the intramitochondrial segregation of mitochondrial DNA. Mol. Biol. Cell 8, 1233–1242 (1997). · DOI
  40. Al Ojaimi, M., Salah, A. & El-Hattab, A. Mitochondrial fission and fusion: molecular mechanisms, biological functions, and related disorders. Membranes 12, 893 (2022). · DOI
  41. Fang, C. et al. Natural products: potential treatments for cisplatin-induced nephrotoxicity. Acta Pharmacol. Sin. 42, 1951–1969 (2021). · DOI
  42. Obashi, K. & Okabe, S. Regulation of mitochondrial dynamics and distribution by synapse position and neuronal activity in the axon. Eur. J. Neurosci. 38, 2350–2363 (2013). · DOI
  43. Karbowski, M. et al. Spatial and temporal association of Bax with mitochondrial fission sites, DRP1, and Mfn2 during apoptosis. J Cell Biol 159, 931–938 (2002). · DOI · Paper page
  44. Montessuit, S. et al. Membrane remodeling induced by the dynamin-related protein DRP1 stimulates Bax oligomerization. Cell 142, 889–901 (2010). · DOI

Metadata

Authors
Lee, D., Bae, H., Oh, D., Kim, M., Kim, J.-H., Ahn, J., Kang, S.-H., You, S.-H., Kim, D.-H., Oh, H. J., Heo, W. D., & Chung, S.
Affiliations
  • Korea University (KR)
  • Korea Advanced Institute of Science and Technology (KR)
Corresponding author
Chung, Seok
Venue
Experimental & Molecular Medicine
Published
2025-12-26
Volume
57
Issue
12
Pages
2972-2984
ISSN
  • 1226-3613 (ISSN-L)
  • 2092-6413
OpenAlex
W7117321027
Cited by
2
References
3
Citations by year
2026: 2
FWCI
0.60
Type
journal article
Language
en
Open access
Locations
  • Experimental & Molecular Medicine (publishedVersion, cc-by)
  • Research Square (acceptedVersion, cc-by)
  • PubMed (publishedVersion)
  • PubMed Central (publishedVersion, cc-by)
  • DOAJ (DOAJ: Directory of Open Access Journals) (submittedVersion, cc-by-sa)
Funders
  • National Research Foundation
  • National Research Foundation of Korea (RS‐2024‐00440577)
  • Ministry of Science and ICT, South Korea (20012378, RS-2024-00440577)
Topics
  • Life Sciences › Biochemistry, Genetics and Molecular Biology › Molecular Biology › Cell death mechanisms and regulation
  • Life Sciences › Biochemistry, Genetics and Molecular Biology › Molecular Biology › Mitochondrial Function and Pathology
  • Life Sciences › Neuroscience › Cellular and Molecular Neuroscience › Photoreceptor and optogenetics research
Keywords
Bax, optogenetics, CRY2, CIB1, mitochondrial membrane permeabilization, apoptosis, apoptosis inhibition, protein engineering, mitochondrial outer membrane, neurodegenerative diseases
MeSH terms
Humans, Mitochondria, Permeability, Protein Engineering, Apoptosis, bcl-2-Associated X Protein, Mitochondrial Membranes, Cryptochromes, Optogenetics

About these checks

Registry, retraction, Cites and statistics results are computed, not judged, with one exception: a printed reference that no index lists is read once by a model before it counts as a citation error. Claims are extracted by a model and kept only when their quote appears verbatim in the text; each cited source is then checked, with a model’s help, for whether it says what the claim relies on. Those verdicts can be wrong — read the claim’s quote and the cited source before relying on one.

Statistics and arithmetic are recomputed, not judged.

Confidence bands are shown only for fields calibrated on our annotated test set. None is calibrated yet, so no band is shown.

What counts as a claim ›How we measure confidence ›How we check this ›

Are you an author, or do you see a problem with this page? Request a review