

The DOI matches its Crossref record; 48 of the 48 references it cites were found in a registry or an index.
A deep learning-enabled portable imaging flow cytometer for cost-effective, high-throughput, and label-free analysis of natural water samples
Open accessAbstract
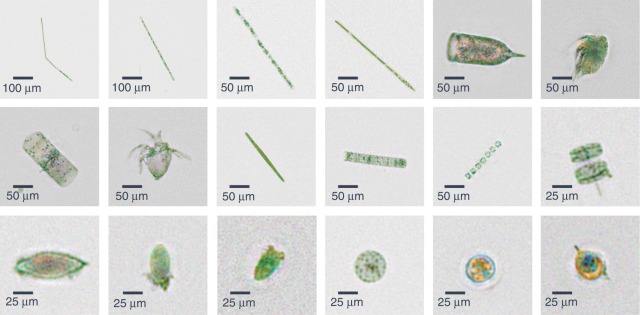
We report a deep learning-enabled field-portable and cost-effective imaging flow cytometer that automatically captures phase-contrast color images of the contents of a continuously flowing water sample at a throughput of 100 mL/h. The device is based on partially coherent lens-free holographic microscopy and acquires the diffraction patterns of flowing micro-objects inside a microfluidic channel. These holographic diffraction patterns are reconstructed in real time using a deep learning-based phase-recovery and image-reconstruction method to produce a color image of each micro-object without the use of external labeling. Motion blur is eliminated by simultaneously illuminating the sample with red, green, and blue light-emitting diodes that are pulsed. Operated by a laptop computer, this portable device measures 15.5 cm × 15 cm × 12.5 cm, weighs 1 kg, and compared to standard imaging flow cytometers, it provides extreme reductions of cost, size and weight while also providing a high volumetric throughput over a large object size range. We demonstrated the capabilities of this device by measuring ocean samples at the Los Angeles coastline and obtaining images of its micro- and nanoplankton composition. Furthermore, we measured the concentration of a potentially toxic alga (Pseudo-nitzschia) in six public beaches in Los Angeles and achieved good agreement with measurements conducted by the California Department of Public Health. The cost-effectiveness, compactness, and simplicity of this computational platform might lead to the creation of a network of imaging flow cytometers for large-scale and continuous monitoring of the ocean microbiome, including its plankton composition.
Overview
The claims and statistics of this paper haven’t been checked yet.
Free: it reads the open-access text and checks the first 5 claims that cite a source we can check. Create a free account to check every claim.
Integrity signals
Registry
Cites
Statistics
Figures




Verification
Claims the paper makes
The claims and statistics of this paper haven’t been checked yet.
Free: it reads the open-access text and checks the first 5 claims that cite a source we can check. Create a free account to check every claim.
Claims other papers make about this one
Each is checked against this paper’s own text: does it say what the citing paper says it does?
The cited source says what the claim attributes to it.
In the citing paper
“However, the technologies based on images are easily time-consuming, and their quality and efficiency are easily subjected to the tradeoff between resolution and visual field.”
From Simultaneously Acquiring Optical and Acoustic Properties of Individual Microalgae Cells Suspended in Water (2022) · cites this paper as [6]
Self-check
Percentages, sums and reported differences re-computed from the paper’s own numbers.
The self-check needs the paper’s full text.
Citations
Cites
Primary production of the biosphere: Integrating terrestrial and oceanic components
Field, C. B., Behrenfeld, M. J., Randerson, J. T., & Falkowski, P. (1998) · Science · doi:10.1126/science.281.5374.237 · Cited by 6,371
Phase recovery and holographic image reconstruction using deep learning in neural networks
Rivenson, Y., Zhang, Y., Günaydın, H., Teng, D., & Ozcan, A. (2017) · Light: Science & Applications · doi:10.1038/lsa.2017.141 · Cited by 1,059
Self-citationMovable Aperture Lensless Transmission Microscopy: A Novel Phase Retrieval Algorithm
Faulkner, H. M. L., & Rodenburg, J. M. (2004) · Physical Review Letters · doi:10.1103/physrevlett.93.023903 · Cited by 839
Biospheric Primary Production During an ENSO Transition
Behrenfeld, M. J., Randerson, J. T., McClain, C. R., Feldman, G. C., Los, S. O., Tucker, C. J., Falkowski, P. G., Field, C. B., Frouin, R., Esaias, W. E., et al. (2001) · Science · doi:10.1126/science.1055071 · Cited by 649
Digital in-line holography for biological applications
Xu, W., Jericho, M. H., Meinertzhagen, I. A., & Kreuzer, H. J. (2001) · Proceedings of the National Academy of Sciences · doi:10.1073/pnas.191361398 · Cited by 576
Phase-retrieval stagnation problems and solutions
Fienup, J. R., & Wackerman, C. C. (1986) · Journal of the Optical Society of America A · doi:10.1364/josaa.3.001897 · Cited by 538
Gobler, C. J., Doherty, O. M., Hattenrath-Lehmann, T. K., Griffith, A. W., Kang, Y., & Litaker, R. W. (2017) · Proceedings of the National Academy of Sciences · doi:10.1073/pnas.1619575114 · Cited by 537
A submersible imaging‐in‐flow instrument to analyze nano‐and microplankton: Imaging FlowCytobot
Olson, R. J., & Sosik, H. M. (2007) · Limnology and Oceanography: Methods · doi:10.4319/lom.2007.5.195 · Cited by 472
Chaos in a long-term experiment with a plankton community
Benincà, E., Huisman, J., Heerkloss, R., Jöhnk, K. D., Branco, P., Van Nes, E. H., Scheffer, M., & Ellner, S. P. (2008) · Nature · doi:10.1038/nature06512 · Cited by 455
Lensfree on-chip microscopy over a wide field-of-view using pixel super-resolution
Bishara, W., Su, T.-W., Coskun, A. F., & Ozcan, A. (2010) · Optics Express · doi:10.1364/oe.18.011181 · Cited by 440
Cited by
Roadmap on digital holography [Invited]
Javidi, B., Carnicer, A., Anand, A., Barbastathis, G., Chen, W., Ferraro, P., Goodman, J. W., Horisaki, R., Khare, K., Kujawinska, M., et al. (2021) · Optics Express · doi:10.1364/oe.435915 · Cited by 309
Deep learning in holography and coherent imaging
Rivenson, Y., Wu, Y., & Ozcan, A. (2019) · Light: Science & Applications · doi:10.1038/s41377-019-0196-0 · Cited by 290
Self-citationMachine learning in point-of-care testing: innovations, challenges, and opportunities
Han, G.-R., Goncharov, A., Eryilmaz, M., Ye, S., Palanisamy, B., Ghosh, R., Lisi, F., Rogers, E., Guzman, D., Yigci, D., et al. (2025) · Nature Communications · doi:10.1038/s41467-025-58527-6 · Cited by 239
Machine learning and computation-enabled intelligent sensor design
Ballard, Z., Brown, C., Madni, A. M., & Ozcan, A. (2021) · Nature Machine Intelligence · doi:10.1038/s42256-021-00360-9 · Cited by 247
Review—Recent Progress in Portable Fluorescence Sensors
Shin, Y.-H., Teresa Gutierrez-Wing, M., & Choi, J.-W. (2021) · Journal of The Electrochemical Society · doi:10.1149/1945-7111/abd494 · Cited by 243
Metadata
- Authors
- Gӧrӧcs, Z., Tamamitsu, M., Bianco, V., Wolf, P., Roy, S., Shindo, K., Yanny, K., Wu, Y., Koydemir, H. C., Rivenson, Y., & Ozcan, A.
- Affiliations
- California NanoSystems Institute (US)
- University of California, Los Angeles (US)
- ORCID
- Venue
- Light: Science & Applications
- Published
- 2018-09-19
- Volume
- 7
- Issue
- 1
- Pages
- 66-66
- ISSN
- 2047-7538 (ISSN-L)
- PMC
- PMC6143550
- OpenAlex
- W2889672357
- Cited by
- 188
- References
- 48
- Citations by year
- 2026: 9 · 2025: 16 · 2024: 18 · 2023: 32 · 2022: 31 · 2021: 30 · 2020: 23 · 2019: 25 · 2018: 3
- FWCI
- 9.37
- Type
- journal article
- Language
- en
- Open access
- gold
- doi.org
- Licence
- cc-by
- creativecommons.org/licenses/by/4.0 (tdm)
- creativecommons.org/licenses/by/4.0 (vor)
- Locations
- Light Science & Applications (publishedVersion, cc-by)
- Europe PMC (PubMed Central) (publishedVersion, other-oa)
- PubMed Central (publishedVersion, cc-by)
- PubMed (publishedVersion)
- DOAJ (DOAJ: Directory of Open Access Journals) (submittedVersion)
- Funders
- National Science Foundation
- Howard Hughes Medical Institute
- Mary Kay Foundation
- California Department of Public Health
- Engineering Research Centers
- National Institutes of Health
- National Institute of General Medical Sciences (R25GM055052)
- Division of Chemical, Bioengineering, Environmental, and Transport Systems
- Division of Emerging Frontiers in Research and Innovation
- Division of Emerging Frontiers
- Army Research Office
- Life Sciences Division, Army Research Office
- Topics
- Physical Sciences › Physics and Astronomy › Atomic and Molecular Physics, and Optics › Digital Holography and Microscopy
- Physical Sciences › Physics and Astronomy › Atomic and Molecular Physics, and Optics › Random lasers and scattering media
- Physical Sciences › Engineering › Media Technology › Advanced Optical Imaging Technologies
- Keywords
- imaging flow cytometry, phase recovery, microfluidic channels, portable field instrument, low-cost instrumentation, plankton composition, Pseudo-nitzschia, harmful algal bloom monitoring, natural water samples, diffraction pattern reconstruction
About these checks
Registry, retraction, Cites and statistics results are computed, not judged, with one exception: a printed reference that no index lists is read once by a model before it counts as a citation error. Claims are extracted by a model and kept only when their quote appears verbatim in the text; each cited source is then checked, with a model’s help, for whether it says what the claim relies on. Those verdicts can be wrong — read the claim’s quote and the cited source before relying on one.
Statistics and arithmetic are recomputed, not judged.
Confidence bands are shown only for fields calibrated on our annotated test set. None is calibrated yet, so no band is shown.
What counts as a claim ›How we measure confidence ›How we check this ›
Are you an author, or do you see a problem with this page? Request a review
How to cite
Cite CoChat for the checks on this page, and the paper for its own findings.
- This page
- CoChat. (2026). Citation check: A deep learning-enabled portable imaging flow cytometer for cost-effective, high-throughput, and label-free analysis of natural water samples. https://app.cochat.ai/papers/10.1038/s41377-018-0067-0
- The paper
- Gӧrӧcs, Z., Tamamitsu, M., Bianco, V., Wolf, P., Roy, S., Shindo, K., Yanny, K., Wu, Y., Koydemir, H. C., Rivenson, Y., & Ozcan, A. (2018). A deep learning-enabled portable imaging flow cytometer for cost-effective, high-throughput, and label-free analysis of natural water samples. Light: Science & Applications. https://doi.org/10.1038/s41377-018-0067-0
Data sources
Bibliographic data: Semantic Scholar, OpenAlex, Crossref.
Contains information from the Semantic Scholar Academic Graph Datasets, made available under the ODC Attribution License (ODC-BY 1.0).
Semantic Scholar’s data is described in: Kinney, R., et al. (2023). The Semantic Scholar Open Data Platform. arXiv:2301.10140.
