

The DOI matches its Crossref record; 65 of the 65 references it cites were found in a registry or an index.
The gut microbiome modulates the transformation of microglial subtypes
Open accessAbstract
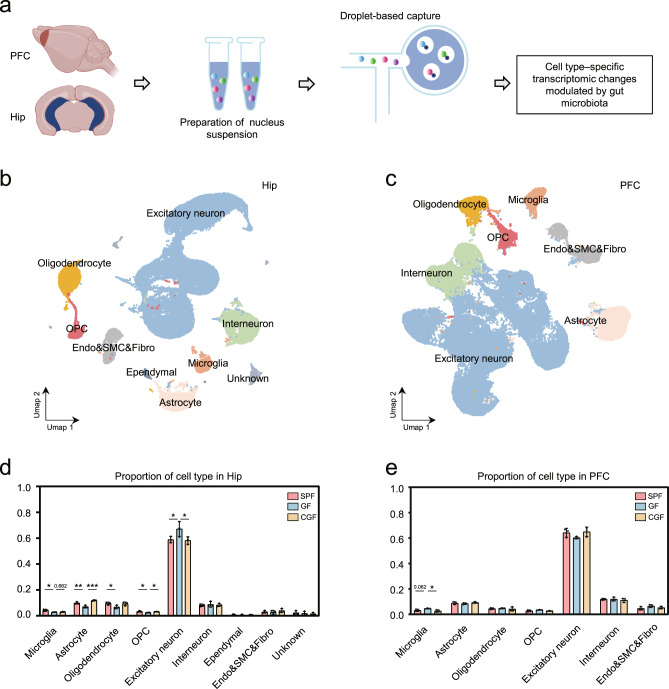
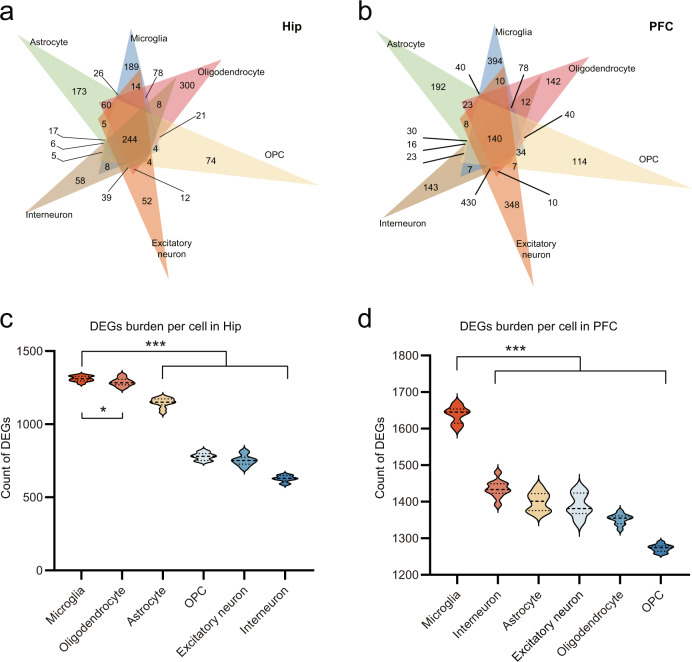
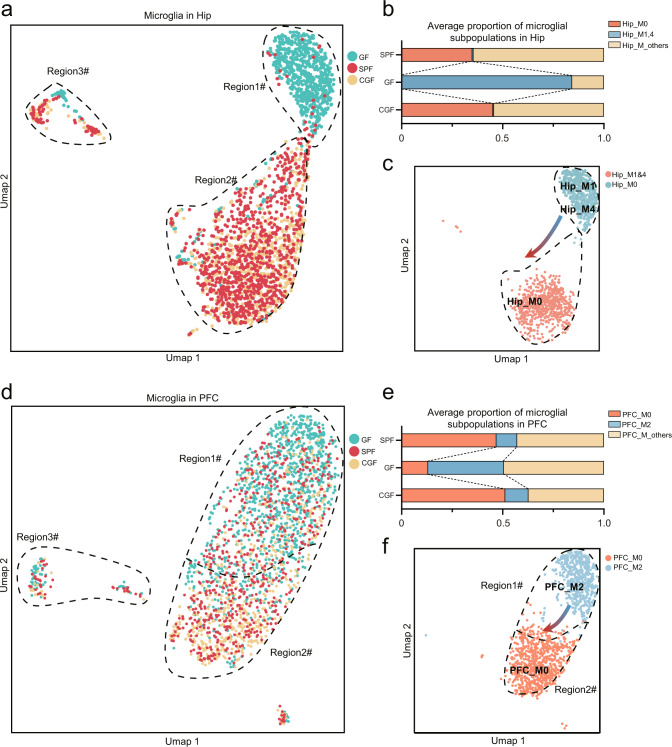
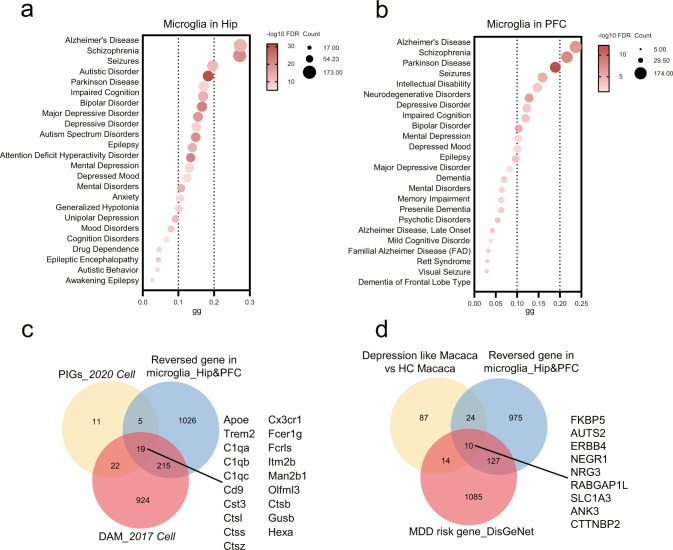
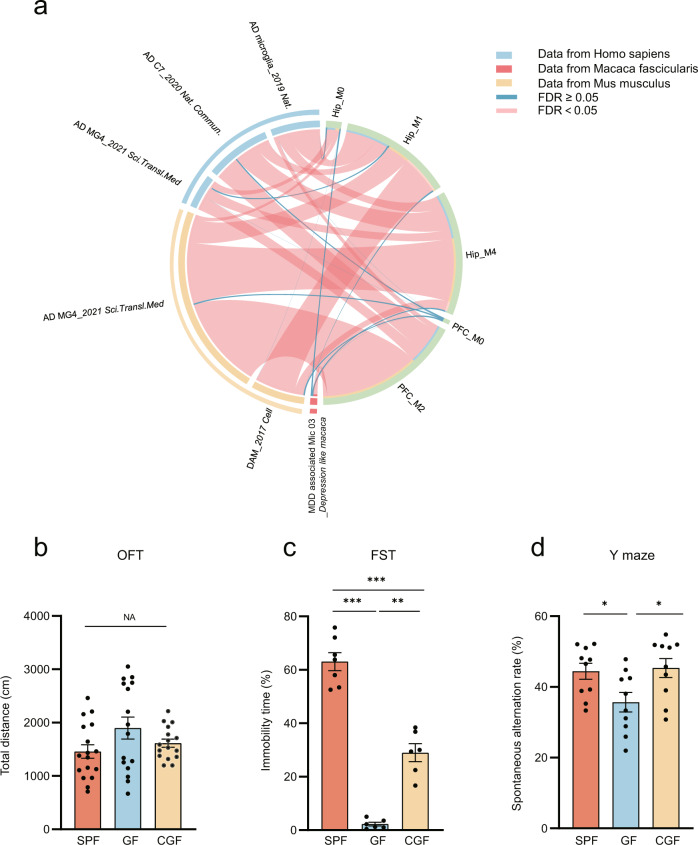
Clinical and animal studies have shown that gut microbiome disturbances can affect neural function and behaviors via the microbiota–gut–brain axis, and may be implicated in the pathogenesis of several brain diseases. However, exactly how the gut microbiome modulates nervous system activity remains obscure. Here, using a single-cell nucleus sequencing approach, we sought to characterize the cell type–specific transcriptomic changes in the prefrontal cortex and hippocampus derived from germ-free (GF), specific pathogen free, and colonized-GF mice. We found that the absence of gut microbiota resulted in cell-specific transcriptomic changes. Furthermore, microglia transcriptomes were preferentially influenced, which could be effectively reversed by microbial colonization. Significantly, the gut microbiome modulated the mutual transformation of microglial subpopulations in the two regions. Cross-species analysis showed that the transcriptome changes of these microglial subpopulations were mainly associated with Alzheimer’s disease (AD) and major depressive disorder (MDD), which were further supported by animal behavioral tests. Our findings demonstrate that gut microbiota mainly modulate the mutual transformation of microglial subtypes, which may lead to new insights into the pathogenesis of AD and MDD.
Overview
The claims and statistics of this paper haven’t been checked yet.
Run the check — free, no account needed. It reads the open-access text and checks the sources it cites.
Integrity signals
Registry
Cites
Statistics
Figures
Verification
Claims the paper makes
The claims and statistics of this paper haven’t been checked yet.
Run the check — free, no account needed. It reads the open-access text and checks the sources it cites.
Claims other papers make about this one
Each is checked against this paper’s own text: does it say what the citing paper says it does?
In the citing paper
“Notably, among the neuronal and glial cells, microglia are the most vulnerable to alterations in the gut microbiome.189”
From Microbiota–gut–brain axis and its therapeutic applications in neurodegenerative diseases (2024) · cites this paper as [189]
Self-check
Percentages, sums and reported differences re-computed from the paper’s own numbers.
The self-check needs the paper’s full text.
Citations
Cites
Glutamate neurotoxicity and diseases of the nervous system
Choi, D. W. (1988) · Neuron · doi:10.1016/0896-6273(88)90162-6 · Cited by 8,188
A Unique Microglia Type Associated with Restricting Development of Alzheimer’s Disease
Keren-Shaul, H., Spinrad, A., Weiner, A., Matcovitch-Natan, O., Dvir-Szternfeld, R., Ulland, T. K., David, E., Baruch, K., Lara-Astaiso, D., Toth, B., et al. (2017) · Cell · doi:10.1016/j.cell.2017.05.018 · Cited by 5,493
Cryan, J. F., O'Riordan, K. J., Cowan, C. S. M., Sandhu, K. V., Bastiaanssen, T. F. S., Boehme, M., Codagnone, M. G., Cussotto, S., Fulling, C., Golubeva, A. V., et al. (2019) · Physiological Reviews · doi:10.1152/physrev.00018.2018 · Cited by 5,286 · cited 1×
“In recent years, important progress has been made in understanding how the gut microbiome affects the brain [1, 2], but its transcriptional changes at the single-cell level have not been uncovered.”
BackgroundReversed graph embedding resolves complex single-cell trajectories
Qiu, X., Mao, Q., Tang, Y., Wang, L., Chawla, R., Pliner, H. A., & Trapnell, C. (2017) · Nature Methods · doi:10.1038/nmeth.4402 · Cited by 5,070
Bravo, J. A., Forsythe, P., Chew, M. V., Escaravage, E., Savignac, H. M., Dinan, T. G., Bienenstock, J., & Cryan, J. F. (2011) · Proceedings of the National Academy of Sciences · doi:10.1073/pnas.1102999108 · Cited by 3,888
Gut microbiota regulate motor deficits and neuroinflammation in a model of Parkinson's disease
Sampson, T. R., Debelius, J. W., Thron, T., Janssen, S., Shastri, G. G., Ilhan, Z. E., Challis, C., Schretter, C. E., Rocha, S., Gradinaru, V., et al. (2016) · Cell · doi:10.1016/j.cell.2016.11.018 · Cited by 3,622
Host microbiota constantly control maturation and function of microglia in the CNS
Erny, D., Hrabě de Angelis, A. L., Jaitin, D., Wieghofer, P., Staszewski, O., David, E., Keren-Shaul, H., Mahlakoiv, T., Jakobshagen, K., Buch, T., et al. (2015) · Nature Neuroscience · doi:10.1038/nn.4030 · Cited by 3,569
Efremova, M., Vento-Tormo, M., Teichmann, S. A., & Vento-Tormo, R. (2020) · Nature Protocols · doi:10.1038/s41596-020-0292-x · Cited by 3,449
Piñero, J., Bravo, À., Queralt-Rosinach, N., Gutiérrez-Sacristán, A., Deu-Pons, J., Centeno, E., García-García, J., Sanz, F., & Furlong, L. I. (2017) · Nucleic Acids Research · doi:10.1093/nar/gkw943 · Cited by 2,680
Single-cell transcriptomic analysis of Alzheimer’s disease
Mathys, H., Davila-Velderrain, J., Peng, Z., Gao, F., Mohammadi, S., Young, J. Z., Menon, M., He, L., Abdurrob, F., Jiang, X., et al. (2019) · Nature · doi:10.1038/s41586-019-1195-2 · Cited by 2,568
Cited by
Sorted by citations
Microbiota–gut–brain axis and its therapeutic applications in neurodegenerative diseases
Loh, J. S., Mak, W. Q., Tan, L. K. S., Ng, C. X., Chan, H. H., Yeow, S. H., Foo, J. B., Ong, Y. S., How, C. W., & Khaw, K. Y. (2024) · Signal Transduction and Targeted Therapy · doi:10.1038/s41392-024-01743-1 · Cited by 1,193
Lu, S., Zhao, Q., Yu, G., Sun, Z., Li, W., Guo, S., & Zhang, A. (2024) · Biomedicine & Pharmacotherapy · doi:10.1016/j.biopha.2024.117207 · Cited by 191
Self-citationGut microbiome-targeted therapies for Alzheimer’s disease
Zhang, T., Gao, G., Kwok, L., & Sun, Z. (2023) · Gut Microbes · doi:10.1080/19490976.2023.2271613 · Cited by 162
Emerging role of the host microbiome in neuropsychiatric disorders: overview and future directions
Hashimoto, K. (2023) · Molecular Psychiatry · doi:10.1038/s41380-023-02287-6 · Cited by 143
Qian, X., Hai, W., Chen, S., Zhang, M., Jiang, X., & Tang, H. (2023) · Gut Microbes · doi:10.1080/19490976.2023.2282790 · Cited by 123
Metadata
- Authors
- Huang, Y., Wu, J., Zhang, H., Li, Y., Wen, L., Tan, X., Cheng, K., Liu, Y., Pu, J., Liu, L., Wang, H., Li, W., Perry, S. W., Wong, M.-L., Licinio, J., Zheng, P., & Xie, P.
- Affiliations
- The Affiliated Yongchuan Hospital of Chongqing Medical University (CN)
- Stomatological Hospital of Chongqing Medical University (CN)
- SUNY Upstate Medical University (US)
- Corresponding author
- Zheng, Peng
- Xie, Peng
- ORCID
- Venue
- Molecular Psychiatry
- Published
- 2023-03-13
- Volume
- 28
- Issue
- 4
- Pages
- 1611-1621
- ISSN
- 1359-4184 (ISSN-L)
- 1476-5578
- PMC
- PMC10208978
- OpenAlex
- W4324129695
- Cited by
- 111
- References
- 65
- Citations by year
- 2026: 33 · 2025: 37 · 2024: 31 · 2023: 10
- FWCI
- 11.36
- Type
- journal article
- Language
- en
- Open access
- hybrid
- doi.org
- Locations
- Molecular Psychiatry (publishedVersion, cc-by)
- PubMed Central (publishedVersion, cc-by)
- PubMed (publishedVersion)
- Funders
- State University of New York
- National Natural Science Foundation of China (82101596, 81820108015, 82171523, 81971296)
- China Postdoctoral Science Foundation (2021MD703928, 2021M693926, 2021TQ0396, 2020TQ0393)
- Chinese Academy of Medical Sciences (2019PT320002)
- Topics
- Life Sciences › Neuroscience › Neurology › Neuroinflammation and Neurodegeneration Mechanisms
- Life Sciences › Biochemistry, Genetics and Molecular Biology › Molecular Biology › Gut microbiota and health
- Life Sciences › Neuroscience › Biological Psychiatry › Tryptophan and brain disorders
- Keywords
- gut microbiota, microbiota-gut-brain axis, microglial subtypes, germ-free mice, microbial colonization, prefrontal cortex, hippocampus, cell type-specific transcriptomics, Alzheimer's disease, major depressive disorder, neuroinflammation
- MeSH terms
- Gastrointestinal Microbiome, Alzheimer Disease, Animals, Depression, Major Depressive Disorder, Prefrontal Cortex, Microglia, Mice
About these checks
Registry, retraction, Cites and statistics results are computed, not judged, with one exception: a printed reference that no index lists is read once by a model before it counts as a citation error. Claims are extracted by a model and kept only when their quote appears verbatim in the text; each cited source is then checked, with a model’s help, for whether it says what the claim relies on. Those verdicts can be wrong — read the claim’s quote and the cited source before relying on one.
Statistics and arithmetic are recomputed, not judged.
Confidence bands are shown only for fields calibrated on our annotated test set. None is calibrated yet, so no band is shown.
What counts as a claim ›How we measure confidence ›How we check this ›
Are you an author, or do you see a problem with this page? Request a review
