

The DOI matches its Crossref record; 57 of the 58 references it cites were found in a registry or an index, and 1 are not checked yet.
Predicting responses to platin chemotherapy agents with biochemically-inspired machine learning
Open accessPublished version of a preprint
Abstract
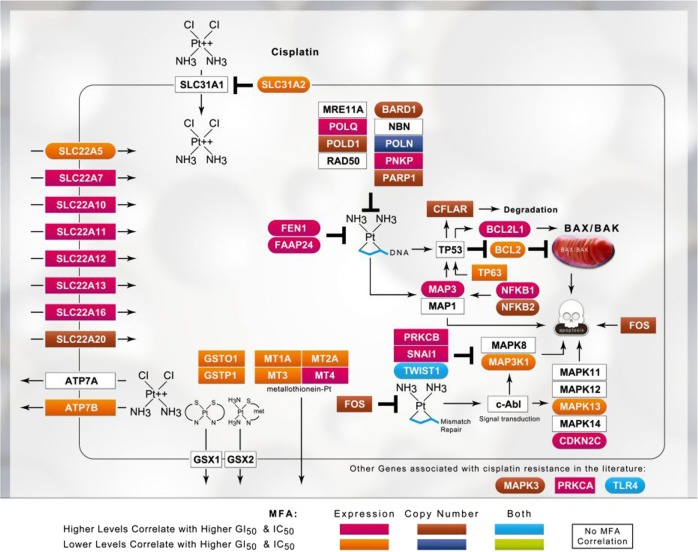
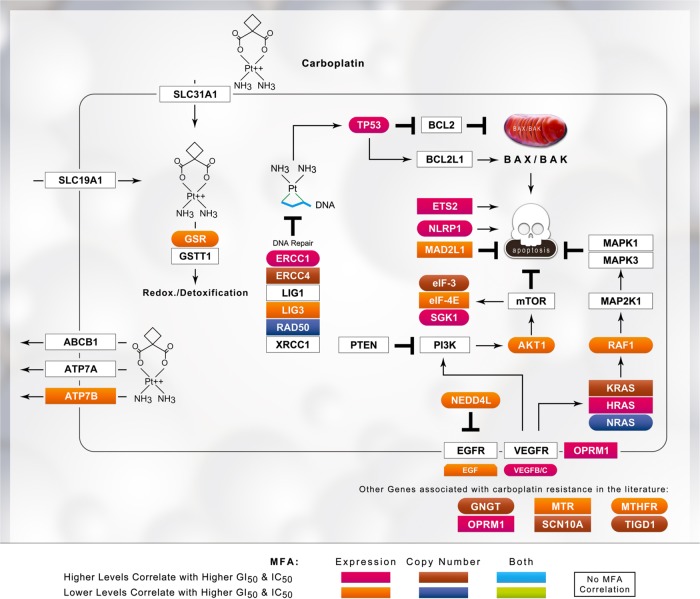
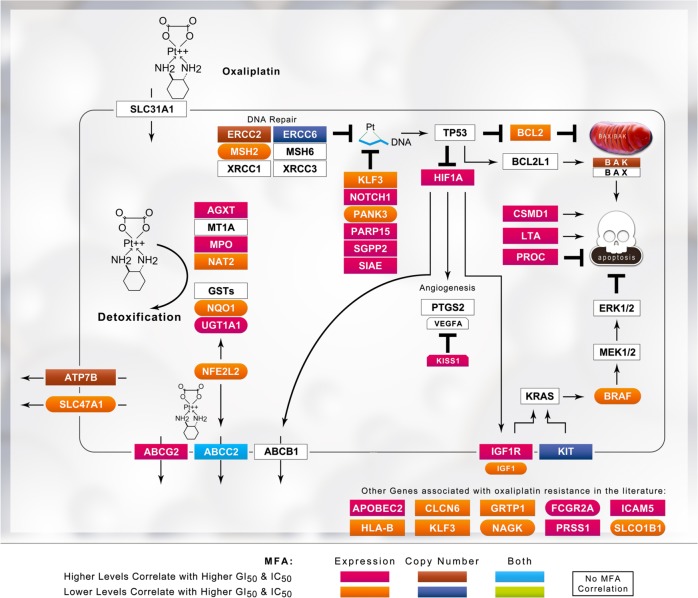
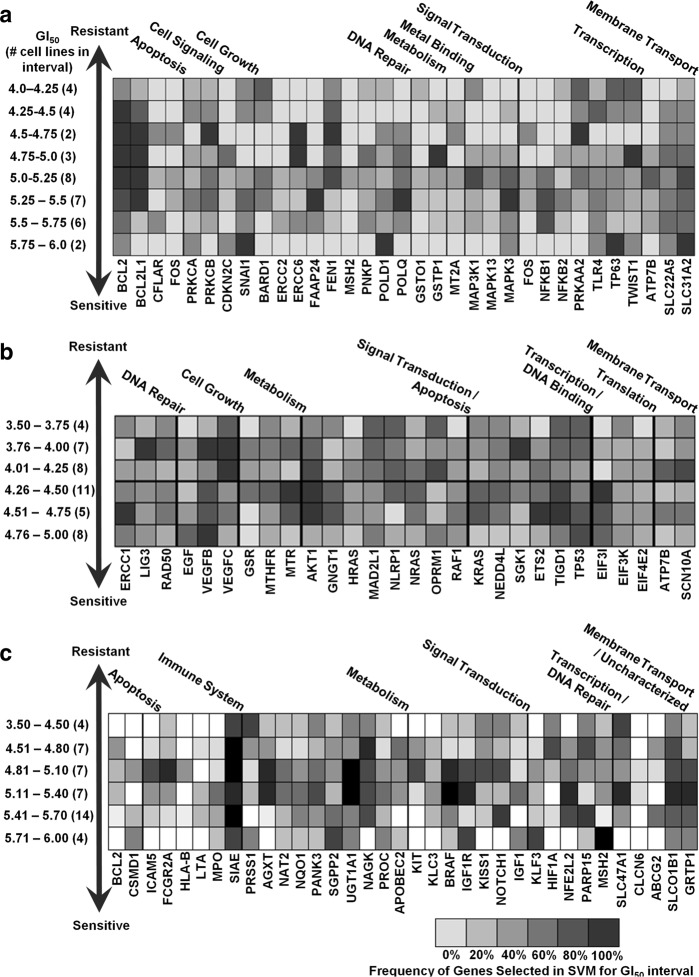
The selection of effective genes that accurately predict chemotherapy responses might improve cancer outcomes. We compare optimized gene signatures for cisplatin, carboplatin, and oxaliplatin responses in the same cell lines and validate each signature using data from patients with cancer. Supervised support vector machine learning is used to derive gene sets whose expression is related to the cell line GI 50 values by backwards feature selection with cross-validation. Specific genes and functional pathways distinguishing sensitive from resistant cell lines are identified by contrasting signatures obtained at extreme and median GI 50 thresholds. Ensembles of gene signatures at different thresholds are combined to reduce the dependence on specific GI 50 values for predicting drug responses. The most accurate gene signatures for each platin are: cisplatin: BARD1 , BCL2 , BCL2L1 , CDKN2C , FAAP24 , FEN1 , MAP3K1 , MAPK13 , MAPK3 , NFKB1 , NFKB2 , SLC22A5 , SLC31A2 , TLR4 , and TWIST1 ; carboplatin: AKT1 , EIF3K , ERCC1 , GNGT1 , GSR , MTHFR , NEDD4L , NLRP1 , NRAS , RAF1 , SGK1 , TIGD1 , TP53 , VEGFB , and VEGFC; and oxaliplatin: BRAF , FCGR2A , IGF1 , MSH2 , NAGK , NFE2L2 , NQO1 , PANK3 , SLC47A1 , SLCO1B1 , and UGT1A1 . Data from The Cancer Genome Atlas (TCGA) patients with bladder, ovarian, and colorectal cancer were used to test the cisplatin, carboplatin, and oxaliplatin signatures, resulting in 71.0%, 60.2%, and 54.5% accuracies in predicting disease recurrence and 59%, 61%, and 72% accuracies in predicting remission, respectively. One cisplatin signature predicted 100% of recurrence in non-smoking patients with bladder cancer (57% disease-free; N = 19), and 79% recurrence in smokers (62% disease-free; N = 35). This approach should be adaptable to other studies of chemotherapy responses, regardless of the drug or cancer types.
Overview
The claims and statistics of this paper haven’t been checked yet.
Run the check — free, no account needed. It reads the open-access text and checks the sources it cites.
Integrity signals
Registry
Cites
Statistics
Figures
Verification
Claims the paper makes
The claims and statistics of this paper haven’t been checked yet.
Run the check — free, no account needed. It reads the open-access text and checks the sources it cites.
Claims other papers make about this one
Each is checked against this paper’s own text: does it say what the citing paper says it does?
The source backs part of the claim, not all of it — or backs it for a different population, condition or comparison.
In the citing paper
“Given its widespread use, it comes as no surprise that prior work has assessed the utility of mutational and transcriptomic signatures in predicting response to this drug; yet, to the best knowledge of these authors, none of these advancements have been translated into routine clinical care15–19.”
From Exploiting convergent phenotypes to derive a pan-cancer cisplatin response gene expression signature (2023) · cites this paper as [16]
Experimental — accuracy not yet measuredThe source backs part of the claim, not all of it — or backs it for a different population, condition or comparison.
In the citing paper
“In a 2019 manuscript by Mucaki et al., the authors produce a cisplatin response signature from breast cancer cell lines in the GDSC dataset; however, their approach only includes genes with a known relationship to cisplatin response (none of which overlap with the genes in CisSig)16. Therefore, their final cisplatin response signature does not contain any CisSig genes.”
From Exploiting convergent phenotypes to derive a pan-cancer cisplatin response gene expression signature (2023) · cites this paper as [16]
Experimental — accuracy not yet measured
Self-check
Percentages, sums and reported differences re-computed from the paper’s own numbers.
The self-check needs the paper’s full text.
Citations
Cites
Cerami, E., Gao, J., Dogrusoz, U., Gross, B. E., Sumer, S. O., Aksoy, B. A., Jacobsen, A., Byrne, C. J., Heuer, M. L., Larsson, E., et al. (2012) · Cancer Discovery · doi:10.1158/2159-8290.cd-12-0095 · Cited by 17,455
Integrative Analysis of Complex Cancer Genomics and Clinical Profiles Using the cBioPortal
Gao, J., Aksoy, B. A., Dogrusoz, U., Dresdner, G., Gross, B., Sumer, S. O., Sun, Y., Jacobsen, A., Sinha, R., Larsson, E., et al. (2013) · Science Signaling · doi:10.1126/scisignal.2004088 · Cited by 15,160
Abdi, H., & Williams, L. J. (2010) · WIREs Computational Statistics · doi:10.1002/wics.101 · Cited by 11,104
Adjusting batch effects in microarray expression data using empirical Bayes methods
Johnson, W. E., Li, C., & Rabinovic, A. (2007) · Biostatistics · doi:10.1093/biostatistics/kxj037 · Cited by 8,658
Comprehensive molecular characterization of human colon and rectal cancer
The Cancer Genome Atlas Network (2012) · Nature · doi:10.1038/nature11252 · Cited by 8,499
Integrated genomic analyses of ovarian carcinoma
Perou, C. M. (2019) · Carolina Digital Repository (University of North Carolina at Chapel Hill) · doi:10.17615/hvp3-wg08 · Cited by 7,927
Yang, W., Soares, J., Greninger, P., Edelman, E. J., Lightfoot, H., Forbes, S., Bindal, N., Beare, D., Smith, J. A., Thompson, I. R., et al. (2012) · Nucleic Acids Research · doi:10.1093/nar/gks1111 · Cited by 4,051
Chen, L., Li, N., & Ye, H. (2012) · Hepatogastroenterology · doi:10.5754/hge12469 · Cited by 3,208
RNA-seq: An assessment of technical reproducibility and comparison with gene expression arrays
Marioni, J. C., Mason, C. E., Mane, S. M., Stephens, M., & Gilad, Y. (2008) · Genome Research · doi:10.1101/gr.079558.108 · Cited by 2,771
Comprehensive Molecular Characterization of Muscle-Invasive Bladder Cancer
Robertson, A. G., Kim, J., Al‐Ahmadie, H. A., Joaquim Bellmunt, B., Guo, G., Cherniack, A. D., Hinoue, T., Laird, P. W., Hoadley, K. A., Akbani, R., et al. (2017) · Cell · doi:10.1016/j.cell.2017.09.007 · Cited by 2,463
Combining forecasts: A review and annotated bibliography
Clemen, R. T. (1989) · International Journal of Forecasting · doi:10.1016/0169-2070(89)90012-5 · Cited by 2,172
DrugBank 4.0: shedding new light on drug metabolism
Law, V., Knox, C., Djoumbou-Feunang, Y., Jewison, T., Guo, A. C., Liu, Y., Maciejewski, A., Arndt, D., Wilson, M., Neveu, V., et al. (2013) · Nucleic Acids Research · doi:10.1093/nar/gkt1068 · Cited by 1,995
Pharmacogenomics Knowledge for Personalized Medicine
Whirl‐Carrillo, M., McDonagh, E. M., Hebert, J. M., Gong, L., Sangkuhl, K., Thorn, C. F., Altman, R. B., & Klein, T. E. (2012) · Clinical Pharmacology & Therapeutics · doi:10.1038/clpt.2012.96 · Cited by 1,791
Combining forecasts: A review and annotated bibliography
(1990) · Long Range Planning · doi:10.1016/0024-6301(90)90316-v · Cited by 1,508
Association Between Smoking and Risk of Bladder Cancer Among Men and Women
Freedman, N. D. (2011) · JAMA · doi:10.1001/jama.2011.1142 · Cited by 1,144
Ogston, K. N., Miller, I. D., Payne, S., Hutcheon, A. W., Sarkar, T. K., Smith, I., Schofield, A. C., & Heys, S. D. (2003) · The Breast · doi:10.1016/s0960-9776(03)00106-1 · Cited by 984
Epigenetic Signatures of Cigarette Smoking
Joehanes, R., Just, A. C., Marioni, R. E., Pilling, L. C., Reynolds, L. M., Mandaviya, P. R., Guan, W., Xu, T., Elks, C. E., Aslibekyan, S. W., et al. (2016) · Circulation Cardiovascular Genetics · doi:10.1161/circgenetics.116.001506 · Cited by 934
Hatzis, C. (2011) · JAMA · doi:10.1001/jama.2011.593 · Cited by 699
Resistance to cancer chemotherapy: failure in drug response from ADME to P-gp
Alfarouk, K. O., Stock, C.-M., Taylor, S., Walsh, M., Muddathir, A. K., Verduzco, D., Bashir, A. H. H., Mohammed, O. Y., Elhassan, G. O., Harguindey, S., et al. (2015) · Cancer Cell International · doi:10.1186/s12935-015-0221-1 · Cited by 687
Rixe, O., Ortuzar, W. I., Alvarez, M. G., Parker, R., Reed, E., Paull, K. D., & Fojo, T. (1996) · Biochemical Pharmacology · doi:10.1016/s0006-2952(97)81490-6 · Cited by 615
Cardoso, F., Fallowfield, L. J., Costa, A., Castiglione, M., & Senkus, E. (2011) · Annals of Oncology · doi:10.1093/annonc/mdr372 · Cited by 597
Cardoso, F., Harbeck, N., Fallowfield, L., Kyriakides, S., & Senkus, E. (2012) · Annals of Oncology · doi:10.1093/annonc/mds232 · Cited by 485
Cellular and molecular pharmacology of oxaliplatin.
Raymond, É., Faivre, S. J., Chaney, S. G., WOYNAROWSKI, J. M., & Cvitkovic, E. (2002) · PubMed · Cited by 463
Sataloff, D. M., Mason, B. A., Prestipino, A. J., Seinige, U. L., Lieber, C. P., & Baloch, Z. W. (1995) · PubMed · Cited by 429
Organic cation transporters are determinants of oxaliplatin cytotoxicity.
Zhang, S., Lovejoy, K. S., Shima, J. E., Lagpacan, L. L., Shu, Y., Lapuk, A., Chen, Y., Komori, T., Gray, J., Chen, X., et al. (2006) · Cancer Research · doi:10.1158/0008-5472.can-06-0769 · Cited by 426
Application of high-dimensional feature selection: evaluation for genomic prediction in man
Bermingham, M. L., Pong‐Wong, R., Spiliopoulou, A., Hayward, C., Rudan, I., Campbell, H., Wright, A. F., Wilson, J. F., Agakov, F. V., Navarro, P., et al. (2015) · Scientific Reports · doi:10.1038/srep10312 · Cited by 334
Oxaliplatin-Induced Damage of Cellular DNA
WOYNAROWSKI, J. M., Faivre, S. J., Herzig, M. C. S., Arnett, B., Chapman, W. G., Trevino, A. V., Raymond, É., Chaney, S. G., Vaisman, A., Varchenko, M., et al. (2000) · Molecular Pharmacology · doi:10.1124/mol.58.5.920 · Cited by 310
Modeling precision treatment of breast cancer
Daemen, A., Griffith, O. L., Heiser, L. M., Wang, N. J., Enache, O. M., Sanborn, Z., Pepin, F., Durinck, S., Korkola, J. E., Griffith, M., et al. (2013) · Genome biology · doi:10.1186/gb-2013-14-10-r110 · Cited by 291
Predicting drug susceptibility of non–small cell lung cancers based on genetic lesions
Sos, M. L., Michel, K., Zander, T., Weiss, J. M., Frommolt, P., Peifer, M., Li, D., Ullrich, R. T., Koker, M., Fischer, F., et al. (2009) · Journal of Clinical Investigation · doi:10.1172/jci37127 · Cited by 258
Als, A. B., Dyrskjøt, L., von der Maase, H., Koed, K., Mansilla, F., Toldbod, H., Jensen, J. L., Ulhøi, B. P., Sengeløv, L., Jensen, K. M., et al. (2007) · Clinical Cancer Research · doi:10.1158/1078-0432.ccr-07-0109 · Cited by 203
How do real tumors become resistant to cisplatin?
Borst, P., Rottenberg, S., & Jonkers, J. (2008) · Cell Cycle · doi:10.4161/cc.7.10.5930 · Cited by 192
Pharmacology of oxaliplatin and the use of pharmacogenomics to individualize therapy
Kweekel, D. M., Gelderblom, H. A. J., & Guchelaar, H. (2005) · Cancer Treatment Reviews · doi:10.1016/j.ctrv.2004.12.006 · Cited by 180
Tashiro, T., Kawada, Y., Sakurai, Y., & Kidani, Y. (1989) · Biomedicine & Pharmacotherapy · doi:10.1016/0753-3322(89)90004-8 · Cited by 171
Integrated genomic analyses of ovarian carcinoma
The Cancer Genome Atlas Research Network (2011) · Nature · doi:10.1038/nature10166 · Cited by 129
The UBC-40 Urothelial Bladder Cancer cell line index: a genomic resource for functional studies
Earl, J., Rico, D., Pau, E. C. D. S., Rodríguez‐Santiago, B., Méndez‐Pertuz, M., Auer, H., Goméz-López, G., Grossman, H. B., Pisano, D. G., Schulz, W. A., et al. (2015) · BMC Genomics · doi:10.1186/s12864-015-1450-3 · Cited by 124
Dorman, S., Baranova, K., Knoll, J. H. M., Urquhart, B. L., Mariani, G., Carcangiu, M. L., & Rogan, P. K. (2015) · Molecular Oncology · doi:10.1016/j.molonc.2015.07.006 · Cited by 121
Self-citationMolecular mechanisms of platinum resistance: still searching for the Achilles? heel
Wernyj, R. P., & Morin, P. J. (2004) · Drug Resistance Updates · doi:10.1016/j.drup.2004.08.002 · Cited by 114
L'Espérance, S., Bachvarova, M., Tetu, B., Mes-Masson, A.-M., & Bachvarov, D. (2008) · BMC Genomics · doi:10.1186/1471-2164-9-99 · Cited by 108
Molecular analysis of urothelial cancer cell lines for modeling tumor biology and drug response
Nickerson, M., Witte, N., Im, K. M., Turan, S., Owens, C. R., Misner, K., Tsang, S. X., Cai, Z., Wu, S., Dean, M. C., et al. (2016) · Oncogene · doi:10.1038/onc.2016.172 · Cited by 106
Fortin, A., Wang, C. S., & Vigneault, É. (2008) · International Journal of Radiation Oncology*Biology*Physics · doi:10.1016/j.ijrobp.2008.09.021 · Cited by 104
Potential responders to FOLFOX therapy for colorectal cancer by Random Forests analysis
Tsuji, S., Midorikawa, Y., Takahashi, T., Yagi, K., Takayama, T., Yoshida, K., Sugiyama, Y., & Aburatani, H. (2011) · British Journal of Cancer · doi:10.1038/bjc.2011.505 · Cited by 102
Review of cisplatin and oxaliplatin in current immunogenic and monoclonal antibody treatments
Mehmood, R. K. (2014) · Oncology Reviews · doi:10.4081/oncol.2014.256 · Cited by 99
Kašpárková, J., Vojtı́šková, M., Natile, G., & Brabec, V. (2007) · Chemistry - A European Journal · doi:10.1002/chem.200701352 · Cited by 84
A metabolomic approach to identifying platinum resistance in ovarian cancer
Poisson, L., Munkarah, A. R., Madi, H., Datta, I., Hensley-Alford, S., Tebbe, C., Buekers, T., Giri, S., & Rattan, R. (2015) · Journal of Ovarian Research · doi:10.1186/s13048-015-0140-8 · Cited by 82
Oostendorp, L. J. M., Stalmeier, P. F. M., Donders, A. R. T., van der Graaf, W. T. A., & Ottevanger, P. B. (2011) · The Lancet Oncology · doi:10.1016/s1470-2045(11)70045-6 · Cited by 69
Alex, A. K., Siqueira, S., Coudry, R. A., Santos, J., Alves, M. F. S., Hoff, P. M., & Riechelmann, R. P. (2016) · Clinical Colorectal Cancer · doi:10.1016/j.clcc.2016.11.001 · Cited by 62
Mucaki, E. J., Baranova, K., Pham, H. Q., Rezaeian, I., Angelov, D., Ngom, A., Rueda, L. G., & Rogan, P. K. (2017) · F1000Research · doi:10.12688/f1000research.9417.3 · Cited by 46
Self-citationIncrease in acetyl CoA synthetase activity after phenobarbital treatment
Akamatsu, N., Nakajima, H., Ohno, M., & Miura, Y. (1975) · Biochemical Pharmacology · doi:10.1016/0006-2952(75)90013-1 · Cited by 28
Predicting ionizing radiation exposure using biochemically-inspired genomic machine learning
Zhao, J. Z. L., Mucaki, E. J., & Rogan, P. K. (2018) · F1000Research · doi:10.12688/f1000research.14048.1 · Cited by 19
Self-citationGąsowska-Bodnar, A., Bodnar, L., Dabek, A., Cichowicz, M., Jerzak, M. M., Cierniak, S., Kozłowski, W., & Baranowski, W. (2014) · International Journal of Gynecological Cancer · doi:10.1097/igc.0000000000000108 · Cited by 17
Gene expression profiling for targeted cancer treatment
Yuryev, A. (2014) · Expert Opinion on Drug Discovery · doi:10.1517/17460441.2015.971007 · Cited by 16
Cadoná, F. C., Machado, A. K., Azzolin, V. F., Barbisan, F., Dornelles, E. B., Glanzner, W. G., Pb, G., Assmann, C. E., Ribeiro, E. E., & Ib, D. C. (2016) · PubMed · doi:10.2174/1871520616666151217121138 · Cited by 13
RNA-seq identifies determinants of oxaliplatin sensitivity in colorectal cancer cell lines.
Li, X.-X., Peng, J.-J., Liang, L., Huang, L.-Y., Li, D.-W., Shi, D.-B., Zheng, H.-T., & Cai, S.-J. (2014) · PubMed Central · Cited by 12
Tembe, V., Martino‐Echarri, E., Marzec, K. A., Mok, M. T. S., Brodie, K. M., Mills, K. M., Lei, Y., DeFazio, A., Rizos, H., Kettle, E., et al. (2015) · Cellular Signalling · doi:10.1016/j.cellsig.2015.05.011 · Cited by 10
Yuan, Y., Tan, C., Shen, H., Yu, J., Fang, X., Jiang, W., & Zheng, S. S. (2012) · Hepatogastroenterology · doi:10.5754/hge12127 · Cited by 9
A Network-Based Model of Oncogenic Collaboration for Prediction of Drug Sensitivity
Laderas, T., Heiser, L. M., & Sönmez, K. (2015) · Frontiers in Genetics · doi:10.3389/fgene.2015.00341 · Cited by 5
Rezaeian, I., Mucaki, E. J., Baranova, K., Pham, H. Q., Angelov, D., Ngom, A., Rueda, L. G., & Rogan, P. K. (2017) · F1000Research · doi:10.12688/f1000research.9417.2 · Cited by 5
Self-citationAlex, A., Siqueira, S., Coudry, R. A., Santos, J., Alves, M., Hoff, P. M., & Riechelmann, R. P. (2016) · Annals of Oncology · doi:10.1093/annonc/mdw200.02 · Cited by 1
Research works printed but not linked: 1
- Airley, R. Cancer Chemotherapy (Wiley-Blackwell, Hoboken, New Jersey 2009).
Cited by
Sorted by citations
Trends in kinase drug discovery: targets, indications and inhibitor design
Attwood, M. M., Fabbro, D., Sokolov, A. V., Knapp, S., & Schiöth, H. B. (2021) · Nature Reviews Drug Discovery · doi:10.1038/s41573-021-00252-y · Cited by 850
Advances in healthcare wearable devices
Iqbal, S. M. A., Mahgoub, I., Du, E., Leavitt, M. A., & Asghar, W. (2021) · npj Flexible Electronics · doi:10.1038/s41528-021-00107-x · Cited by 714
Understanding ligand-protected noble metal nanoclusters at work
Matus, M. F., & Häkkinen, H. (2023) · Nature Reviews Materials · doi:10.1038/s41578-023-00537-1 · Cited by 375
Sharifi-Rad, J., Quispe, C., Butnariu, M., Rotariu, L. S., Sytar, O., Sestito, S., Rapposelli, S., Akram, M., Iqbal, M., Krishna, A., et al. (2021) · Cancer Cell International · doi:10.1186/s12935-021-02025-4 · Cited by 290
Early lung cancer diagnostic biomarker discovery by machine learning methods
Xie, Y., Meng, W.-Y., Li, R., Wang, Y., Qian, X., Chang, C., Yu, Z.-F., Fan, X., Pan, H., Xie, C., et al. (2020) · Translational Oncology · doi:10.1016/j.tranon.2020.100907 · Cited by 271
Metadata
- Authors
- Mucaki, E. J., Zhao, J. Z. L., Lizotte, D. J., & Rogan, P. K.
- Affiliations
- Western University (CA)
- Corresponding author
- Rogan, Peter K.
- Venue
- Signal Transduction and Targeted Therapy
- Published
- 2019-01-11
- Volume
- 4
- Issue
- 1
- Pages
- 1-1
- ISSN
- 2059-3635 (ISSN-L)
- PMC
- PMC6329797
- OpenAlex
- W2950457484
- Cited by
- 200
- References
- 57
- Citations by year
- 2026: 8 · 2025: 15 · 2024: 21 · 2023: 44 · 2022: 32 · 2021: 38 · 2020: 31 · 2019: 9
- FWCI
- 9.10
- Type
- journal article
- Language
- en
- Open access
- gold
- doi.org
- Locations
- Signal Transduction and Targeted Therapy (publishedVersion, cc-by)
- bioRxiv (Cold Spring Harbor Laboratory) (acceptedVersion, cc-by-nc-nd)
- Europe PMC (PubMed Central) (publishedVersion, other-oa)
- PubMed Central (publishedVersion, cc-by)
- PubMed (publishedVersion)
- Scholarship@Western (Western University) (acceptedVersion)
- DOAJ (DOAJ: Directory of Open Access Journals) (submittedVersion)
- Scholarship@Western (Western University) (submittedVersion)
- Funders
- Compute Canada
- Canada Research Chairs
- Natural Sciences and Engineering Research Council of Canada (RGPIN-2015, RGPIN-2015-06290)
- Topics
- Life Sciences › Biochemistry, Genetics and Molecular Biology › Molecular Biology › Gene expression and cancer classification
- Life Sciences › Pharmacology, Toxicology and Pharmaceutics › Drug Discovery › Computational Drug Discovery Methods
- Life Sciences › Biochemistry, Genetics and Molecular Biology › Cancer Research › Breast Cancer Treatment Studies
- Keywords
- cisplatin, carboplatin, oxaliplatin, drug response prediction, gene expression signatures, drug resistance, support vector machine, feature selection, bladder cancer, ovarian cancer, colorectal cancer, disease recurrence prediction, remission prediction
About these checks
Registry, retraction, Cites and statistics results are computed, not judged, with one exception: a printed reference that no index lists is read once by a model before it counts as a citation error. Claims are extracted by a model and kept only when their quote appears verbatim in the text; each cited source is then checked, with a model’s help, for whether it says what the claim relies on. Those verdicts can be wrong — read the claim’s quote and the cited source before relying on one.
Statistics and arithmetic are recomputed, not judged.
Confidence bands are shown only for fields calibrated on our annotated test set. None is calibrated yet, so no band is shown.
What counts as a claim ›How we measure confidence ›How we check this ›
Are you an author, or do you see a problem with this page? Request a review
