

The DOI matches its Crossref record; 50 of the 50 references it cites were found in a registry or an index.
Fe65-engineered neuronal exosomes encapsulating corynoxine-B ameliorate cognition and pathology of Alzheimer’s disease
Open accessAbstract
Alzheimer’s disease (AD) is a neurodegenerative disorder characterized by the predominant impairment of neurons in the hippocampus and the formation of amyloid plaques, hyperphosphorylated tau protein, and neurofibrillary tangles in the brain. The overexpression of amyloid-β precursor protein (APP) in an AD brain results in the binding of APP intracellular domain (AICD) to Fe65 protein via the C-terminal Fe65-PTB2 interaction, which then triggers the secretion of amyloid-β and the consequent pathogenesis of AD. Apparently, targeting the interaction between APP and Fe65 can offer a promising therapeutic approach for AD. Recently, exosome, a type of extracellular vesicle with diameter around 30–200 nm, has gained much attention as a potential delivery tool for brain diseases, including AD, due to their ability to cross the blood–brain barrier, their efficient uptake by autologous cells, and their ability to be surface-modified with target-specific receptor ligands. Here, the engineering of hippocampus neuron cell-derived exosomes to overexpress Fe65, enabled the development of a novel exosome-based targeted drug delivery system, which carried Corynoxine-B (Cory-B, an autophagy inducer) to the APP overexpressed-neuron cells in the brain of AD mice. The Fe65-engineered HT22 hippocampus neuron cell-derived exosomes (Fe65-EXO) loaded with Cory-B (Fe65-EXO-Cory-B) hijacked the signaling and blocked the natural interaction between Fe65 and APP, enabling APP-targeted delivery of Cory-B. Notably, Fe65-EXO-Cory-B induced autophagy in APP-expressing neuronal cells, leading to amelioration of the cognitive decline and pathogenesis in AD mice, demonstrating the potential of Fe65-EXO-Cory-B as an effective therapeutic intervention for AD.
Overview
The claims and statistics of this paper haven’t been checked yet.
Run the check — free, no account needed. It reads the open-access text and checks the sources it cites.
Integrity signals
Registry
Cites
Statistics
Figures
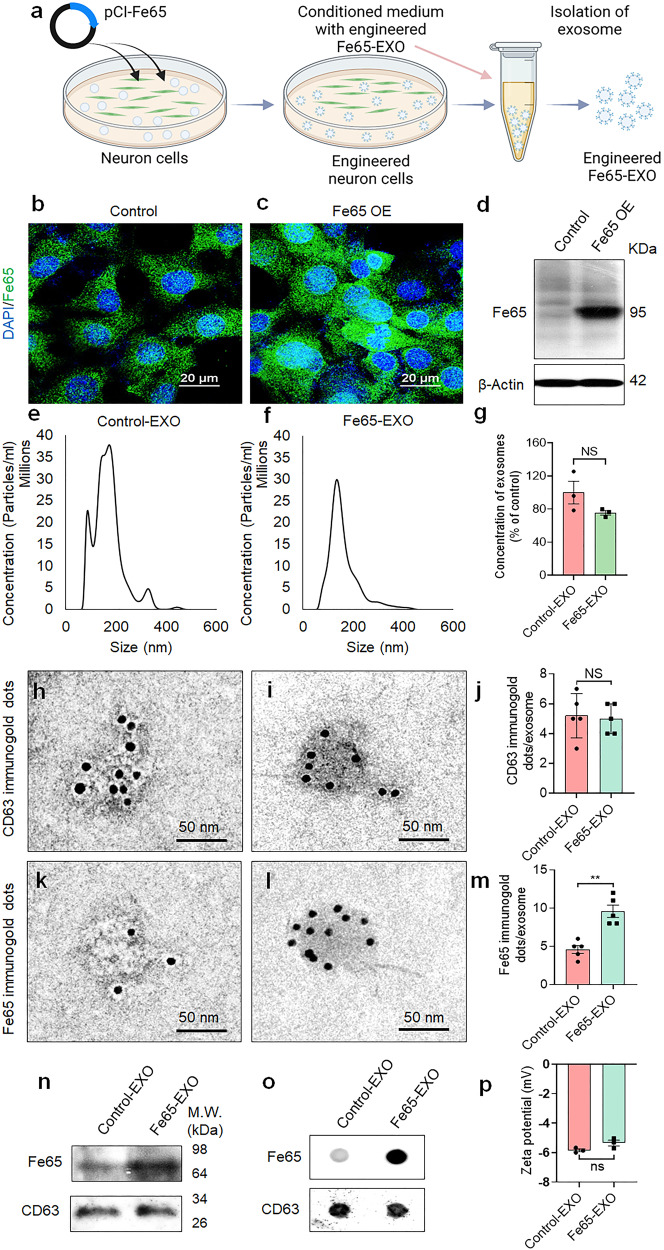
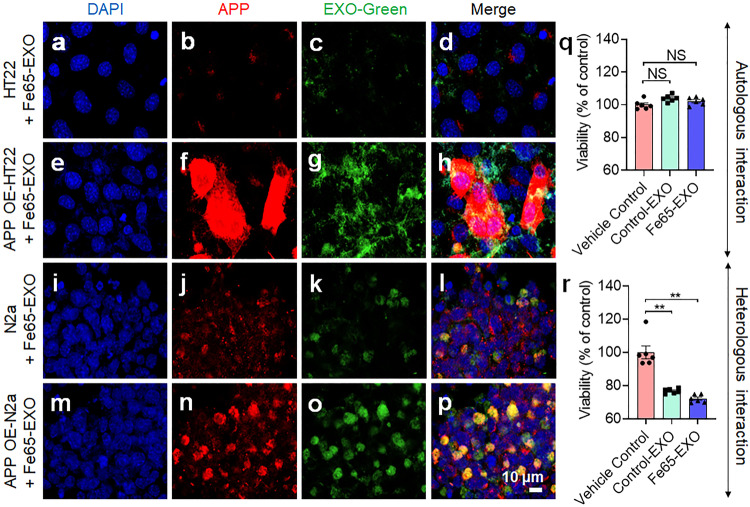
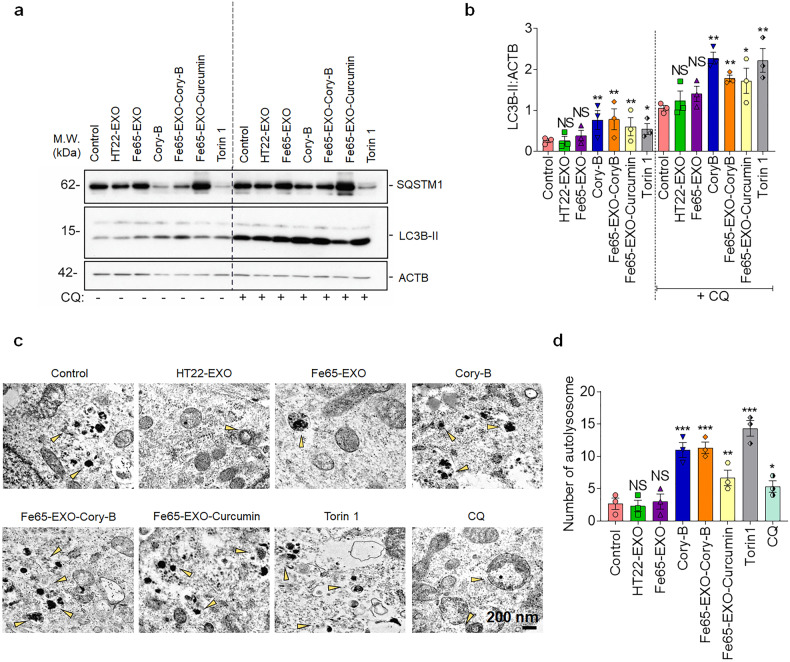
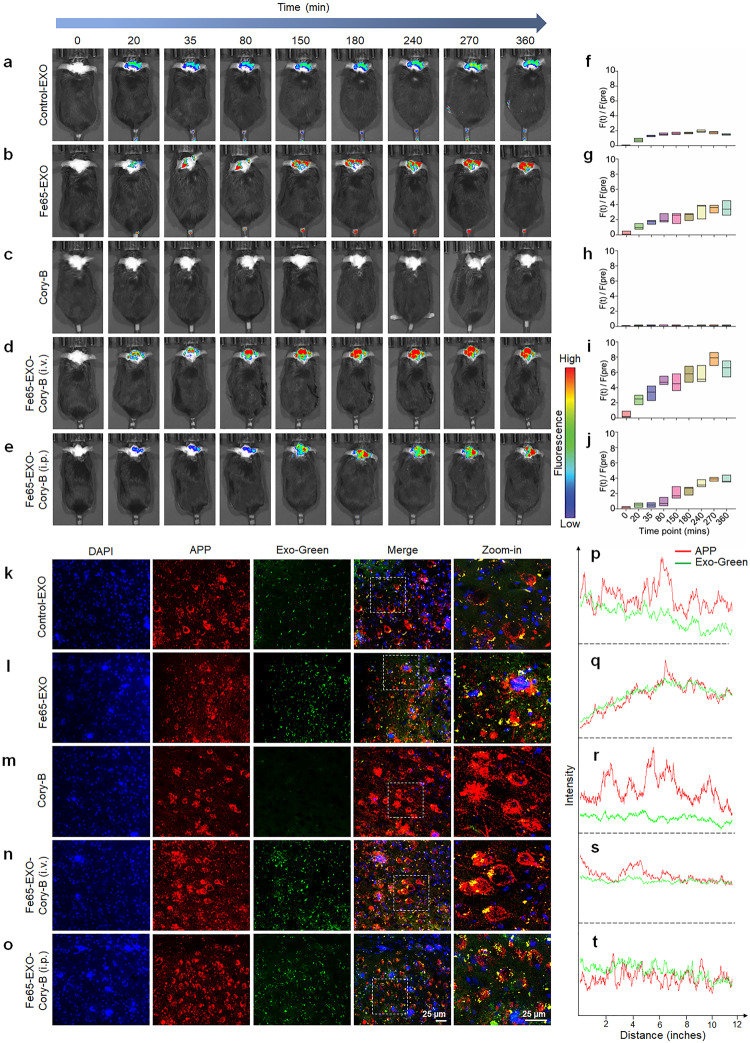
Verification
Claims the paper makes
The claims and statistics of this paper haven’t been checked yet.
Run the check — free, no account needed. It reads the open-access text and checks the sources it cites.
Claims other papers make about this one
Each is checked against this paper’s own text: does it say what the citing paper says it does?
The cited source says what the claim attributes to it.
In the citing paper
“Similarly, Iyaswamy et al. established a novel, exosome-based targeted drug delivery system for AD [243].”
From Extracellular vesicles as nanotheranostic platforms for targeted neurological disorder interventions (2024) · cites this paper as [243]
In the citing paper
“These engineered exosomes have demonstrated strong potential as drug carriers, providing targeted delivery, reduced toxicity, and improved therapeutic effectiveness in preclinical models.”
From Emerging role of exosomes in cancer therapy: progress and challenges (2025) · cites this paper as [24]
Self-check
Percentages, sums and reported differences re-computed from the paper’s own numbers.
The self-check needs the paper’s full text.
Citations
Cites
Delivery of siRNA to the mouse brain by systemic injection of targeted exosomes
Alvarez-Erviti, L., Seow, Y., Yin, H., Betts, C., Lakhal, S., & Wood, M. J. A. (2011) · Nature Biotechnology · doi:10.1038/nbt.1807 · Cited by 4,930
Jack, C. R., Knopman, D. S., Jagust, W. J., Petersen, R. C., Weiner, M. W., Aisen, P. S., Shaw, L. M., Vemuri, P., Wiste, H. J., Weigand, S. D., et al. (2013) · The Lancet Neurology · doi:10.1016/s1474-4422(12)70291-0 · Cited by 4,396
Blood–brain barrier breakdown in Alzheimer disease and other neurodegenerative disorders
Sweeney, M. D., Sagare, A. P., & Zlokovic, B. V. (2018) · Nature Reviews Neurology · doi:10.1038/nrneurol.2017.188 · Cited by 3,076
Pathways towards and Away from Alzheimer’s Disease
Mattson, M. P. (2004) · Nature · doi:10.1038/nature02621 · Cited by 3,052
Guidelines for the use and interpretation of assays for monitoring autophagy (4th edition) 1
Klionsky, D. J., Abdel-Aziz, A. K., Abdelfatah, S., Abdellatif, M., Abdoli, A., Abel, S., Abeliovich, H., Abildgaard, M. H., Abudu, Y. P., Acevedo-Arozena, A., et al. (2021) · Autophagy · doi:10.1080/15548627.2020.1797280 · Cited by 2,897
Self-citationThe exosome journey: from biogenesis to uptake and intracellular signalling
Gurung, S., Perocheau, D. P. B., Touramanidou, L., & Baruteau, J. (2021) · Cell Communication and Signaling · doi:10.1186/s12964-021-00730-1 · Cited by 1,912
Applying extracellular vesicles based therapeutics in clinical trials – an ISEV position paper
Lener, T., Gimona, M., Aigner, L., Börger, V., Buzas, E., Camussi, G., Chaput, N., Chatterjee, D., Court, F. A., del Portillo, H. A., et al. (2015) · Journal of Extracellular Vesicles · doi:10.3402/jev.v4.30087 · Cited by 1,491
Adult hippocampal neurogenesis and its role in Alzheimer’s disease
Mu, Y., & Gage, F. H. (2011) · Molecular Neurodegeneration · doi:10.1186/1750-1326-6-85 · Cited by 1,021
Alzheimer's Disease: Molecular Understanding Predicts Amyloid-Based Therapeutics
Selkoe, D. J., & Schenk, D. (2003) · The Annual Review of Pharmacology and Toxicology · doi:10.1146/annurev.pharmtox.43.100901.140248 · Cited by 829
Beta-amyloid precursor protein cleavage by a membrane-bound protease.
Sisodia, S. S. (1992) · Proceedings of the National Academy of Sciences · doi:10.1073/pnas.89.13.6075 · Cited by 738
Cited by
Sorted by citations
Items 101–135 of 135
Cao, J., Song, J., Yin, Z., & Tang, Z. (2026) · British Journal of Pharmacology · doi:10.1111/bph.70289 · Cited by 1
Prussian Blue Nanozyme Disrupts the Self‐Reinforcing Loop of Tauopathy via Triple‐Action Mechanism
Wu, F., Huang, J., Wang, J., Wu, R., Zhang, H., Jin, C., Chen, C., Zhou, R., Cen, P., Tian, L., et al. (2026) · Advanced Healthcare Materials · doi:10.1002/adhm.202505286 · Cited by 1
Thakur, A., Zhang, K., Chen, J., Mei, S., Chen, J., Verdiell, A., Jacobs, E., Mulder, L., Whitford, A., Iyaswamy, A., et al. (2026) · Science Advances · doi:10.1126/sciadv.ady2696 · Cited by 1
Self-citationXu, L., Zhao, Y. T., Liang, Y., Benaindo, C. A., Sun, X., Wang, X.-Y., Gao, C., & Wu, J. (2026) · Journal of Nanobiotechnology · doi:10.1186/s12951-026-04467-2 · Cited by 1
Decoding the lung-brain axis in influenza: from pulmonary infection to central nervous system injury
Liang, X., Wang, X., Wang, Z., Chen, C., Li, L., & Lu, F. (2026) · Journal of Neuroinflammation · doi:10.1186/s12974-026-03958-1 · Cited by 1
Shi, S., Liu, R., Liu, C., Chen, Y., Pan, Y., & Wang, C. (2026) · Brain Research · doi:10.1016/j.brainres.2026.150487 · Cited by 1
Extracellular vesicles for next-gen therapeutics and drug delivery
Khan, N., Ahmadova, Z., Shi, Y., Shafiq, T., Liang, Y., & Duan, L. (2026) · Molecular Biomedicine · doi:10.1186/s43556-026-00571-9 · Cited by 1
Extracellular vesicles in targeted drug delivery: from biological functions to surface engineering
Duca, G., Tinnirello, V., Ganji, N. R., Alessandro, R., & Raimondo, S. (2026) · Molecular Biomedicine · doi:10.1186/s43556-026-00578-2 · Cited by 1
Zhang, L., An, H., Zhen, R.-R., Zhang, T., Ding, M.-R., Zhang, M., Sun, Y., & Gu, C. (2025) · Journal of Alzheimer s Disease · doi:10.1177/13872877241299832 · Cited by 1
Upcoming Nano and Conventional Drug Delivery Strategies for Alzheimer’s Disease
Varghese, N. M., Sathyamoorthy, N., Krishnamurthy, P. T., Varshini, M. S., & Chintamaneni, P. K. (2024) · Springer eBooks · doi:10.1007/978-981-96-0259-9_16
Clinical Applications of Exosomes
Huang, C. F. (2025) · Springer eBooks · doi:10.1007/978-981-96-1261-1_23
Research progress and prospects of medical applications of nanomaterials based on exosomes
Pan, Y., & Li, Z. (2025) · Chinese Science Bulletin (Chinese Version) · doi:10.1360/tb-2025-0069
Application of Exosomes in the Treatment of Central Nervous System Disorders: Current Perspectives
陈, 骏. (2025) · Hans Journal of Biomedicine · doi:10.12677/hjbm.2025.154092
Huang, Y., Guo, Y., Zhang, H., Deng, J., Huang, Z., Chen, A., Wu, X., Lin, D., Peng, Y., Chen, X., et al. (2025) · Journal of Cellular and Molecular Medicine · doi:10.1111/jcmm.70970
Wang, Y., Zhu, J., Li, Z., Yu, F., Fu, Y., Gao, H., Wang, M., Yuan, L., Zheng, L., & He, Q. (2026) · Cell Transplantation · doi:10.1177/09636897261418754
Extracellular Vesicles in Tauopathies: Mechanisms and Applications
Nannuri, V., Ababneh, E., Rayes, S. E., Smith, J., Sugaya, K., & Zhao, J. (2026) · International Journal of Molecular Sciences · doi:10.3390/ijms27041998
Zhao, T., Ma, D., Sun, J., Li, S., & Yang, H. (2026) · Chemical Engineering Journal · doi:10.1016/j.cej.2026.174543
Li, A., Peng, W., Wu, B., Li, C., & Yang, J. (2026) · Neuroscience · doi:10.1016/j.neuroscience.2026.03.019
Exosomes in inflammatory tissue injury: key pathogenic factors and promising therapeutic agents
Wang, Y., Ye, Y., Cai, D., Xu, Y., & Cao, Y. (2026) · Frontiers in Immunology · doi:10.3389/fimmu.2026.1830034 · Cited by 1
KOGA, N. A. C., Alves, S. M. B., & Mori, G. G. (2026) · International Immunopharmacology · doi:10.1016/j.intimp.2026.116983
The bench-to-bedside journey of circular RNAs in cancer: Status, challenges and future prospects
Lin, H., Tu, Y., Wang, P., Wang, T., & Long, F. (2026) · Biochimica et Biophysica Acta (BBA) - Reviews on Cancer · doi:10.1016/j.bbcan.2026.189639
Liu, N., Zhao, X., Sun, X., Liu, Y., Xu, J., Xu, D., & Sun, W. (2026) · Frontiers in Molecular Biosciences · doi:10.3389/fmolb.2026.1838554 · Cited by 2
Ding, Y., Huang, D., Zhao, Z., Han, F., Zhou, S., Qian, D., Zhang, Y., Zhao, Y., & Zhou, M. (2026) · Bioactive Materials · doi:10.1016/j.bioactmat.2026.06.024
Exosomes as emerging biomarkers and therapeutic platforms: From biology to clinical translation
Das, A., Chowdhury, S., Kar, K., Chakraborty, P., & Sarkar, S. (2026) · Biomaterials and Living Medicine for Pharmaceutics · doi:10.1016/j.bioliv.2026.100003
From Uptake to Therapeutic Function in Engineered Exosome Delivery Systems
Li, Y., Jin, L., Gao, P., Li, M., Zhao, Z., Jiang, J., An, M., & Li, F. (2026) · Research · doi:10.34133/research.1389
Self-citationWu, A., Zeng, Y., Huang, Y., Chen, L., Guo, S., Wang, J., Mou, X., & Chang, X. (2026) · Extracellular Vesicles and Circulating Nucleic Acids · doi:10.20517/evcna.2026.43
Amyloid Precursor Protein as a Functional Hub of Synaptic Plasticity
САБУРОВА, Е. А., Sarantseva, S. V., & Krivoi, I. I. (2026) · Journal of Evolutionary Biochemistry and Physiology · doi:10.1134/s0022093026040174
Chen, H., Si, Y., Cheng, Q., Qian, Y., Cui, Z., Yu, S., Zhao, X., Jin, Y. J., Wang, Y., Li, M., et al. (2026) · Bioactive Materials · doi:10.1016/j.bioactmat.2026.08.008
Self-citationWu, L., Huang, L., & Li, J. (2026) · Journal of International Medical Research · doi:10.1177/03000605261476145
Exosomes—nano-messengers in tumors: capturing techniques, birth codes, and functional deciphering
Li, Y., Gao, Y., Wang, Y.-H., Zhou, K.-F., Zhao, Y., & Zhao, L. (2026) · Frontiers in Cell and Developmental Biology · doi:10.3389/fcell.2026.1825151 · Cited by 1
Su, C.-F., Deng, Z., Ying, K. Y., Liu, J., Guan, X., Kan, Y., Xu, X., Iyaswamy, A., Lu, K., Lu, J., et al. (2026) · Phytomedicine · doi:10.1016/j.phymed.2026.158795
Self-citationTianci, M., Yongyi, L., Ding, Y., Liu, S., Gao, C., Li, X., Tong, Z., & Yan, L. (2026) · Frontiers in Aging · doi:10.3389/fragi.2026.1921485
Extracellular vesicles: Multi-source regulatory mechanisms in hippocampal homeostasis
Liu, Q., & Guo, L. (2026) · Neuroscience & Biobehavioral Reviews · doi:10.1016/j.neubiorev.2026.107015
Xu, B., Zhang, X., Niu, W., Yang, M., Zhang, C., Hu, S., & Niu, C. (2026) · Acta Pharmaceutica Sinica B · doi:10.1016/j.apsb.2026.10.007
Chodkowska-Michalowska, M., Hawryluk, O., Lakomy, S., Słysz, A., & Sarnowska, A. (2026) · International Journal of Molecular Sciences · doi:10.3390/ijms27219731
Metadata
- Authors
- Iyaswamy, A., Thakur, A., Guan, X.-J., Krishnamoorthi, S., Fung, T. Y., Lu, K., Gaurav, I., Yang, Z., Su, C.-F., Lau, K.-F., Zhang, K., Ng, R. C.-L., Lian, Q., Cheung, K.-H., Ye, K., Chen, H. J., & Li, M.
- Affiliations
- Hong Kong Baptist University (HK)
- University of Chicago (US)
- Chinese University of Hong Kong (HK)
- Manchester Academic Health Science Centre (GB)
- Guangzhou Women and Children Medical Center (CN)
- Chinese Academy of Sciences (CN)
- Corresponding author
- Iyaswamy, Ashok
- Thakur, Abhimanyu
- Chen, Huanhuan Joyce
- Li, Min
- ORCID
- Venue
- Signal Transduction and Targeted Therapy
- Published
- 2023-10-23
- Volume
- 8
- Issue
- 1
- Pages
- 404-404
- ISSN
- 2059-3635 (ISSN-L)
- PMC
- PMC10590775
- OpenAlex
- W4387857159
- Cited by
- 134
- References
- 50
- Citations by year
- 2026: 41 · 2025: 61 · 2024: 32
- FWCI
- 23.80
- Type
- journal article
- Language
- en
- Open access
- gold
- doi.org
- Locations
- Signal Transduction and Targeted Therapy (publishedVersion, cc-by)
- PubMed Central (publishedVersion, cc-by)
- PubMed (publishedVersion)
- Knowledge@UChicago (University of Chicago) (submittedVersion, cc-by-nc-nd)
- DOAJ (DOAJ: Directory of Open Access Journals) (submittedVersion, cc-by-sa)
- Research Explorer (The University of Manchester) (submittedVersion, cc-by)
- University of Chicago (cc-by)
- Funders
- Cancer Research Foundation
- Lung Cancer Research Foundation
- University of Chicago
- Hong Kong Baptist University (IRCMS/19–20/H02, RC-IRCS-17-18/03, HKBU/RC-IRCs/17-18/03, HKBU-MPCF-003-2022-23)
- Health and Medical Research Fund (HMRF/17182551, 17182541, HMRF17182541, 17182551, 09203776)
- National Cancer Institute (R00CA226353, K99CA226353)
- Topics
- Life Sciences › Neuroscience › Cellular and Molecular Neuroscience › Alzheimer's disease research and treatments
- Life Sciences › Biochemistry, Genetics and Molecular Biology › Molecular Biology › Extracellular vesicles in disease
- Physical Sciences › Materials Science › Biomaterials › Nanoparticle-Based Drug Delivery
- Keywords
- Alzheimer's disease, Fe65, amyloid precursor protein, exosome-based drug delivery, autophagy, hippocampal neurons, cognitive decline, amyloid plaques, tau hyperphosphorylation, extracellular vesicles
- MeSH terms
- Alzheimer Disease, Animals, Cognition, Indoles, Nerve Tissue Proteins, Neurons, Spiro Compounds, Amyloid beta-Protein Precursor, Mice, Exosomes
About these checks
Registry, retraction, Cites and statistics results are computed, not judged, with one exception: a printed reference that no index lists is read once by a model before it counts as a citation error. Claims are extracted by a model and kept only when their quote appears verbatim in the text; each cited source is then checked, with a model’s help, for whether it says what the claim relies on. Those verdicts can be wrong — read the claim’s quote and the cited source before relying on one.
Statistics and arithmetic are recomputed, not judged.
Confidence bands are shown only for fields calibrated on our annotated test set. None is calibrated yet, so no band is shown.
What counts as a claim ›How we measure confidence ›How we check this ›
Are you an author, or do you see a problem with this page? Request a review
