

The DOI matches its Crossref record; 65 of the 65 references it cites were found in a registry or an index.
Spatiotemporal transcriptomics elucidates the pathogenesis of fulminant viral myocarditis
Open accessAbstract
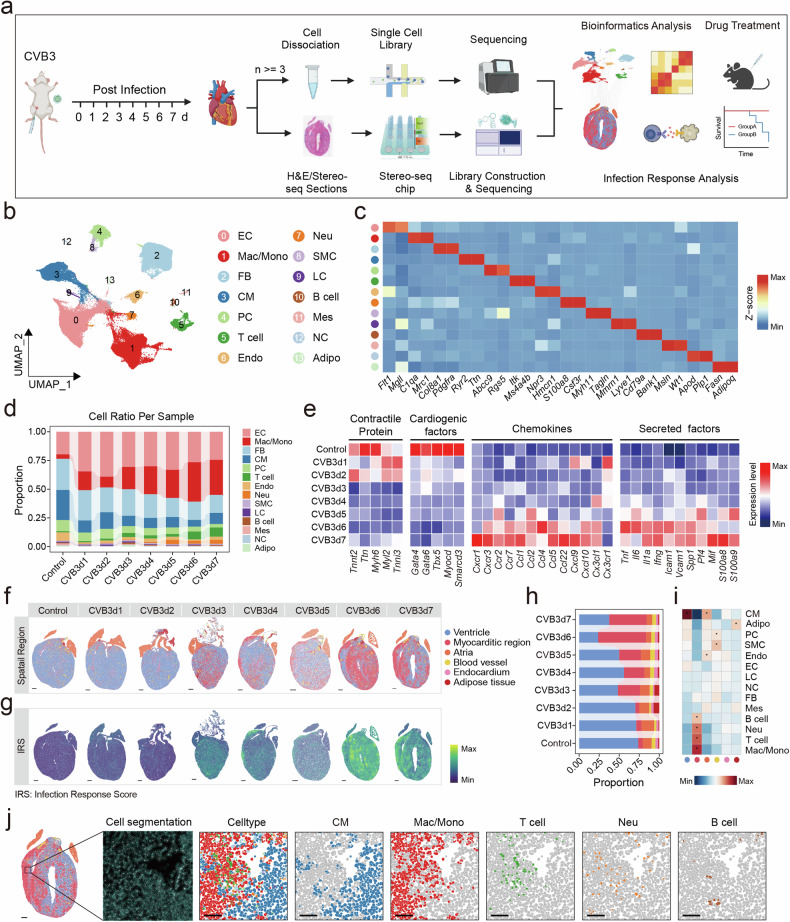
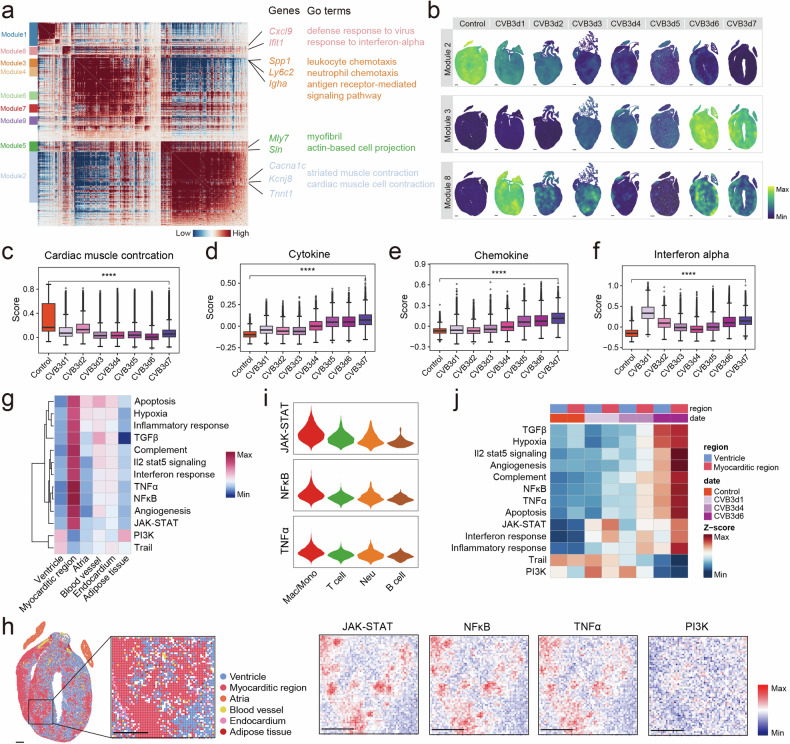
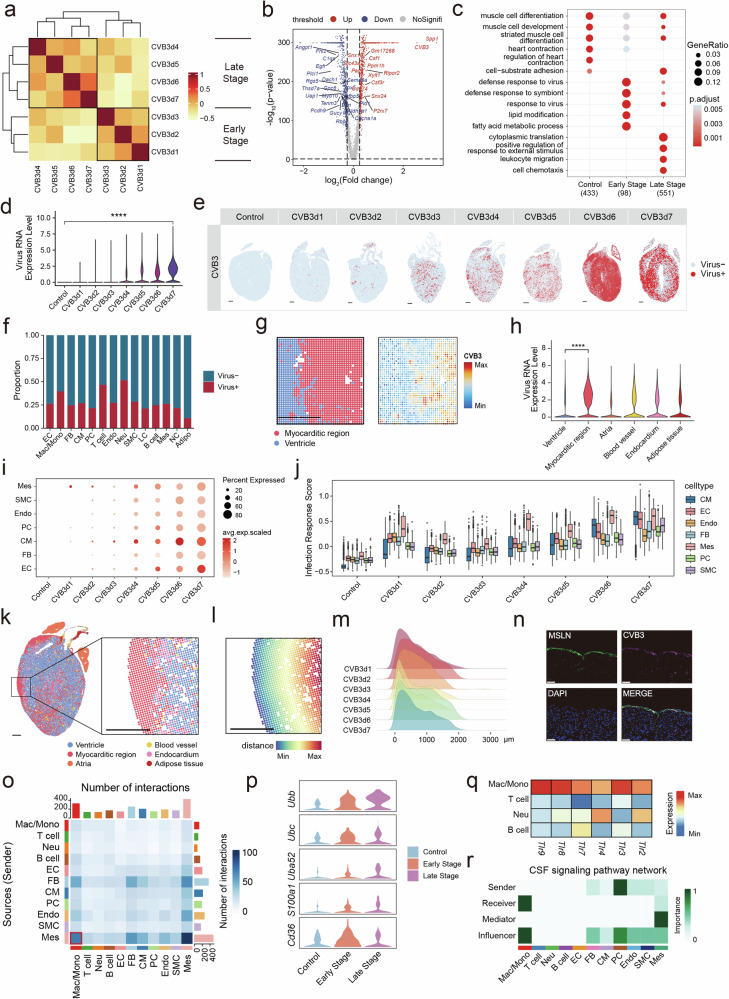
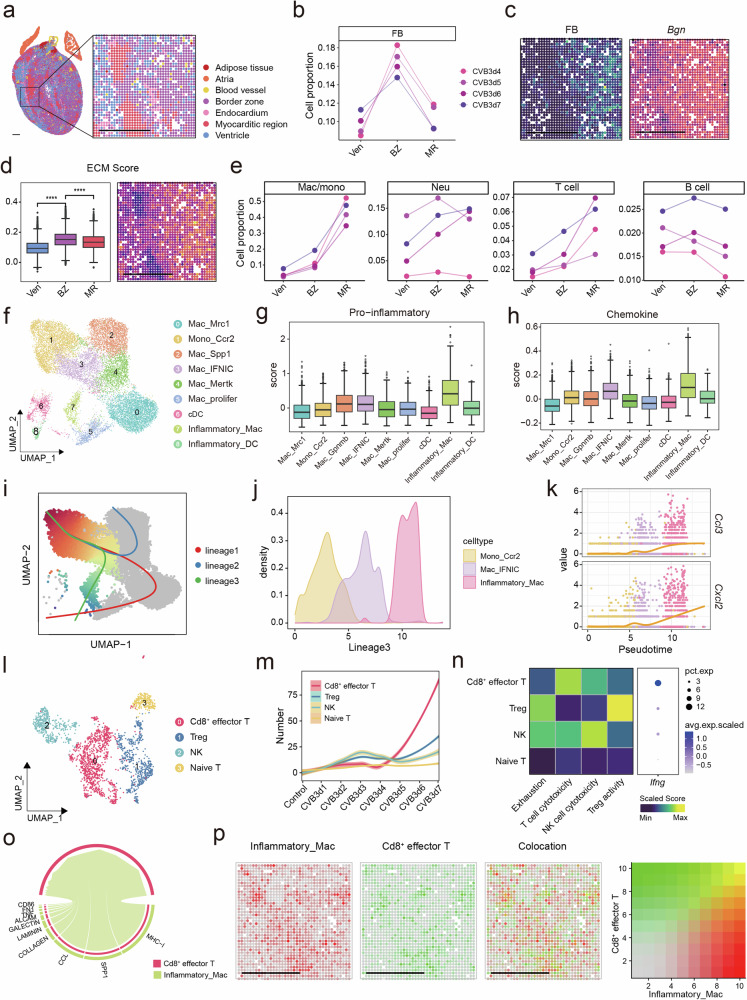
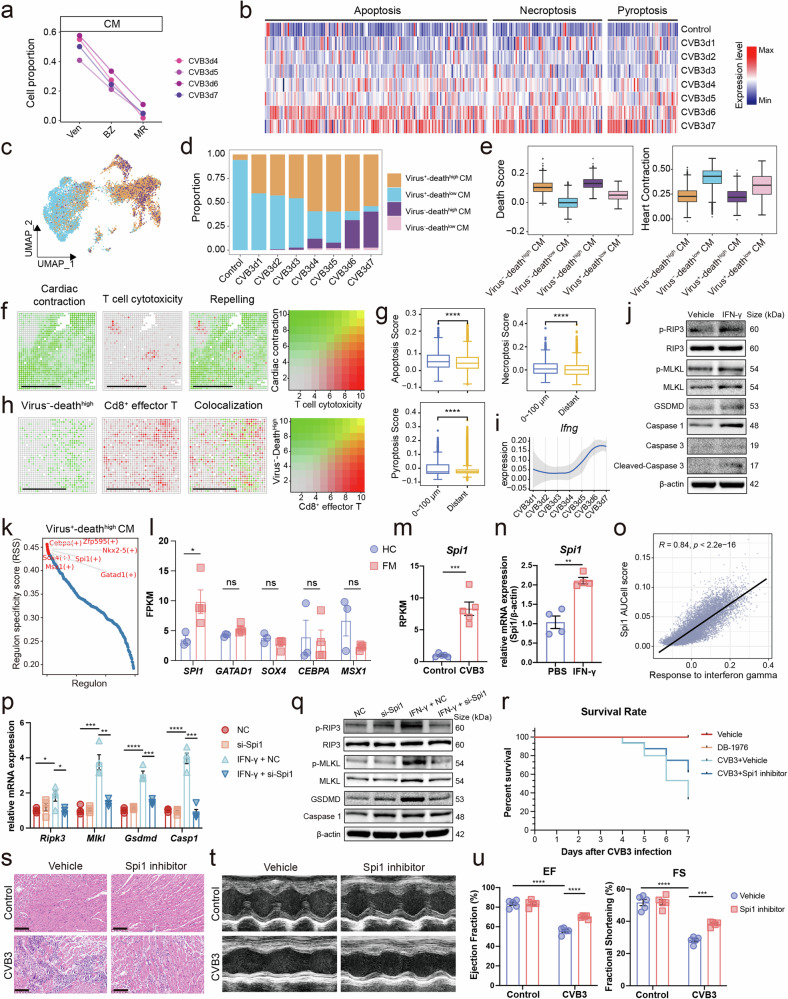
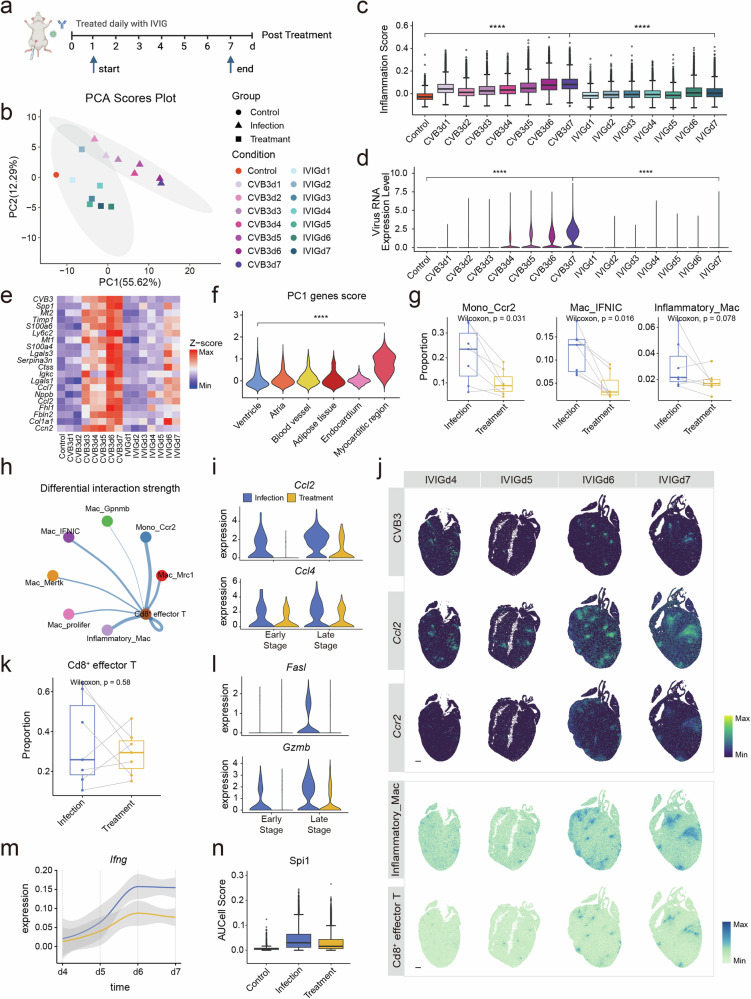
Fulminant myocarditis (FM) is a severe inflammatory condition of the myocardium that often results in sudden death, particularly in young individuals. In this study, we employed single-nucleus and spatial transcriptomics to perform a comprehensive analysis of coxsackievirus B3 (CVB3)-induced FM in A/J mice, spanning seven distinct time points pre- and post-treatment. Our findings reveal that mesothelial cells play a critical role in the early stage of myocarditis by acting as primary targets for CVB3 infection. This triggers the activation of macrophages, initiating a cascade of inflammation. Subsequently, pro-inflammatory Inflammatory_Mac and T cells infiltrate the myocardium, driving tissue damage. We also identified Cd8 + effector T cells as key mediators of cardiomyocyte injury. These cells release cytotoxic molecules, particularly IFN-γ, which modulates the expression of Spi1 , a factor implicated in exacerbating cardiomyocyte death and amplifying disease progression. Therapeutic interventions targeting the IFN-γ/ Spi1 axis demonstrated significant efficacy in FM models. Notably, intravenous immunoglobulin (IVIG) treatment reduced mortality, suppressed viral proliferation, and mitigated the hyperinflammatory state of FM. IVIG therapy also downregulated IFN-γ and Spi1 expression, underscoring its immunomodulatory and therapeutic potential. This comprehensive spatiotemporal transcriptomic analysis provides profound insights into the pathogenesis of FM and highlights actionable therapeutic targets, paving the way for more effective management strategies for this life-threatening condition.
Overview
The claims and statistics of this paper haven’t been checked yet.
Run the check — free, no account needed. It reads the open-access text and checks the sources it cites.
Integrity signals
Registry
Cites
Statistics
Figures
Verification
Claims the paper makes
The claims and statistics of this paper haven’t been checked yet.
Run the check — free, no account needed. It reads the open-access text and checks the sources it cites.
Claims other papers make about this one
Each is checked against this paper’s own text: does it say what the citing paper says it does?
The source backs part of the claim, not all of it — or backs it for a different population, condition or comparison.
In the citing paper
“However, both models demonstrate pivotal roles for myeloid–fibroblast communication and patchy spatial patterns of injury, underscoring shared pathways in tissue remodelling.”
From Elucidating cardiac fibroblasts heterogeneity and activation during experimental autoimmune myocarditis using spatial transcriptomics. (2025) · cites this paper as [13]
Experimental — accuracy not yet measuredThe source backs part of the claim, not all of it — or backs it for a different population, condition or comparison.
In the citing paper
“Both viral models, analyzed with spatial and single-cell transcriptomics, reveal pronounced spatial heterogeneity of myocardial injury, dense infiltration by immune cells (notably T cells and macrophages), and strong upregulation of interferon-related antiviral pathways.”
From Elucidating cardiac fibroblasts heterogeneity and activation during experimental autoimmune myocarditis using spatial transcriptomics. (2025) · cites this paper as [13]
Experimental — accuracy not yet measuredThe cited source says what the claim attributes to it.
In the citing paper
“In contrast, our autoimmune (EAM) model recapitulates immune-driven tissue damage and fibroblast activation, but lacks the direct cytopathic effects and robust early interferon signatures seen in viral myocarditis.”
From Elucidating cardiac fibroblasts heterogeneity and activation during experimental autoimmune myocarditis using spatial transcriptomics. (2025) · cites this paper as [13]
The cited source says what the claim attributes to it.
In the citing paper
“Importantly, recent results from Li et al. highlight the IFN-γ/Spi1 axis and mesothelial infection as unique drivers in fulminant viral myocarditis, with translational implications for immunomodulatory therapies [13].”
From Elucidating cardiac fibroblasts heterogeneity and activation during experimental autoimmune myocarditis using spatial transcriptomics. (2025) · cites this paper as [13]
Self-check
Percentages, sums and reported differences re-computed from the paper’s own numbers.
The self-check needs the paper’s full text.
Citations
Cites
Moderated estimation of fold change and dispersion for RNA-seq data with DESeq2
Love, M. I., Huber, W., & Anders, S. (2014) · Genome Biology · doi:10.1186/s13059-014-0550-8 · Cited by 95,106
STAR: ultrafast universal RNA-seq aligner
Dobin, A., Davis, C. A., Schlesinger, F., Drenkow, J., Zaleski, C., Jha, S., Batut, P., Chaisson, M., & Gingeras, T. R. (2013) · Bioinformatics · doi:10.1093/bioinformatics/bts635 · Cited by 51,709
clusterProfiler 4.0: A universal enrichment tool for interpreting omics data
(2021) · doi:10.1016/j.xinn.2021.100141 · Cited by 12,455
Fast, sensitive and accurate integration of single-cell data with Harmony
Korsunsky, I., Millard, N., Fan, J., Slowikowski, K., Zhang, F., Wei, K., Baglaenko, Y., Brenner, M., Loh, P.-R., & Raychaudhuri, S. (2019) · Nature Methods · doi:10.1038/s41592-019-0619-0 · Cited by 10,488
Inference and analysis of cell-cell communication using CellChat
Jin, S., Guerrero-Juarez, C. F., Zhang, L., Chang, I., Ramos, R., Kuan, C.-H., Myung, P., Plikus, M. V., & Nie, Q. (2021) · Nature Communications · doi:10.1038/s41467-021-21246-9 · Cited by 8,409
Molecular signatures database (MSigDB) 3.0
Liberzon, A., Subramanian, A., Pinchback, R., Thorvaldsdóttir, H., Tamayo, P., & Mesirov, J. P. (2011) · Bioinformatics · doi:10.1093/bioinformatics/btr260 · Cited by 7,111
Spatial reconstruction of single-cell gene expression data
Satija, R., Farrell, J. A., Gennert, D., Schier, A. F., & Regev, A. (2015) · Nature Biotechnology · doi:10.1038/nbt.3192 · Cited by 7,055
Vos, T., Barber, R. M., Bell, B., Bertozzi-Villa, A., Biryukov, S., Bolliger, I., Charlson, F., Davis, A., Degenhardt, L., Dicker, D., et al. (2015) · The Lancet · doi:10.1016/s0140-6736(15)60692-4 · Cited by 6,414
Reversed graph embedding resolves complex single-cell trajectories
Qiu, X., Mao, Q., Tang, Y., Wang, L., Chawla, R., Pliner, H. A., & Trapnell, C. (2017) · Nature Methods · doi:10.1038/nmeth.4402 · Cited by 5,070
McGinnis, C. S., Murrow, L. M., & Gartner, Z. J. (2019) · Cell Systems · doi:10.1016/j.cels.2019.03.003 · Cited by 4,521
Association of cardiac injury with mortality in hospitalized patients with COVID-19 in Wuhan, China
Shi, S., Qin, M., Shen, B., Cai, Y., Liu, T., Yang, F., Gong, W., Liu, X., Liang, J., Zhao, Q., et al. (2020) · JAMA Cardiology · doi:10.1001/jamacardio.2020.0950 · Cited by 4,349
Finak, G., McDavid, A., Yajima, M., Deng, J., Gersuk, V., Shalek, A. K., Slichter, C. K., Miller, H. W., McElrath, M. J., Prlic, M., et al. (2015) · Genome Biology · doi:10.1186/s13059-015-0844-5 · Cited by 3,159
Slingshot: cell lineage and pseudotime inference for single-cell transcriptomics
Street, K., Risso, D., Fletcher, R. B., Das, D., Ngai, J., Yosef, N., Purdom, E., & Dudoit, S. (2018) · BMC Genomics · doi:10.1186/s12864-018-4772-0 · Cited by 3,159
Collins, T. J. (2007) · BioTechniques · doi:10.2144/000112517 · Cited by 2,202
Mfuzz: A software package for soft clustering of microarray data
Kumar, L., & Futschik, M. E. (2007) · Bioinformation · doi:10.6026/97320630002005 · Cited by 1,980
Spatiotemporal transcriptomic atlas of mouse organogenesis using DNA nanoball-patterned arrays
Chen, A., Liao, S., Cheng, M., Ma, K., Wu, L., Lai, Y., Qiu, X., Yang, J., Xu, J., Hao, S., et al. (2022) · Cell · doi:10.1016/j.cell.2022.04.003 · Cited by 1,784
Self-citationA scalable SCENIC workflow for single-cell gene regulatory network analysis
Van de Sande, B., Flerin, C., Davie, K., De Waegeneer, M., Hulselmans, G., Aibar, S., Seurinck, R., Saelens, W., Cannoodt, R., Rouchon, Q., et al. (2020) · Nature Protocols · doi:10.1038/s41596-020-0336-2 · Cited by 1,494
Cell2location maps fine-grained cell types in spatial transcriptomics
Kleshchevnikov, V., Shmatko, A., Dann, E., Aivazidis, A., King, H. W., Li, T., Elmentaite, R., Lomakin, A., Kedlian, V., Gayoso, A., et al. (2022) · Nature Biotechnology · doi:10.1038/s41587-021-01139-4 · Cited by 1,279
Salem, J.-E., Manouchehri, A., Moey, M., Lebrun-Vignes, B., Bastarache, L., Pariente, A., Gobert, A., Spano, J.-P., Balko, J. M., Bonaca, M. P., et al. (2018) · The Lancet Oncology · doi:10.1016/s1470-2045(18)30608-9 · Cited by 1,271
Myocarditis and inflammatory cardiomyopathy: current evidence and future directions
Tschöpe, C., Ammirati, E., Bozkurt, B., Caforio, A. L. P., Cooper, L. T., Felix, S. B., Hare, J. M., Heidecker, B., Heymans, S., Hübner, N., et al. (2021) · Nature Reviews Cardiology · doi:10.1038/s41569-020-00435-x · Cited by 1,217
Spatial multi-omic map of human myocardial infarction
Kuppe, C., Ramirez Flores, R. O., Li, Z., Hayat, S., Levinson, R. T., Liao, X., Hannani, M. T., Tanevski, J., Wünnemann, F., Nagai, J. S., et al. (2022) · Nature · doi:10.1038/s41586-022-05060-x · Cited by 772
Viral myocarditis—diagnosis, treatment options, and current controversies
Pollack, A., Kontorovich, A. R., Fuster, V., & Dec, G. W. (2015) · Nature Reviews Cardiology · doi:10.1038/nrcardio.2015.108 · Cited by 657
Kociol, R. D., Cooper, L. T., Fang, J. C., Moslehi, J. J., Pang, P. S., Sabe, M. A., Shah, R. V., Sims, D. B., Thiene, G., Vardeny, O., et al. (2020) · Circulation · doi:10.1161/cir.0000000000000745 · Cited by 625
Intravenous Immune Globulin in Autoimmune and Inflammatory Diseases
Gelfand, E. W. (2012) · New England Journal of Medicine · doi:10.1056/nejmra1009433 · Cited by 497
Single-nucleus profiling of human dilated and hypertrophic cardiomyopathy
Chaffin, M., Papangeli, I., Simonson, B., Akkad, A.-D., Hill, M. C., Arduini, A., Fleming, S. J., Melanson, M., Hayat, S., Kost-Alimova, M., et al. (2022) · Nature · doi:10.1038/s41586-022-04817-8 · Cited by 418
T cells specific for α-myosin drive immunotherapy-related myocarditis
Axelrod, M. L., Meijers, W. C., Screever, E. M., Qin, J., Carroll, M. G., Sun, X., Tannous, E., Zhang, Y., Sugiura, A., Taylor, B. C., et al. (2022) · Nature · doi:10.1038/s41586-022-05432-3 · Cited by 367
Li, Y., Chen, B., Yang, X., Zhang, C., Yao, J., Li, P., Liu, Y., Li, Z., Qiao, B., Lau, W. B., et al. (2019) · Circulation · doi:10.1161/circulationaha.118.039262 · Cited by 317
Survival and Left Ventricular Function Changes in Fulminant Versus Nonfulminant Acute Myocarditis
Ammirati, E., Cipriani, M., Lilliu, M., Sormani, P., Varrenti, M., Raineri, C., Petrella, D., Garascia, A., Pedrotti, P., Roghi, A., et al. (2017) · Circulation · doi:10.1161/circulationaha.117.026386 · Cited by 297
Ammirati, E., Veronese, G., Brambatti, M., Merlo, M., Cipriani, M., Potena, L., Sormani, P., Aoki, T., Sugimura, K., Sawamura, A., et al. (2019) · Journal of the American College of Cardiology · doi:10.1016/j.jacc.2019.04.063 · Cited by 279
Hotspot identifies informative gene modules across modalities of single-cell genomics
DeTomaso, D., & Yosef, N. (2021) · Cell Systems · doi:10.1016/j.cels.2021.04.005 · Cited by 267
Jia, D., Chen, S., Bai, P., Luo, C., Liu, J., Sun, A., & Ge, J. (2022) · Circulation · doi:10.1161/circulationaha.121.057549 · Cited by 250
Self-citationBasso, C. (2022) · New England Journal of Medicine · doi:10.1056/nejmra2114478 · Cited by 241
The epicardium as a hub for heart regeneration
Cao, J., & Poss, K. D. (2018) · Nature Reviews Cardiology · doi:10.1038/s41569-018-0046-4 · Cited by 241
Single-Cell RNA Sequencing to Dissect the Immunological Network of Autoimmune Myocarditis.
Hua, X., Hu, G., Hu, Q., Chang, Y., Hu, Y., Gao, L., Chen, X., Yang, P.-C., Zhang, Y., Li, M., et al. (2020) · Circulation · doi:10.1161/circulationaha.119.043545 · Cited by 201 · cited 4×
“17 In ICI-induced myocarditis, pathogenic CD8 + T cells expand in both the blood and heart, 29,30 while Cxcl9 + and Cxcl10 + macrophages play an essential role in disease progression via IFN-γ signaling.”
InfluentialSelf-citationThe Role of the Epicardium During Heart Development and Repair
Quijada, P., Trembley, M. A., & Small, E. M. (2020) · Circulation Research · doi:10.1161/circresaha.119.315857 · Cited by 201
Zhu, H., Galdos, F. X., Lee, D., Waliany, S., Huang, Y. V., Ryan, J., Dang, K., Neal, J. W., Wakelee, H. A., Reddy, S. A., et al. (2022) · Circulation · doi:10.1161/circulationaha.121.056730 · Cited by 192
Fulminant myocarditis: a comprehensive review from etiology to treatments and outcomes
Hang, W., Chen, C., Seubert, J. M., & Wang, D. W. (2020) · Signal Transduction and Targeted Therapy · doi:10.1038/s41392-020-00360-y · Cited by 188
Self-citationExpansion of Pathogenic Cardiac Macrophages in Immune Checkpoint Inhibitor Myocarditis
Ma, P., Liu, J., Qin, J., Lai, L., Heo, G. S., Luehmann, H., Sultan, D., Bredemeyer, A., Bajapa, G., Feng, G., et al. (2024) · Circulation · doi:10.1161/circulationaha.122.062551 · Cited by 187
PI3K and Calcium Signaling in Cardiovascular Disease
Ghigo, A., Laffargue, M., Li, M., & Hirsch, E. (2017) · Circulation Research · doi:10.1161/circresaha.117.310183 · Cited by 186
Intravenous immunoglobulin for presumed viral myocarditis in children and adults
Robinson, J. L., Hartling, L., Vandermeer, B., & Klassen, T. P. (2015) · Cochrane Database of Systematic Reviews · doi:10.1002/14651858.cd004370.pub3 · Cited by 143
Inflammation in viral myocarditis: friend or foe?
Corsten, M. F., Schroen, B. L. M., & Heymans, S. R. B. (2012) · Trends in Molecular Medicine · doi:10.1016/j.molmed.2012.05.005 · Cited by 125
Zhang, H., Xu, A.-D., Sun, X., Yang, Y., Zhang, L., Bai, H., Ben, J., Zhu, X., Li, X., Yang, Q., et al. (2020) · Circulation Research · doi:10.1161/circresaha.119.316428 · Cited by 109
Cardiorenal complications of immune checkpoint inhibitors
Sury, K., Perazella, M. A., & Shirali, A. C. (2018) · Nature Reviews Nephrology · doi:10.1038/s41581-018-0035-1 · Cited by 106
Meier, A. B., Zawada, D. M., Angelis, M. T. D., Martens, L. D., Santamaria, G., Zengerle, S., Nowak‐Imialek, M., Kornherr, J., Zhang, F., Tian, X. Y., et al. (2023) · Nature Biotechnology · doi:10.1038/s41587-023-01718-7 · Cited by 102
Goland, S., Czer, L. S. C., Siegel, R. J., Tabak, S. W., Jordan, S. C., Luthringer, D., Mirocha, J., Coleman, B. L., Kass, R. M., & Trento, A. (2008) · Canadian Journal of Cardiology · doi:10.1016/s0828-282x(08)70638-x · Cited by 88
Maisch, B., Ruppert, V., & Pankuweit, S. (2014) · Current Heart Failure Reports · doi:10.1007/s11897-014-0196-6 · Cited by 84
Matsuura, H., Ichida, F., Saji, T., Ogawa, S., Waki, K., Kaneko, M., Tahara, M., Soga, T., Ono, Y., & Yasukochi, S. (2016) · Circulation Journal · doi:10.1253/circj.cj-16-0234 · Cited by 78
Li, S., Xu, S., Li, C., Ran, X., Cui, G., He, M., Miao, K., Zhao, C., Yan, J., Hui, R., et al. (2019) · Science China Life Sciences · doi:10.1007/s11427-018-9501-9 · Cited by 75
Self-citationSpatiotemporal transcriptomics reveals pathogenesis of viral myocarditis
Mantri, M., Hinchman, M. M., McKellar, D. W., Wang, M. F. Z., Cross, S. T., Parker, J. S. L., & De Vlaminck, I. (2022) · Nature Cardiovascular Research · doi:10.1038/s44161-022-00138-1 · Cited by 74 · cited 3×
“19 By integrating single-cell transcriptomics with ST, researchers can achieve a more comprehensive understanding of immunopathogenesis, particularly the spatial and temporal dynamics of cellular alterations during FM progression, thus identifying potential therapeutic targets.”
Fulminant myocarditis proven by early biopsy and outcomes
Huang, F., Ammirati, E., Ponnaiah, M., Montero, S., Raimbault, V., Abrams, D., Lebreton, G., Pellegrino, V., Ihle, J., Bottiroli, M., et al. (2023) · European Heart Journal · doi:10.1093/eurheartj/ehad707 · Cited by 69
Li, H., Zhang, M., Zhao, Q., Zhao, W., Zhuang, Y., Wang, J., Hang, W., Zheng, W., Wang, L., Chen, C., et al. (2023) · Cell Discovery · doi:10.1038/s41421-023-00593-5 · Cited by 67
Self-citationIntravenous immunoglobulin for presumed viral myocarditis in children and adults
Robinson, J. L., Hartling, L., Vandermeer, B., Sebastianski, M., & Klassen, T. P. (2020) · Cochrane Database of Systematic Reviews · doi:10.1002/14651858.cd004370.pub4 · Cited by 56
Single-Nucleus Sequencing of an Entire Mammalian Heart: Cell Type Composition and Velocity
Wolfien, M., Galow, A.-M., Müller, P., Bartsch, M., Brunner, R. M., Goldammer, T., Olaf Wolkenhauer, A., Hoeflich, A., & David, R. (2020) · Cells · doi:10.3390/cells9020318 · Cited by 50
Wang, Y., Zhang, H., Wang, Z., Wei, Y., Wang, M., Liu, M., Wang, X., Jiang, Y., Shi, G., Zhao, D., et al. (2020) · Science Translational Medicine · doi:10.1126/scitranslmed.aaw3172 · Cited by 46
Self-citationCardiac injuries in coronavirus disease 2019 (COVID-19)
Chen, C., Li, H., Hang, W., & Wang, D. W. (2020) · Journal of Molecular and Cellular Cardiology · doi:10.1016/j.yjmcc.2020.06.002 · Cited by 32
Self-citationIsogai, T., Yasunaga, H., Matsui, H., Tanaka, H., Horiguchi, H., & Fushimi, K. (2015) · Journal of Cardiac Failure · doi:10.1016/j.cardfail.2015.01.004 · Cited by 31
Zhou, N., Zhao, Y., Jiang, J., Shen, L., Li, J.-M., Wan, J., Ma, X., Zhang, J., Ammirati, E., & Wang, D. W. (2021) · Signal Transduction and Targeted Therapy · doi:10.1038/s41392-021-00700-6 · Cited by 25
Self-citationSuccessful high-dose intravenous immunoglobulin therapy for a patient with fulminant myocarditis
Kato, S., Morimoto, S.-I., Hiramitsu, S., Uemura, A., Ohtsuki, M., Kato, Y., Miyagishima, K., Mori, N., & Hishida, H. (2007) · Heart and Vessels · doi:10.1007/s00380-006-0923-3 · Cited by 24
Nie, X., Li, H., Wang, J., Cai, Y., Fan, J., Dai, B., Chen, C., & Wang, D. W. (2021) · Frontiers in Cellular and Infection Microbiology · doi:10.3389/fcimb.2021.704919 · Cited by 19
Self-citationMyocarditis: Entering the Mainstream
Cooper, L. T. (2024) · Circulation · doi:10.1161/circulationaha.123.065484 · Cited by 8
A single center experience of intravenous immunoglobulin treatment in Covid-19
Omma, A., Erden, A., Armağan, B., Güven, S. C., Karakaş, Ö., Şahiner, E. S., Erdem, D., İzdeş, Ş., Ateş, İ., & Küçükşahin, O. (2021) · International Immunopharmacology · doi:10.1016/j.intimp.2021.107891 · Cited by 8
Successful intravenous immunoglobulin therapy in a case of acute fulminant myocarditis.
Özyiğit, T., Unal, Z. N., & Özben, B. (2011) · PubMed · Cited by 4
Research works printed but not linked: 1
- Li, M. et al. StereoCell enables highly accurate single-cell segmentation for spatial transcriptomics. bioRxiv, 2023.2002.2028.530414 (2023).
Cited by
Sorted by citations
Xu, J., Chen, X., Guan, X., Zhang, H., Liu, Y., & Zhang, M. (2025) · Frontiers in Immunology · doi:10.3389/fimmu.2025.1643502 · Cited by 12
Self-citationWu, X., Xu, W., Lin, D., Sun, L., Loo, L., Dai, J., & Cao, G. (2025) · Journal of genetics and genomics/Journal of Genetics and Genomics · doi:10.1016/j.jgg.2025.09.003 · Cited by 11
Zhuang, Y., Yan, Y., Zheng, W., Rao, X., Jiang, J., Li, H., & Wang, D. (2025) · Redox Biology · doi:10.1016/j.redox.2025.103970 · Cited by 7
Self-citationCardiac Macrophages across Space and Time: Roles in Homeostasis, Disease, and Remodeling
Shrestha, S., & Dick, S. A. (2026) · Canadian Journal of Cardiology · doi:10.1016/j.cjca.2026.02.025 · Cited by 7
Charting the cardiac landscape: Advances in spatial transcriptomics for heart biology
Farah, E. N., Diaz, J. T., Bloomekatz, J. E., & Chi, N. C. (2025) · Seminars in Cell and Developmental Biology · doi:10.1016/j.semcdb.2025.103648 · Cited by 9
Metadata
- Authors
- Li, H., Chen, X., Wang, J. J., Shen, J., Abuduwufuer, K., Zhang, Z., Dong, Z., Wen, Z., He, J., Chen, S., Li, W., Chen, C., Li, F., Fang, X., & Wang, D. W.
- Affiliations
- Tongji Hospital (CN)
- Chinese Academy of Sciences (CN)
- BGI Research (CN)
- MGI (CN)
- Guangzhou University of Chinese Medicine (CN)
- Corresponding author
- Fang, Xiaodong
- Wang, Dao Wen
- ORCID
- Venue
- Signal Transduction and Targeted Therapy
- Published
- 2025-02-10
- Volume
- 10
- Issue
- 1
- Pages
- 59-59
- ISSN
- 2059-3635 (ISSN-L)
- PMC
- PMC11808084
- OpenAlex
- W4407284214
- Cited by
- 40
- References
- 65
- Citations by year
- 2026: 24 · 2025: 16
- FWCI
- 27.94
- Type
- journal article
- Language
- en
- Open access
- gold
- doi.org
- Locations
- Signal Transduction and Targeted Therapy (publishedVersion, cc-by)
- PubMed Central (publishedVersion, cc-by)
- PubMed (publishedVersion)
- DOAJ (DOAJ: Directory of Open Access Journals) (submittedVersion)
- Funders
- National Natural Science Foundation of China (82330010, 82241034)
- Topics
- Health Sciences › Medicine › Infectious Diseases › Viral Infections and Immunology Research
- Health Sciences › Medicine › Cardiology and Cardiovascular Medicine › Cardiac Fibrosis and Remodeling
- Health Sciences › Medicine › Cardiology and Cardiovascular Medicine › Takotsubo Cardiomyopathy and Associated Phenomena
- Keywords
- fulminant myocarditis, coxsackievirus B3, mesothelial cells, macrophage activation, T cell infiltration, CD8+ effector T cells, cardiomyocyte injury, interferon-gamma, PU.1, intravenous immunoglobulin, hyperinflammation, A/J mice, sudden cardiac death
- MeSH terms
- Animals, Coxsackievirus Infections, Disease Models, Animal, Humans, Interferon-gamma, Macrophages, Male, Myocarditis, Proto-Oncogene Proteins, Trans-Activators, Immunoglobulins, Intravenous, CD8-Positive T-Lymphocytes, Enterovirus B, Human, Myocytes, Cardiac, Mice, Transcriptome
About these checks
Registry, retraction, Cites and statistics results are computed, not judged, with one exception: a printed reference that no index lists is read once by a model before it counts as a citation error. Claims are extracted by a model and kept only when their quote appears verbatim in the text; each cited source is then checked, with a model’s help, for whether it says what the claim relies on. Those verdicts can be wrong — read the claim’s quote and the cited source before relying on one.
Statistics and arithmetic are recomputed, not judged.
Confidence bands are shown only for fields calibrated on our annotated test set. None is calibrated yet, so no band is shown.
What counts as a claim ›How we measure confidence ›How we check this ›
Are you an author, or do you see a problem with this page? Request a review
