

The DOI matches its Crossref record; 41 of the 41 references it cites were found in a registry or an index.
Reduced levels of miRNAs 449 and 34 in sperm of mice and men exposed to early life stress
Open accessAbstract
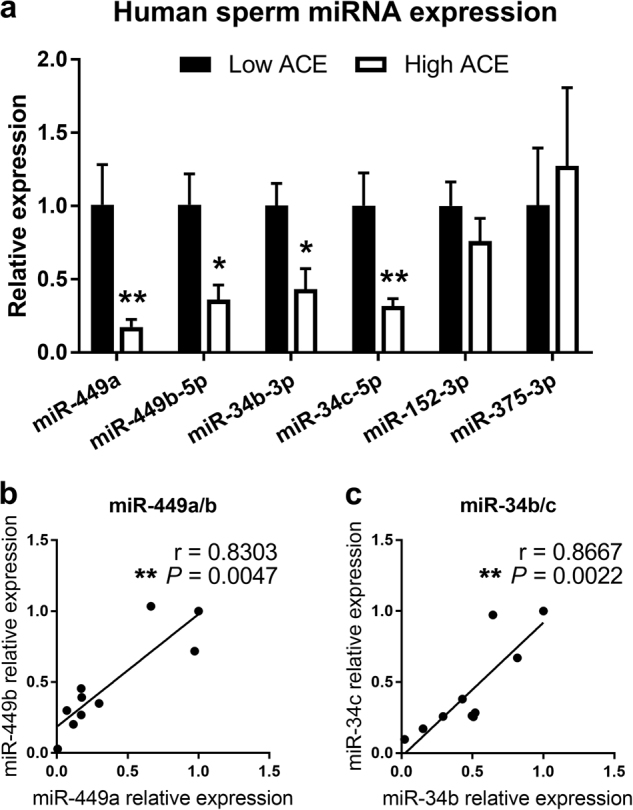
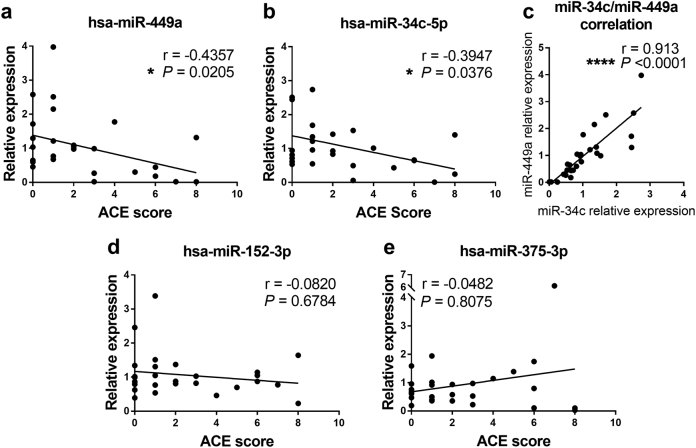
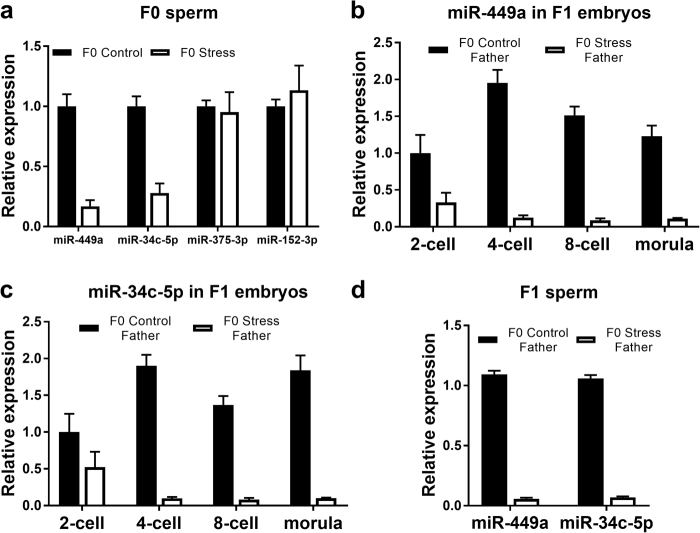
Exposure of male mice to early life stress alters the levels of specific sperm miRNAs that promote stress-associated behaviors in their offspring. To begin to evaluate whether similar phenomena occur in men, we searched for sperm miRNA changes that occur in both mice and men exposed to early life stressors that have long-lasting effects. For men, we used the Adverse Childhood Experience (ACE) questionnaire. It reveals the degree of abusive and/or dysfunctional family experiences when young, which increases risks of developing future psychological and physical disorders. For male mice, we used adolescent chronic social instability (CSI) stress, which not only enhances sociability defects for >1 year, but also anxiety and defective sociability in female offspring for multiple generations through the male lineage. Here we found a statistically significant inverse correlation between levels of multiple miRNAs of the miR-449/34 family and ACE scores of Caucasian males. Remarkably, we found members of the same sperm miRNA family are also reduced in mice exposed to CSI stress. Thus, future studies should be designed to directly test whether reduced levels of these miRNAs could be used as unbiased indicators of current and/or early life exposure to severe stress. Moreover, after mating stressed male mice, these sperm miRNA reductions persist in both early embryos through at least the morula stage and in sperm of males derived from them, suggesting these miRNA changes contribute to transmission of stress phenotypes across generations. Since offspring of men exposed to early life trauma have elevated risks for psychological disorders, these findings raise the possibility that a portion of this risk may be derived from epigenetic regulation of these sperm miRNAs.
Overview
The claims and statistics of this paper haven’t been checked yet.
Run the check — free, no account needed. It reads the open-access text and checks the sources it cites.
Integrity signals
Registry
Cites
Statistics
Figures
Verification
Claims the paper makes
The claims and statistics of this paper haven’t been checked yet.
Run the check — free, no account needed. It reads the open-access text and checks the sources it cites.
Claims other papers make about this one
Each is checked against this paper’s own text: does it say what the citing paper says it does?
The source backs part of the claim, not all of it — or backs it for a different population, condition or comparison.
In the citing paper
“This has almost exclusively been done in animal models, 63 , 64 , 65 , 66 with a few exceptions of studies in human cohorts. 67”
From Epigenetics and depression (2019) · cites this paper as [67]
Experimental — accuracy not yet measuredThe source backs part of the claim, not all of it — or backs it for a different population, condition or comparison.
In the citing paper
“Nonetheless, a few studies have shown environmentally driven changes of the epigenetic landscape in other ways, such as via histone modifications and long noncoding RNAs.”
From Epigenetics and depression (2019) · cites this paper as [67]
Experimental — accuracy not yet measured
Self-check
Percentages, sums and reported differences re-computed from the paper’s own numbers.
The self-check needs the paper’s full text.
Citations
Cites
Child abuse: Adolescent records vs. adult recall
Femina, D. D., Yeager, C. A., & Lewis, D. O. (1990) · Child Abuse & Neglect · doi:10.1016/0145-2134(90)90033-p · Cited by 8,820
Dube, S. R., Anda, R. F., Felitti, V. J., Chapman, D. P., Williamson, D. F., & Giles, W. H. (2001) · JAMA · doi:10.1001/jama.286.24.3089 · Cited by 2,296
Adverse childhood experiences and the risk of depressive disorders in adulthood
Chapman, D. P., Whitfield, C. L., Felitti, V. J., Dube, S. R., Edwards, V. J., & Anda, R. F. (2004) · Journal of Affective Disorders · doi:10.1016/j.jad.2003.12.013 · Cited by 2,267
Implication of sperm RNAs in transgenerational inheritance of the effects of early trauma in mice
Gapp, K., Jawaid, A., Sarkies, P., Bohacek, J., Pelczar, P., Prados, J., Farinelli, L., Miska, E., & Mansuy, I. M. (2014) · Nature Neuroscience · doi:10.1038/nn.3695 · Cited by 1,306
Epigenetic transmission of the impact of early stress across generations
Franklin, T. B., Russig, H., Weiss, I. C., Gräff, J., Linder, N., Michalon, A., Vizi, S., & Mansuy, I. M. (2010) · Biological Psychiatry · doi:10.1016/j.biopsych.2010.05.036 · Cited by 1,125
Reuben, A., Moffitt, T. E., Caspi, A., Belsky, D. W., Harrington, H., Schroeder, F., Hogan, S., Ramrakha, S., Poulton, R., & Danese, A. (2016) · Journal of Child Psychology and Psychiatry · doi:10.1111/jcpp.12621 · Cited by 835
Rodgers, A. B., Morgan, C. P., Bronson, S. L., Revello, S., & Bale, T. L. (2013) · The Journal of Neuroscience · doi:10.1523/jneurosci.0914-13.2013 · Cited by 814
Transgenerational epigenetic programming via sperm microRNA recapitulates effects of paternal stress
Rodgers, A. B., Morgan, C. P., Leu, N. A., & Bale, T. L. (2015) · Proceedings of the National Academy of Sciences · doi:10.1073/pnas.1508347112 · Cited by 751
Associations Between Adverse Childhood Experiences, High-Risk Behaviors, and Morbidity in Adulthood
Campbell, J. A., Walker, R. J., & Egede, L. E. (2015) · American Journal of Preventive Medicine · doi:10.1016/j.amepre.2015.07.022 · Cited by 719
Health consequences of adverse childhood experiences: a systematic review
Kalmakis, K. A., & Chandler, G. E. (2015) · Journal of the American Association of Nurse Practitioners · doi:10.1002/2327-6924.12215 · Cited by 694
Cited by
Sorted by citations
Handbook of Religion and Health
Koenig, H. G., VanderWeele, T. J., & Peteet, J. R. (2023) · doi:10.1093/oso/9780190088859.001.0001 · Cited by 1,160
Intergenerational and transgenerational epigenetic inheritance in animals
Perez, M. F., & Lehner, B. (2019) · Nature Cell Biology · doi:10.1038/s41556-018-0242-9 · Cited by 528
Critical period regulation across multiple timescales
Reh, R. K., Dias, B. G., Nelson, C. A., Kaufer, D., Werker, J. F., Kolb, B., Levine, J. D., & Hensch, T. K. (2020) · Proceedings of the National Academy of Sciences · doi:10.1073/pnas.1820836117 · Cited by 492
The Role of the Epididymis and the Contribution of Epididymosomes to Mammalian Reproduction
James, E. R., Carrell, D. T., Aston, K. I., Jenkins, T. G., Yeste, M., & Salas‐Huetos, A. (2020) · International Journal of Molecular Sciences · doi:10.3390/ijms21155377 · Cited by 357
Biological embedding of experience: a primer on epigenetics
Aristizabal, M. J., Anreiter, I., Halldorsdottir, T., Odgers, C. L., McDade, T. W., Goldenberg, A., Mostafavi, S., Kobor, M. S., Binder, E. B., Sokolowski, M. B., et al. (2020) · Proceedings of the National Academy of Sciences · doi:10.1073/pnas.1820838116 · Cited by 268
Metadata
- Authors
- Dickson, D. A., Paulus, J. K., Mensah, V., Lem, J., Saavedra-Rodriguez, L., Gentry, A., Pagidas, K., & Feig, L. A.
- Affiliations
- Tufts University (US)
- Brown University (US)
- Tufts Medical Center (US)
- University of Louisville (US)
- Corresponding author
- Feig, Larry A.
- Venue
- Translational Psychiatry
- Published
- 2018-05-23
- Volume
- 8
- Issue
- 1
- Pages
- 101-101
- ISSN
- 2158-3188 (ISSN-L)
- PMC
- PMC5966454
- OpenAlex
- W2803802792
- Cited by
- 208
- References
- 41
- Citations by year
- 2026: 11 · 2025: 20 · 2024: 16 · 2023: 61 · 2022: 16 · 2021: 25 · 2020: 27 · 2019: 28 · 2018: 4
- FWCI
- 22.53
- Type
- journal article
- Language
- en
- Open access
- gold
- doi.org
- Locations
- Translational Psychiatry (publishedVersion, cc-by)
- Europe PMC (PubMed Central) (publishedVersion, other-oa)
- PubMed Central (publishedVersion, cc-by)
- PubMed (publishedVersion)
- DOAJ (DOAJ: Directory of Open Access Journals) (submittedVersion)
- Funders
- National Institutes of Health
- Center for Neuroscience Research (P30 NS047243)
- National Institute of Mental Health (R01MH107536)
- National Institute of Neurological Disorders and Stroke (P30NS047243)
- Topics
- Health Sciences › Medicine › Reproductive Medicine › Sperm and Testicular Function
- Life Sciences › Biochemistry, Genetics and Molecular Biology › Cancer Research › MicroRNA in disease regulation
- Life Sciences › Biochemistry, Genetics and Molecular Biology › Molecular Biology › Epigenetics and DNA Methylation
- Keywords
- sperm microRNA, miR-449, miR-34, early life stress, adverse childhood experiences, epigenetic regulation, sociability, anxiety, male fertility, embryonic development, stress biomarkers
- MeSH terms
- Adult Survivors of Child Adverse Events, Adult, Animals, Humans, Male, Spermatozoa, Stress, Psychological, MicroRNAs, White People, Mice
About these checks
Registry, retraction, Cites and statistics results are computed, not judged, with one exception: a printed reference that no index lists is read once by a model before it counts as a citation error. Claims are extracted by a model and kept only when their quote appears verbatim in the text; each cited source is then checked, with a model’s help, for whether it says what the claim relies on. Those verdicts can be wrong — read the claim’s quote and the cited source before relying on one.
Statistics and arithmetic are recomputed, not judged.
Confidence bands are shown only for fields calibrated on our annotated test set. None is calibrated yet, so no band is shown.
What counts as a claim ›How we measure confidence ›How we check this ›
Are you an author, or do you see a problem with this page? Request a review
