

The DOI matches its Crossref record; 51 of the 51 references it cites were found in a registry or an index.
Galectin-3 promotes Aβ oligomerization and Aβ toxicity in a mouse model of Alzheimer’s disease
Open accessAbstract
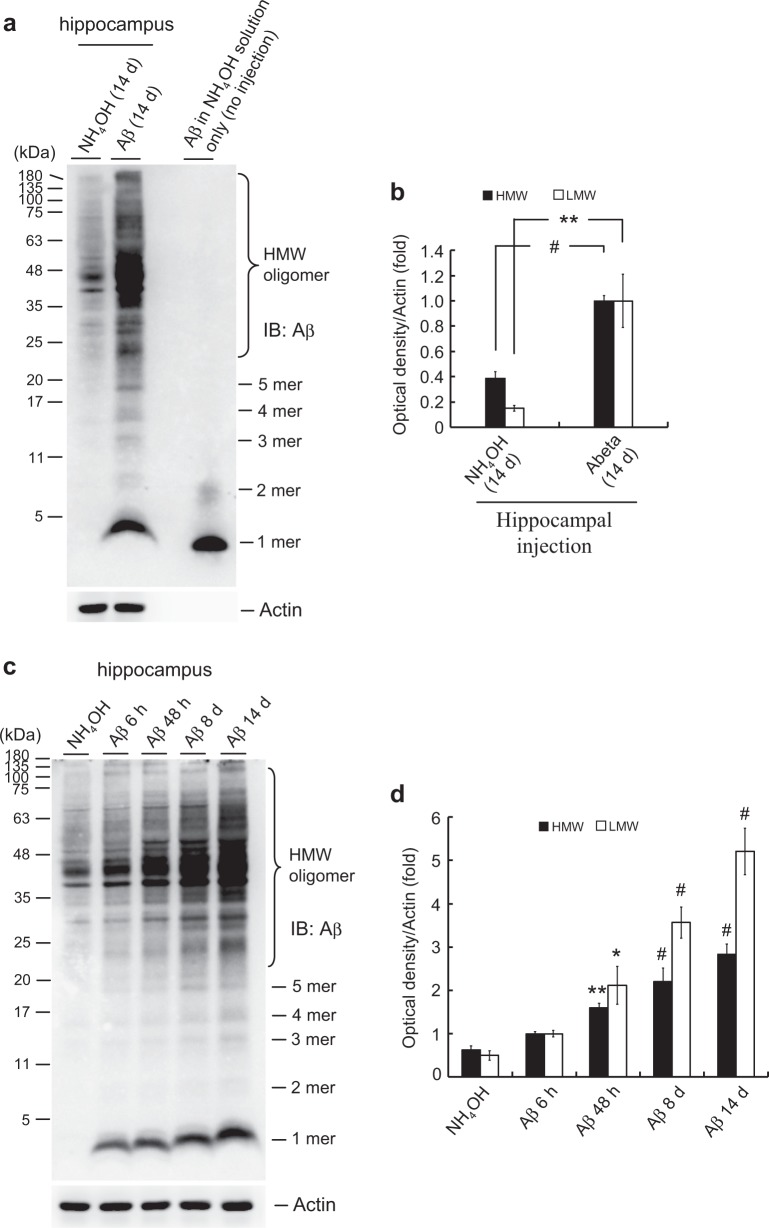
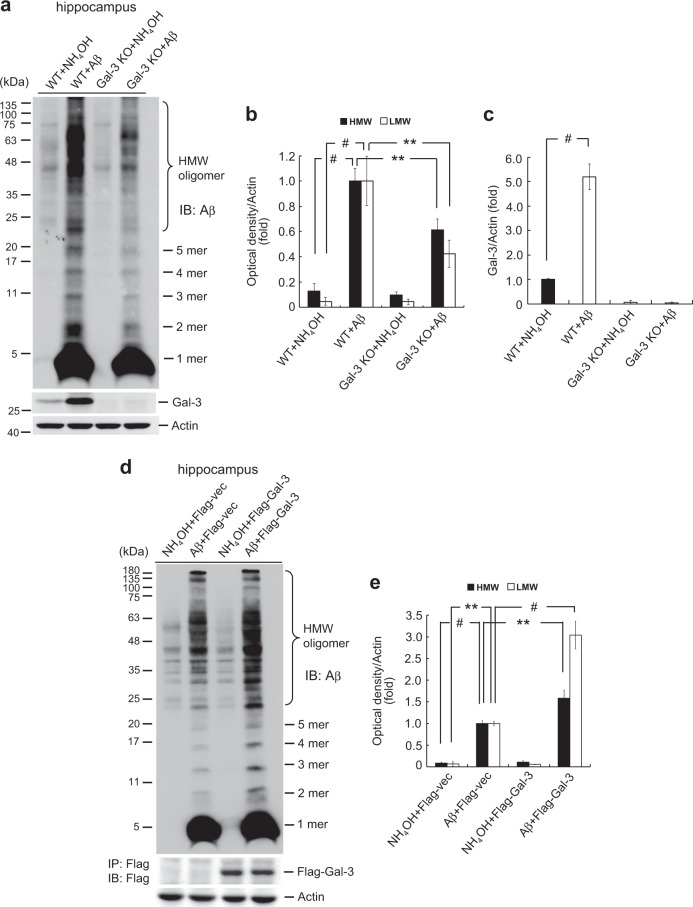
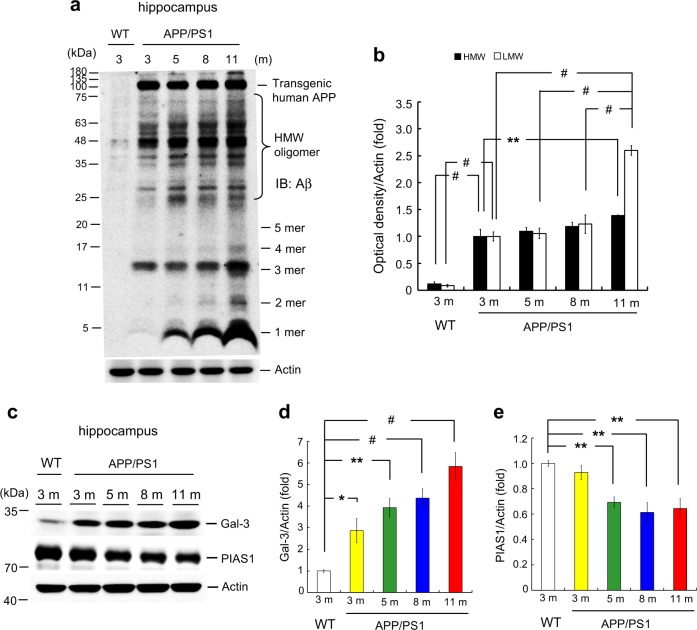
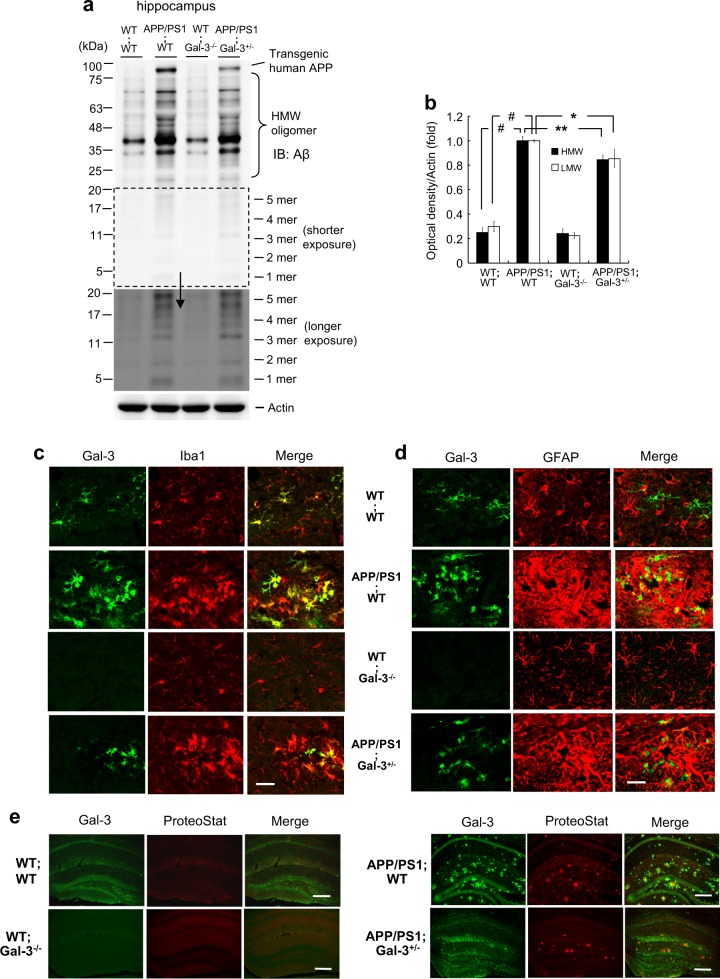
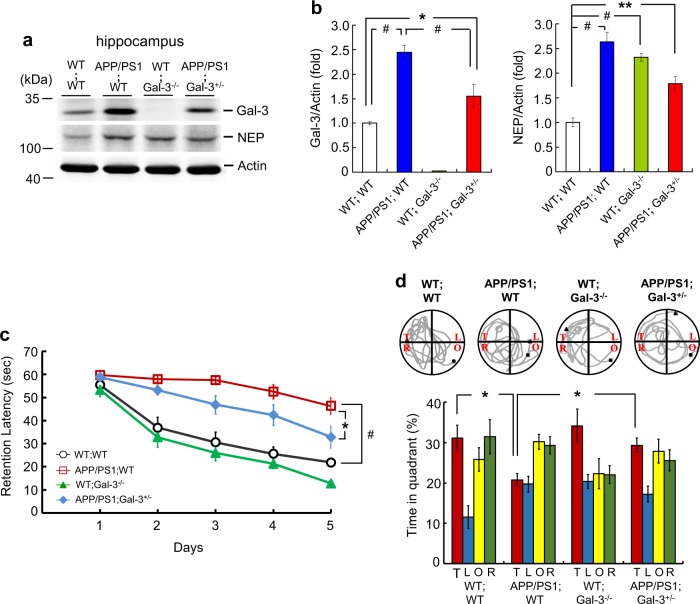
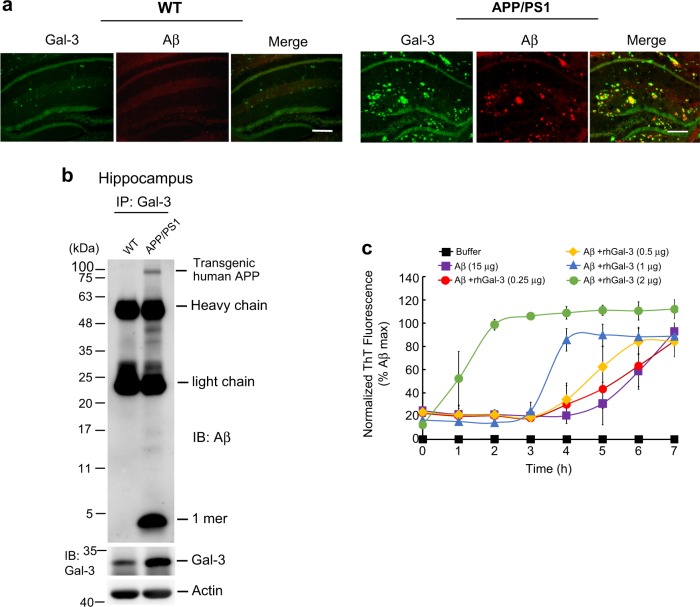
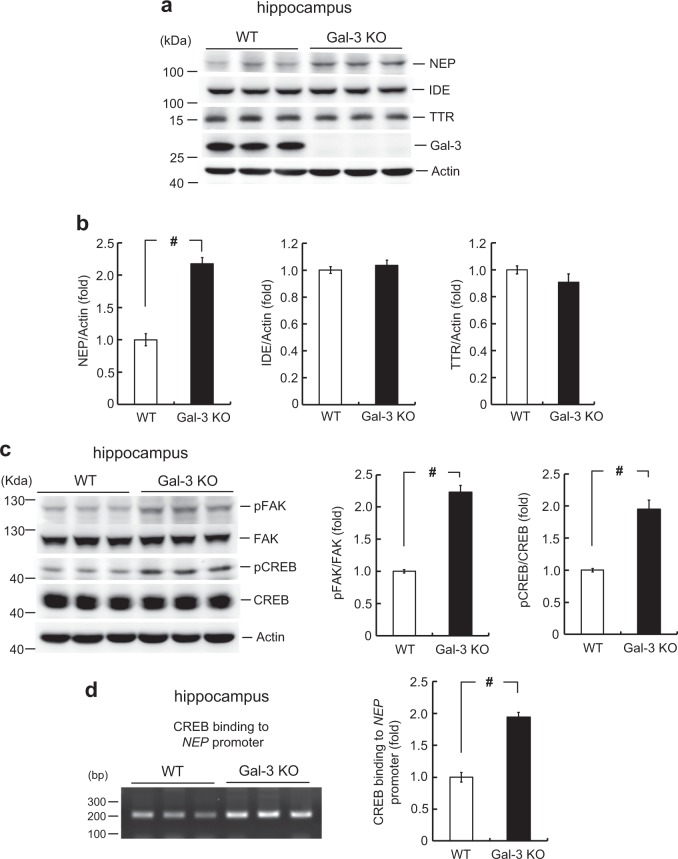
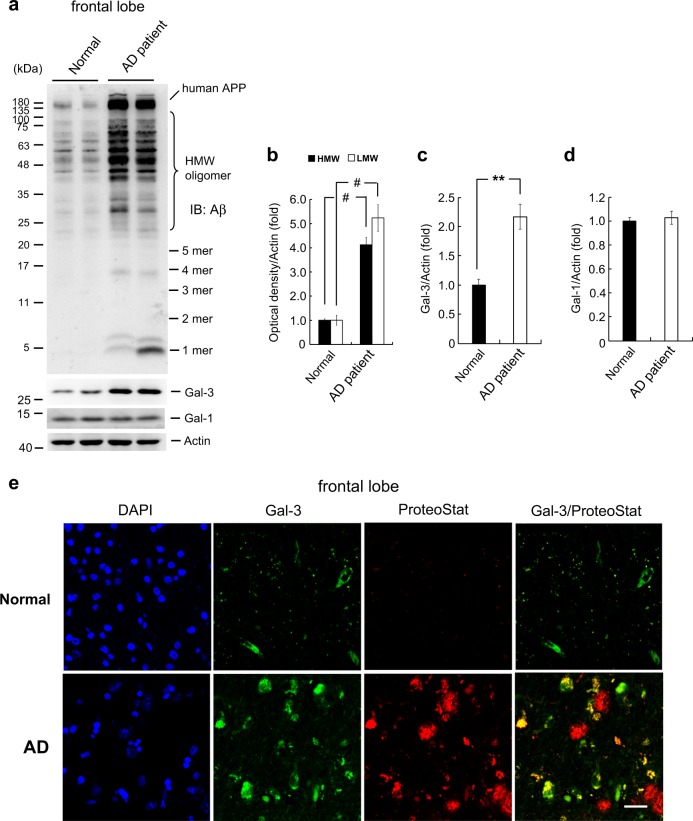
Amyloid-β (Aβ) oligomers largely initiate the cascade underlying the pathology of Alzheimer’s disease (AD). Galectin-3 (Gal-3), which is a member of the galectin protein family, promotes inflammatory responses and enhances the homotypic aggregation of cancer cells. Here, we examined the role and action mechanism of Gal-3 in Aβ oligomerization and Aβ toxicities. Wild-type (WT) and Gal-3-knockout (KO) mice, APP/PS1;WT mice, APP/PS1;Gal-3 +/− mice and brain tissues from normal subjects and AD patients were used. We found that Aβ oligomerization is reduced in Gal-3 KO mice injected with Aβ, whereas overexpression of Gal-3 enhances Aβ oligomerization in the hippocampi of Aβ-injected mice. Gal-3 expression shows an age-dependent increase that parallels endogenous Aβ oligomerization in APP/PS1 mice. Moreover, Aβ oligomerization, Iba1 expression, GFAP expression and amyloid plaque accumulation are reduced in APP/PS1;Gal-3 +/− mice compared with APP/PS1;WT mice. APP/PS1;Gal-3 +/− mice also show better acquisition and retention performance compared to APP/PS1;WT mice. In studying the mechanism underlying Gal-3-promoted Aβ oligomerization, we found that Gal-3 primarily co-localizes with Iba1, and that microglia-secreted Gal-3 directly interacts with Aβ. Gal-3 also interacts with triggering receptor expressed on myeloid cells-2, which then mediates the ability of Gal-3 to activate microglia for further Gal-3 expression. Immunohistochemical analyses show that the distribution of Gal-3 overlaps with that of endogenous Aβ in APP/PS1 mice and partially overlaps with that of amyloid plaque. Moreover, the expression of the Aβ-degrading enzyme, neprilysin, is increased in Gal-3 KO mice and this is associated with enhanced integrin-mediated signaling. Consistently, Gal-3 expression is also increased in the frontal lobe of AD patients, in parallel with Aβ oligomerization. Because Gal-3 expression is dramatically increased as early as 3 months of age in APP/PS1 mice and anti-Aβ oligomerization is believed to protect against Aβ toxicity, Gal-3 could be considered a novel therapeutic target in efforts to combat AD.
Overview
The claims and statistics of this paper haven’t been checked yet.
Run the check — free, no account needed. It reads the open-access text and checks the sources it cites.
Integrity signals
Registry
Cites
Statistics
Figures
Verification
Claims the paper makes
The claims and statistics of this paper haven’t been checked yet.
Run the check — free, no account needed. It reads the open-access text and checks the sources it cites.
Claims other papers make about this one
Each is checked against this paper’s own text: does it say what the citing paper says it does?
The cited source says what the claim attributes to it.
In the citing paper
“Although LGALS3 was reported to promote Aβ oligomerization and toxicity, these studies were performed using either global Lgals3 -KO mice or Aβ monomers precultured with LGALS3 before injection into the brain 52,53 .”
From APOE4 impairs the microglial response in Alzheimer’s disease by inducing TGFβ-mediated checkpoints (2023) · cites this paper as [53]
Self-check
Percentages, sums and reported differences re-computed from the paper’s own numbers.
The self-check needs the paper’s full text.
Citations
Cites
McKhann, G. M., Knopman, D. S., Chertkow, H., Hyman, B. T., Jack, C. R., Kawas, C. H., Klunk, W. E., Koroshetz, W. J., Manly, J. J., Mayeux, R., et al. (2011) · Alzheimer's & Dementia · doi:10.1016/j.jalz.2011.03.005 · Cited by 18,657
Mild cognitive impairment as a diagnostic entity
Petersen, R. C. (2004) · Journal of Internal Medicine · doi:10.1111/j.1365-2796.2004.01388.x · Cited by 7,864
Farris, W., Mansourian, S., Chang, Y., Lindsley, L., Eckman, E. A., Frosch, M. P., Eckman, C. B., Tanzi, R. E., Selkoe, D. J., & Guénette, S. Y. (2003) · Proceedings of the National Academy of Sciences · doi:10.1073/pnas.0230450100 · Cited by 1,526
Galectins. Structure and function of a large family of animal lectins.
Barondes, S. H., Cooper, D. N., Gitt, M. A., & Leffler, H. (1994) · Journal of Biological Chemistry · doi:10.1016/s0021-9258(17)31891-4 · Cited by 1,498
Galectins as modulators of tumour progression
Liu, F., & Rabinovich, G. A. (2005) · Nature reviews. Cancer · doi:10.1038/nrc1527 · Cited by 1,435
Galectins: A family of animal β-galactoside-binding lectins
Barondes, S. H., Castronovo, V., Cooper, D. N. W., Cummings, R. D., Drickamer, K., Felzi, T., Gitt, M. A., Hirabayashi, J., Hughes, C., Kasai, K.-I., et al. (1994) · Cell · doi:10.1016/0092-8674(94)90498-7 · Cited by 1,223
Metabolic Regulation of Brain Aβ by Neprilysin
Iwata, N., Tsubuki, S., Takaki, Y., Shirotani, K., Lu, B., Gerard, N. P., Gerard, C. J., Hama, E., Lee, H.-J., & Saido, T. C. (2001) · Science · doi:10.1126/science.1059946 · Cited by 982
Amyloidogenic processing of the Alzheimer β-amyloid precursor protein depends on lipid rafts
Ehehalt, R., Keller, P., Haass, C., Thiele, C., & Simons, K. (2003) · The Journal of Cell Biology · doi:10.1083/jcb.200207113 · Cited by 932
The Amyloid-β Oligomer Hypothesis: Beginning of the Third Decade
Cline, E. N., Bicca, M. A., Viola, K. L., & Klein, W. L. (2018) · Journal of Alzheimer's Disease · doi:10.3233/jad-179941 · Cited by 870
Iwata, N., Tsubuki, S., Takaki, Y., Watanabe, K., Sekiguchi, M., Hosoki, E., Kawashima-Morishima, M., Lee, H.-J., Hama, E., Sekine-Aizawa, Y., et al. (2000) · Nature Medicine · doi:10.1038/72237 · Cited by 867
Cited by
Sorted by citations
Items 101–141 of 141
Xiao, C., Chen, T., Yuan, M., Li, Y., & Wang, F. (2023) · Research Square · doi:10.21203/rs.3.rs-2224001/v2
Hosseini, R., Mirshekar, M. A., Montazerifar, F., Soltanmohammadi, M., & Behrasi, F. (2023) · Research Square · doi:10.21203/rs.3.rs-2900704/v1
Liu, X., Chen, P., Wu, W., Li, X., Wang, C., Chai, K., Yuan, F., Zheng, H., Yao, Y., Li, C., et al. (2023) · Research Square · doi:10.21203/rs.3.rs-3470451/v1
Improvement of Clinical Diagnosis Accuracy of Alzheimer’s Disease Using Multiple Blood Biomarkers
Na, H., Shin, K. Y., Lee, D., Yoon, C., Han, S., Park, J., Mook‐Jung, I., Jang, J., & Kwon, S. (2024) · Laboratory Medicine Online · doi:10.47429/lmo.2024.14.4.330
Camprubí-Ferrer, L., Soldán-Hidalgo, J., Axell, E., Dell’Eva, M., García-Cruzado, M., García‐Revilla, J., Yang, Y., Fernández‐Calle, R., Larlham, L., Chouhan, B., et al. (2025) · bioRxiv (Cold Spring Harbor Laboratory) · doi:10.1101/2025.03.17.643790 · Cited by 1
Fluid and Imaging Markers of Glial Reactivity
Suárez‐Calvet, M. (2025) · Springer eBooks · doi:10.1007/978-3-031-80849-4_6
Mani, R. R., Panneerselvam, J., Chinnappan, S., & Ranganathan, V. (2025) · Current Drug Therapy · doi:10.2174/0115748855404595250908114801
Emre, C., Khanh, V., Jun, B., Hjorth, E., Alcalde, S. G., Kautzmann, M.-A. I., Gordon, W. C., Nilsson, P., Bazan, N. G., & Schultzberg, M. (2021) · Figshare · doi:10.6084/m9.figshare.14880548
Emre, C., Khanh, V., Jun, B., Hjorth, E., Alcalde, S. G., Kautzmann, M.-A. I., Gordon, W. C., Nilsson, P., Bazan, N. G., & Schultzberg, M. (2021) · Figshare · doi:10.6084/m9.figshare.14880545
Kim, D. W., Tu, K. J., Wei, A., Lau, A., Gonzalez-Gil, A., Cao, T., Braunstein, K. E., Ling, J. P., Troncoso, J. C., Wong, P. C., et al. (2024) · Figshare · doi:10.6084/m9.figshare.26555684
Kim, D. W., Tu, K. J., Wei, A., Lau, A., Gonzalez-Gil, A., Cao, T., Braunstein, K. E., Ling, J. P., Troncoso, J. C., Wong, P. C., et al. (2024) · Figshare · doi:10.6084/m9.figshare.26555720
Kim, D. W., Tu, K. J., Wei, A., Lau, A., Gonzalez-Gil, A., Cao, T., Braunstein, K. E., Ling, J. P., Troncoso, J. C., Wong, P. C., et al. (2024) · Figshare · doi:10.6084/m9.figshare.26555696
Kim, D. W., Tu, K. J., Wei, A., Lau, A., Gonzalez-Gil, A., Cao, T., Braunstein, K. E., Ling, J. P., Troncoso, J. C., Wong, P. C., et al. (2024) · Figshare · doi:10.6084/m9.figshare.26555693
Emre, C., Khanh, V., Jun, B., Hjorth, E., Alcalde, S. G., Kautzmann, M.-A. I., Gordon, W. C., Nilsson, P., Bazan, N. G., & Schultzberg, M. (2021) · Figshare · doi:10.6084/m9.figshare.14880560
Kim, D. W., Tu, K. J., Wei, A., Lau, A., Gonzalez-Gil, A., Cao, T., Braunstein, K. E., Ling, J. P., Troncoso, J. C., Wong, P. C., et al. (2024) · Figshare · doi:10.6084/m9.figshare.26555714
Kim, D. W., Tu, K. J., Wei, A., Lau, A., Gonzalez-Gil, A., Cao, T., Braunstein, K. E., Ling, J. P., Troncoso, J. C., Wong, P. C., et al. (2024) · Figshare · doi:10.6084/m9.figshare.26555717
Kim, D. W., Tu, K. J., Wei, A., Lau, A., Gonzalez-Gil, A., Cao, T., Braunstein, K. E., Ling, J. P., Troncoso, J. C., Wong, P. C., et al. (2024) · Figshare · doi:10.6084/m9.figshare.26555687
Kim, D. W., Tu, K. J., Wei, A., Lau, A., Gonzalez-Gil, A., Cao, T., Braunstein, K. E., Ling, J. P., Troncoso, J. C., Wong, P. C., et al. (2024) · Figshare · doi:10.6084/m9.figshare.26555690
Kim, D. W., Tu, K. J., Wei, A., Lau, A., Gonzalez-Gil, A., Cao, T., Braunstein, K. E., Ling, J. P., Troncoso, J. C., Wong, P. C., et al. (2024) · Figshare · doi:10.6084/m9.figshare.26555702
Kim, D. W., Tu, K. J., Wei, A., Lau, A., Gonzalez-Gil, A., Cao, T., Braunstein, K. E., Ling, J. P., Troncoso, J. C., Wong, P. C., et al. (2024) · Figshare · doi:10.6084/m9.figshare.26555681
Kim, D. W., Tu, K. J., Wei, A., Lau, A., Gonzalez-Gil, A., Cao, T., Braunstein, K. E., Ling, J. P., Troncoso, J. C., Wong, P. C., et al. (2024) · Figshare · doi:10.6084/m9.figshare.26555672
Kim, D. W., Tu, K. J., Wei, A., Lau, A., Gonzalez-Gil, A., Cao, T., Braunstein, K. E., Ling, J. P., Troncoso, J. C., Wong, P. C., et al. (2024) · Figshare · doi:10.6084/m9.figshare.26555708
Kim, D. W., Tu, K. J., Wei, A., Lau, A., Gonzalez-Gil, A., Cao, T., Braunstein, K. E., Ling, J. P., Troncoso, J. C., Wong, P. C., et al. (2024) · Figshare · doi:10.6084/m9.figshare.26555675
Kim, D. W., Tu, K. J., Wei, A., Lau, A., Gonzalez-Gil, A., Cao, T., Braunstein, K. E., Ling, J. P., Troncoso, J. C., Wong, P. C., et al. (2024) · Figshare · doi:10.6084/m9.figshare.26555678
Emre, C., Khanh, V., Jun, B., Hjorth, E., Alcalde, S. G., Kautzmann, M.-A. I., Gordon, W. C., Nilsson, P., Ng, B., & Schultzberg, M. (2021) · Figshare · doi:10.6084/m9.figshare.14880551
Shi, H., Yin, Z., Koronyo, Y., Fuchs, D.-T., Sheyn, J., Davis, M. R., Wilson, J. W., Margeta, M. A., Pitts, K. M., Herron, S., et al. (2022) · Figshare · doi:10.6084/m9.figshare.21069636
Kim, D. W., Tu, K. J., Wei, A., Lau, A., Gonzalez-Gil, A., Cao, T., Braunstein, K. E., Ling, J. P., Troncoso, J. C., Wong, P. C., et al. (2024) · Figshare · doi:10.6084/m9.figshare.26555699
Kim, D. W., Tu, K. J., Wei, A., Lau, A., Gonzalez-Gil, A., Cao, T., Braunstein, K. E., Ling, J. P., Troncoso, J. C., Wong, P. C., et al. (2024) · Figshare · doi:10.6084/m9.figshare.26555723
Kim, D. W., Tu, K. J., Wei, A., Lau, A., Gonzalez-Gil, A., Cao, T., Braunstein, K. E., Ling, J. P., Troncoso, J. C., Wong, P. C., et al. (2024) · Figshare · doi:10.6084/m9.figshare.26555705
Kim, D. W., Tu, K. J., Wei, A., Lau, A., Gonzalez-Gil, A., Cao, T., Braunstein, K. E., Ling, J. P., Troncoso, J. C., Wong, P. C., et al. (2024) · Figshare · doi:10.6084/m9.figshare.26555711
Liu, L., Zhen, J., Liu, S., Ren, L., Zhao, G., Liang, J., Xu, A., Li, C., Wu, J., & Cheung, B. M. Y. (2024) · Figshare · doi:10.6084/m9.figshare.26721495
Guo, Z., Zeng, Z., Ma, X., Jing, S.-S., Wu, Y., Shan, B., Pan, H., Shi, Y., Liu, A., Jiang, H., et al. (2026) · PeerJ · doi:10.7717/peerj.20988
In vivo PET imaging of galectins
Hao, Y., Han, S., Song, R., Zhang, W., & Liu, Z. (2026) · Journal of Nuclear Medicine and Molecular Imaging · doi:10.65457/jnmmi-2026-0004
Chronic pain in Alzheimer disease and the role of neuroimmune interactions
Malcangio, M., & Sideris-Lampretsas, G. (2026) · Pharmacological Reviews · doi:10.1016/j.pharmr.2026.100149
Zhou, Y., Diao, Y., Yan, Z., Shui, X., Huang, Z., Sun, Y., Wang, S. W., Xia, Y., Lee, T. H., & Wang, L. (2026) · Biomolecules · doi:10.3390/biom16081075
Activation and increased hippocampal GPR55 prevents cognitive deficits in male APP/PS1 mice
Liang, Y., Zhi, T., Fan, B., Wu, Y., Wu, L., Xie, Z., Yang, Y., Mu, R., & Wu, X. (2026) · Neuropharmacology · doi:10.1016/j.neuropharm.2026.111129
Wang, Q., Luo, H., Fan, F., Zhao, Z., Liu, D., Liao, L., & Bai, S. (2026) · BMC Neuroscience · doi:10.1186/s12868-026-01048-9
Galectin-3 and its inhibitors: Overview and perspectives
Liu, S., Wu, S., He, F., & Ding, K. (2026) · Pharmacology & Therapeutics · doi:10.1016/j.pharmthera.2026.109125
Impelman, K., & An, Z. (2026) · npj Dementia · doi:10.1038/s44400-026-00152-1
BindingDB (2023) · UC San Diego · doi:10.7270/q2fx7fkm
Metadata
- Authors
- Tao, C.-C., Cheng, K.-M., Ma, Y.-L., Hsu, W.-L., Chen, Y.-C., Fuh, J.-L., Lee, W.-J., Chao, C.-C., & Lee, E. H. Y.
- Affiliations
- Institute of Biomedical Sciences, Academia Sinica (TW)
- Taipei Veterans General Hospital (TW)
- Taichung Veterans General Hospital (TW)
- National Chengchi University (TW)
- Corresponding author
- Lee, Eminy H. Y.
- ORCID
- Venue
- Cell Death & Differentiation
- Published
- 2019-05-24
- Volume
- 27
- Issue
- 1
- Pages
- 192-209
- ISSN
- 1350-9047 (ISSN-L)
- 1476-5403
- PMC
- PMC7206130
- OpenAlex
- W2944988109
- Cited by
- 138
- References
- 51
- Citations by year
- 2026: 12 · 2025: 21 · 2024: 32 · 2023: 13 · 2022: 30 · 2021: 20 · 2020: 9 · 2019: 1
- FWCI
- 10.46
- Type
- journal article
- Language
- en
- Open access
- hybrid
- doi.org
- Locations
- Cell Death and Differentiation (publishedVersion, cc-by)
- PubMed Central (publishedVersion, cc-by)
- PubMed (publishedVersion)
- Funders
- Ministry of Science and Technology, Taiwan (MOST 106-2320-B-001-005-MY3)
- Institute of Biomedical Sciences, Academia Sinica, Taiwan
- Topics
- Life Sciences › Neuroscience › Cellular and Molecular Neuroscience › Alzheimer's disease research and treatments
- Life Sciences › Neuroscience › Neurology › Neuroinflammation and Neurodegeneration Mechanisms
- Life Sciences › Immunology and Microbiology › Immunology › Galectins and Cancer Biology
- Keywords
- amyloid-beta oligomers, Alzheimer's disease, amyloid-beta toxicity, microglia, TREM2, neprilysin, APP/PS1 mice, amyloid plaques, hippocampus, integrin signaling, galectin-3 knockout mice, cognitive impairment, therapeutic target
- MeSH terms
- Age Factors, Alzheimer Disease, Animals, Blood Proteins, Calcium-Binding Proteins, Disease Models, Animal, Female, Glial Fibrillary Acidic Protein, Hippocampus, Male, Memory, Mice, Transgenic, Microfilament Proteins, Peptide Fragments, Neprilysin, Signal Transduction, Integrins, Amyloid beta-Peptides, Rats, Sprague-Dawley, Mice, Knockout, Galectins, Galectin 3, Mice, Plaque, Amyloid, Amyloidogenic Proteins
About these checks
Registry, retraction, Cites and statistics results are computed, not judged, with one exception: a printed reference that no index lists is read once by a model before it counts as a citation error. Claims are extracted by a model and kept only when their quote appears verbatim in the text; each cited source is then checked, with a model’s help, for whether it says what the claim relies on. Those verdicts can be wrong — read the claim’s quote and the cited source before relying on one.
Statistics and arithmetic are recomputed, not judged.
Confidence bands are shown only for fields calibrated on our annotated test set. None is calibrated yet, so no band is shown.
What counts as a claim ›How we measure confidence ›How we check this ›
Are you an author, or do you see a problem with this page? Request a review
