Cited by 16

The DOI matches its Crossref record; 5 of the 5 references it cites were found in a registry or an index.

Cerebral endothelial cell-derived extracellular vesicles regulate microglial polarization and promote autophagy via delivery of miR-672-5p

Wang, Changshui, Feng, Lei, Zhu, Li, Wu, Linlin, Chen, Beibei, Cui, Changmeng, Yang, Mengqi, Gao, Yahao, Jiang, Pei·2023·Cell Death & Disease

Abstract

The interaction between cerebral endothelial cells (CEC) and brain parenchymal cells is critical to maintain neurovascular homeostasis, whereas extracellular vesicles (EVs) are essential to mediate the cell–cell communication. Previous researches demonstrated that CEC-derived EVs (CEC-EVs) confer neuroprotective actions. However, the molecular mechanisms remain unknown. In this study, we isolated EVs from CEC and assessed their immune-regulatory actions in microglial cells and mice following lipopolysaccharide (LPS) exposure. We found that CEC-EVs treatment significantly ameliorated LPS-induced inflammatory activation, shifting microglial polarization from pro-inflammatory phenotype to anti-inflammatory phenotype. Meanwhile, microglial cells can effectively internalize CEC-EVs and this process was further enhanced by immune activation. Next, the miRNA microarray analysis revealed that CEC-EVs increased expression of miR-672-5p, which was demonstrated to be the cargo of CEC-EVs. TGFβ-activated kinase 1 (TAK1)-binding proteins 2 (TAB2) was identified to be the target of miR-672-5p. Through inhibiting TAB2, miR-672-5p derived from CEC-EVs suppressed TAK1-TAB signaling and thereby mitigating the downstream NF-κB activation. Furthermore, we found that by delivering miR-672-5p, CEC-EVs promoted autophagy and hence stimulating autophagic degradation of NLRP3 inflammasome. Our work firstly revealed the neuroimmune-modulating actions of CEC-EVs and further demonstrated that miR-672-5p secreted from CEC-EVs inhibits microglial pro-inflammatory polarization and facilitates autophagic process via targeting TAB2.

Overview

The claims and statistics of this paper haven’t been checked yet.

Run the check — free, no account needed. It reads the open-access text and checks the sources it cites.

A few free checks a day · papers already verified open instantly · results are public

Integrity signals

Registry

Crossref · 10.1038/s41419-023-06173-5

Cites

5 of 5 references verified0 citation errors · 0 not checkable

Statistics

Figures

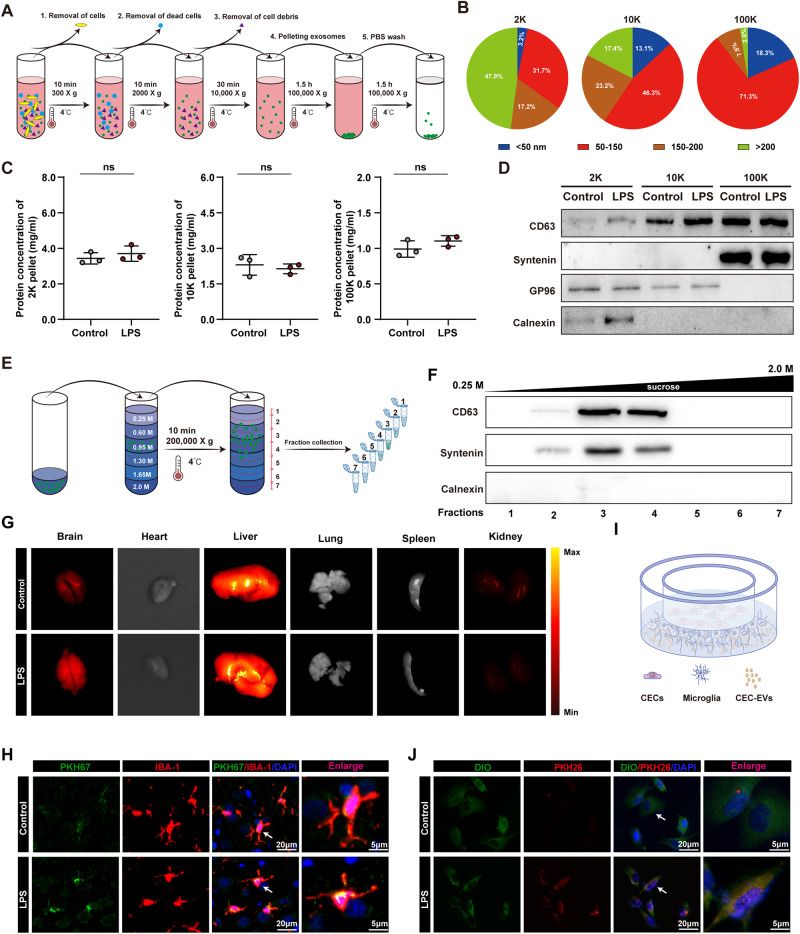
Fig. 1 LPS treatment had no effect on EVs release in CECs but increased microglial uptake of CEC-EVs. A Schematic diagram of EVs isolation from conditioned media. B Size distribution of EVs in 2 K, 10 K and 100 K pellets. C Total protein concentrations of 2 K, 10 K and 100 K pellets derived from control group and LPS group. D 2 K, 10 K and 100 K pellets were blotted for the exosomal markers CD63 and syntenin, and for the endoplasmic reticulum marker GP96 and Calnexin. E Flow charts for the EVs purification procedure based on sucrose density gradient centrifugation. F Western blot for exosomal markers CD63, syntenin and Calnexin in different sucrose gradient fractions. G Representative imaging distribution of the DiR-labeled CEC-EVs in different organs, including brain, heart, liver, spleen, lung, and kidney. H CEC-EVs can cross the blood-brain barrier and neuroinflammatory markedly enhanced the incorporation of CEC-EVs into microglia. I Transwell co-culture system. J LPS treatment increased microglial uptake of CEC-EVs. The lipid membrane of CECs was stained with PKH26 red fluorescent dye and the cells were co-cultured with BV2 microglial cells stained with DIO in a Transwell. All data are present as means ± SD (n = 3). Unpaired Student’s t- test. ns not significant.
Fig. 1 LPS treatment had no effect on EVs release in CECs but increased microglial uptake of CEC-EVs. A Schematic diagram of EVs isolation from conditioned media. B Size distribution of EVs in 2 K, 10 K and 100 K pellets. C Total protein concentrations of 2 K, 10 K and 100 K pellets derived from control group and LPS group. D 2 K, 10 K and 100 K pellets were blotted for the exosomal markers CD63 and syntenin, and for the endoplasmic reticulum marker GP96 and Calnexin. E Flow charts for the EVs purification procedure based on sucrose density gradient centrifugation. F Western blot for exosomal markers CD63, syntenin and Calnexin in different sucrose gradient fractions. G Representative imaging distribution of the DiR-labeled CEC-EVs in different organs, including brain, heart, liver, spleen, lung, and kidney. H CEC-EVs can cross the blood-brain barrier and neuroinflammatory markedly enhanced the incorporation of CEC-EVs into microglia. I Transwell co-culture system. J LPS treatment increased microglial uptake of CEC-EVs. The lipid membrane of CECs was stained with PKH26 red fluorescent dye and the cells were co-cultured with BV2 microglial cells stained with DIO in a Transwell. All data are present as means ± SD (n = 3). Unpaired Student’s t- test. ns not significant.CC BY · PubMed Central
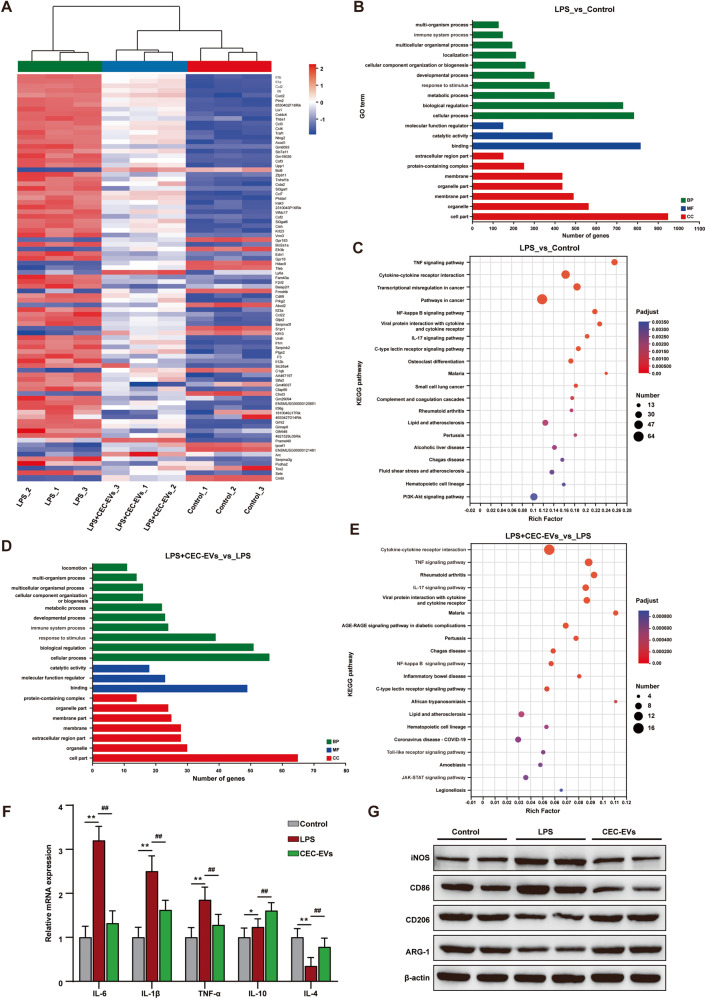
Fig. 2 Effect of CEC-EVs on immune responses in microglia. A Heatmap visualization of the expression levels of the differentially expressed genes (DEGs). The colors indicate the expression level, ranging from red (high expression level) to blue (low expression level). The annotation of GO functions (B) and Kyoto Encyclopedia of Genes and Genome (KEGG) (C) pathway analysis of DEGs from microglia after LPS treatment. The annotation of GO functions (D) and KEGG (E) pathway analysis of DEGs from microglia after CEC-EVs treatment. F CEC-EVs alleviates LPS-induced microglial inflammatory responses. One-way ANOVA. G The expression of microglial pro-inflammatory marker (iNOS and CD86) and anti-inflammatory marker (CD206, ARG-1) were examined by western blot. All data are present as means ± SD (n = 3). *p < 0.05, **p < 0.01 compared to control group. ##p < 0.01 compared to LPS group.
Fig. 2 Effect of CEC-EVs on immune responses in microglia. A Heatmap visualization of the expression levels of the differentially expressed genes (DEGs). The colors indicate the expression level, ranging from red (high expression level) to blue (low expression level). The annotation of GO functions (B) and Kyoto Encyclopedia of Genes and Genome (KEGG) (C) pathway analysis of DEGs from microglia after LPS treatment. The annotation of GO functions (D) and KEGG (E) pathway analysis of DEGs from microglia after CEC-EVs treatment. F CEC-EVs alleviates LPS-induced microglial inflammatory responses. One-way ANOVA. G The expression of microglial pro-inflammatory marker (iNOS and CD86) and anti-inflammatory marker (CD206, ARG-1) were examined by western blot. All data are present as means ± SD (n = 3). *p < 0.05, **p < 0.01 compared to control group. ##p < 0.01 compared to LPS group.CC BY · PubMed Central
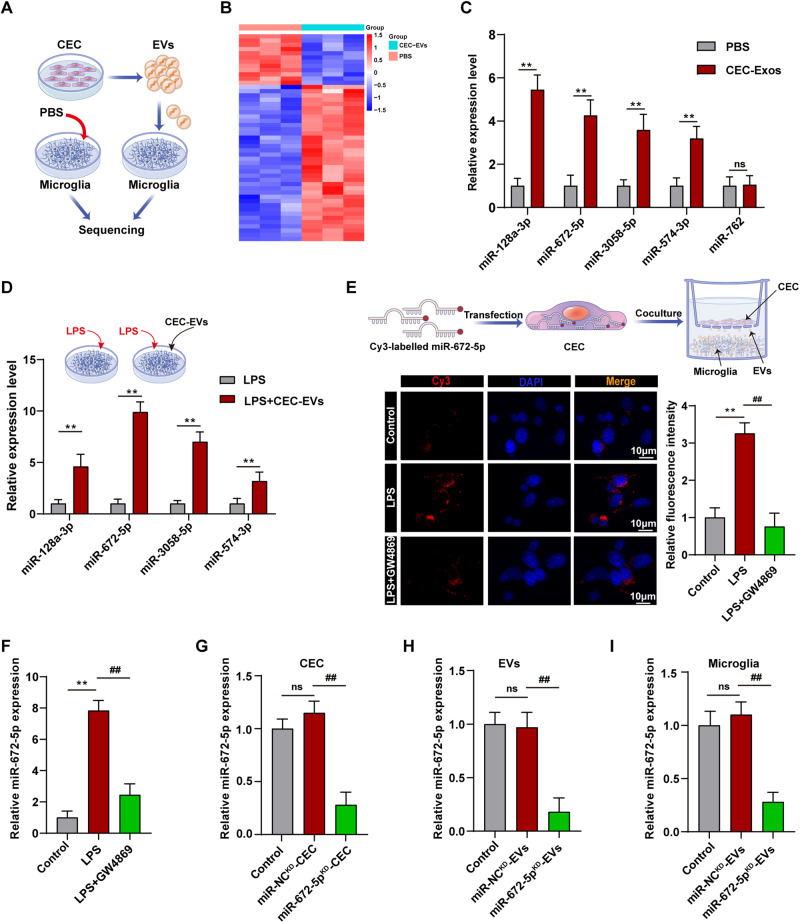
Fig. 3 miR-672-5p was transferred from CECs to microglia. A The schematic diagram of microglia sequencing analysis after CEC-EVs treatment. B The heat map plot of the upregulated and downregulated miRNAs between microglia treated with CEC-EVs and PBS. C Validation of upregulated genes by qRT-PCR. Unpaired Student’s t test. D qRT-PCR was used to explore the expression of miRNAs including miR-128-3p, miR-672-5p, miR-3058-5p, miR-574-3p and miR-762 in activated microglia treated with EVs. Unpaired Student’s t test. E The EVs secretion inhibitor, GW4869, inhibited miR-672-5p transfer from CECs to microglia. one-way ANOVA. F Inhibition effect of GW4869 on miR-672-5p transfer was determined by qRT-PCR. One-way ANOVA. G miR-672-5p knockdown in CECs and the knockdown efficiency was confirmed by qRT-PCR, one-way ANOVA. Effect of miR-672-5p knockdown in CECs on miR-672-5p expression in CEC-EVs (H) and microglia (I), respectively, one-way ANOVA. All data are present as means ± SD (n = 3). ns not significant, **p < 0.01 compared to control group. ##p < 0.01 compared to miR-NCKD-CEC or miR-NCKD-EVs group.
Fig. 3 miR-672-5p was transferred from CECs to microglia. A The schematic diagram of microglia sequencing analysis after CEC-EVs treatment. B The heat map plot of the upregulated and downregulated miRNAs between microglia treated with CEC-EVs and PBS. C Validation of upregulated genes by qRT-PCR. Unpaired Student’s t test. D qRT-PCR was used to explore the expression of miRNAs including miR-128-3p, miR-672-5p, miR-3058-5p, miR-574-3p and miR-762 in activated microglia treated with EVs. Unpaired Student’s t test. E The EVs secretion inhibitor, GW4869, inhibited miR-672-5p transfer from CECs to microglia. one-way ANOVA. F Inhibition effect of GW4869 on miR-672-5p transfer was determined by qRT-PCR. One-way ANOVA. G miR-672-5p knockdown in CECs and the knockdown efficiency was confirmed by qRT-PCR, one-way ANOVA. Effect of miR-672-5p knockdown in CECs on miR-672-5p expression in CEC-EVs (H) and microglia (I), respectively, one-way ANOVA. All data are present as means ± SD (n = 3). ns not significant, **p < 0.01 compared to control group. ##p < 0.01 compared to miR-NCKD-CEC or miR-NCKD-EVs group.CC BY · PubMed Central
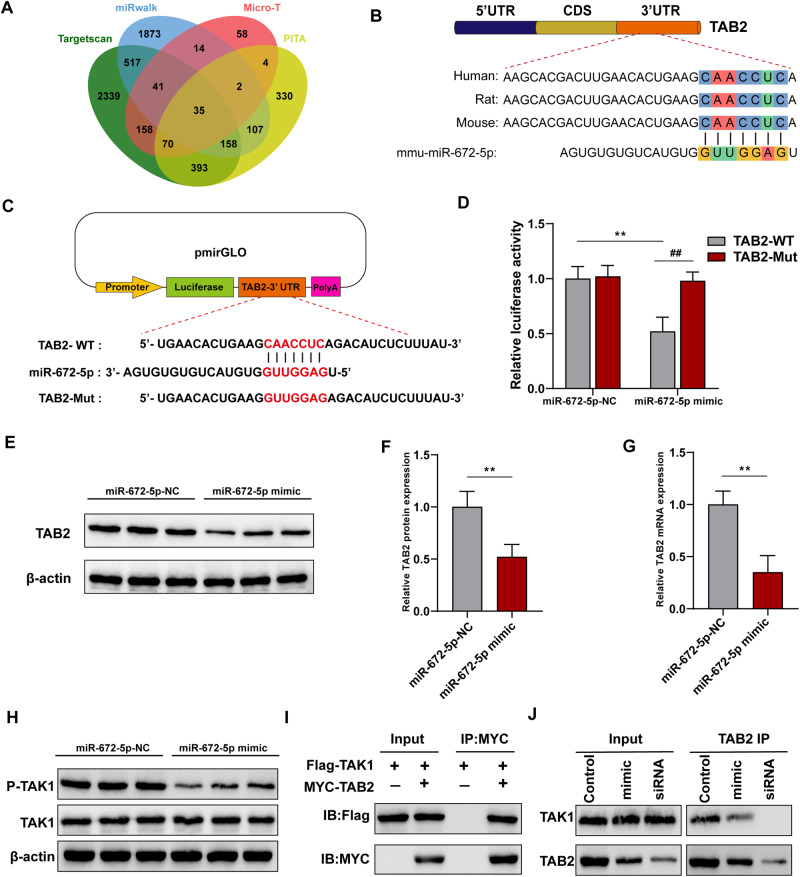
Fig. 4 miR-672-5p negatively regulated TAB2 expression and inhibited the interaction between TAB2 and TAK1. A Candidate gene targets were predicted by intersecting outputs from four distinct prediction software programs (TargetScan, miRWalk, micro-T, and PITA). B miR-672-5p targets the 3′-UTR of TAB2 with a high conservation. C, D Luciferase activity of the wild-type (TAB2-WT) or mutant (TAB2-Mut) TAB2 3’UTR reporter gene transfected with the miR-672-5p mimics or miR-672-5p-NC (negative control). one-way ANOVA. Effect of the transfection of miR-672-5p mimics on expression level of TAB2 protein (E, F) and mRNA (G). Unpaired Student’s t test. H Effect of the transfection of miR-672-5p mimics on protein expression level of TAK1 and its phosphorylation. I Co-immunoprecipitation (Co-IP) experiments were performed with anti-MYC antibody on microglia cell expressing Flag-TAK1 and MYC-TAB2. J Transfection of miR-672-5p mimics or knockdown TAB2 attenuated the interaction between TAB2 and TAK1. All data are present as means ± SD (n = 3). **p < 0.01 compared to TAB2-WT in miR-672-5p-NC treatment group or miR-672-5p-NC group. ##p < 0.01 compared to TAB2-WT group in miR-672-5p mimic treatment group.
Fig. 4 miR-672-5p negatively regulated TAB2 expression and inhibited the interaction between TAB2 and TAK1. A Candidate gene targets were predicted by intersecting outputs from four distinct prediction software programs (TargetScan, miRWalk, micro-T, and PITA). B miR-672-5p targets the 3′-UTR of TAB2 with a high conservation. C, D Luciferase activity of the wild-type (TAB2-WT) or mutant (TAB2-Mut) TAB2 3’UTR reporter gene transfected with the miR-672-5p mimics or miR-672-5p-NC (negative control). one-way ANOVA. Effect of the transfection of miR-672-5p mimics on expression level of TAB2 protein (E, F) and mRNA (G). Unpaired Student’s t test. H Effect of the transfection of miR-672-5p mimics on protein expression level of TAK1 and its phosphorylation. I Co-immunoprecipitation (Co-IP) experiments were performed with anti-MYC antibody on microglia cell expressing Flag-TAK1 and MYC-TAB2. J Transfection of miR-672-5p mimics or knockdown TAB2 attenuated the interaction between TAB2 and TAK1. All data are present as means ± SD (n = 3). **p < 0.01 compared to TAB2-WT in miR-672-5p-NC treatment group or miR-672-5p-NC group. ##p < 0.01 compared to TAB2-WT group in miR-672-5p mimic treatment group.CC BY · PubMed Central
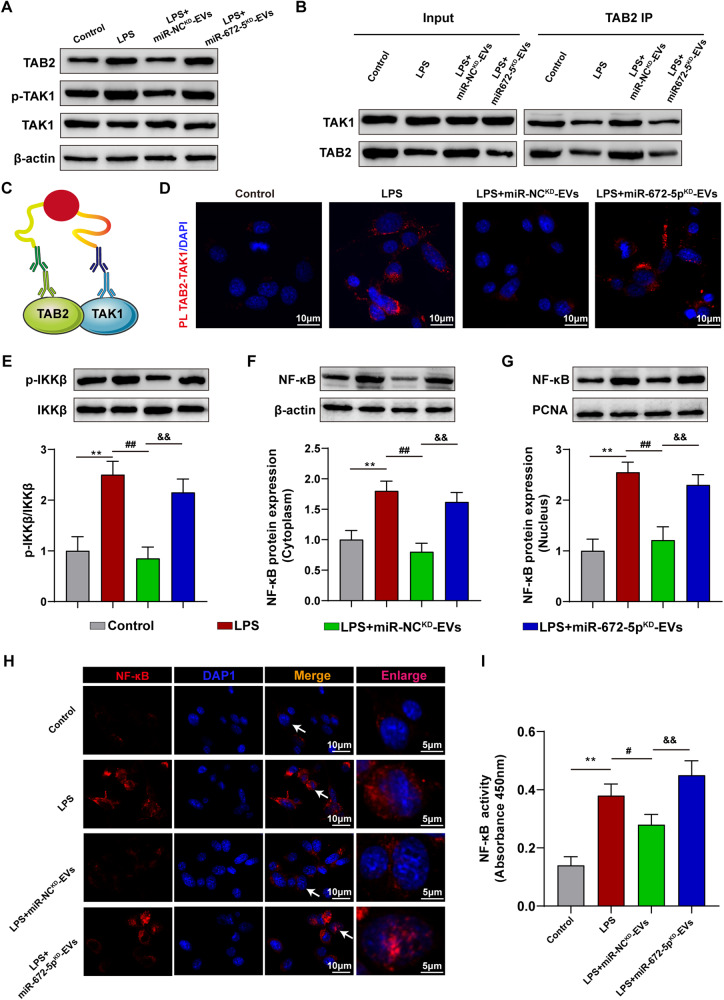
Fig. 5 CEC-EVs-derived miR-672-5p regulated interaction between TAB2 and TAK1 and suppressed NFκB activation in microglia. A Effect of the CEC-EVs-derived miR-672-5p on protein expression level of TAB2, TAK1 and p-TAK1. B CEC-EVs-derived miR-672-5p attenuated the interaction between TAB2 and TAK1. C Schematic diagram of the of in situ proximity ligation assay (PLA) in microglia cells of TAB2 and TAK1. D PLA confirms that CEC-EVs-derived miR-672-5p inhibited the interaction between TAB2 and TAK1. CEC-EVs-derived miR-672-5p promoted the protein expression of p-IKKβ (E) and NFκB (F, G) nuclear translocation. H Representative images of immunofluorescence assays of NFκB in vitro. I CEC-EVs-derived miR-672-5p suppressed the activity of NFκB. All data are present as means ± SD (n = 3). One-way ANOVA. **p < 0.01 compared to Control group. #p < 0.05, ##p < 0.01 compared to LPS group. &&p < 0.01 compared to LPS + miR-NCKD-EVs group.
Fig. 5 CEC-EVs-derived miR-672-5p regulated interaction between TAB2 and TAK1 and suppressed NFκB activation in microglia. A Effect of the CEC-EVs-derived miR-672-5p on protein expression level of TAB2, TAK1 and p-TAK1. B CEC-EVs-derived miR-672-5p attenuated the interaction between TAB2 and TAK1. C Schematic diagram of the of in situ proximity ligation assay (PLA) in microglia cells of TAB2 and TAK1. D PLA confirms that CEC-EVs-derived miR-672-5p inhibited the interaction between TAB2 and TAK1. CEC-EVs-derived miR-672-5p promoted the protein expression of p-IKKβ (E) and NFκB (F, G) nuclear translocation. H Representative images of immunofluorescence assays of NFκB in vitro. I CEC-EVs-derived miR-672-5p suppressed the activity of NFκB. All data are present as means ± SD (n = 3). One-way ANOVA. **p < 0.01 compared to Control group. #p < 0.05, ##p < 0.01 compared to LPS group. &&p < 0.01 compared to LPS + miR-NCKD-EVs group.CC BY · PubMed Central
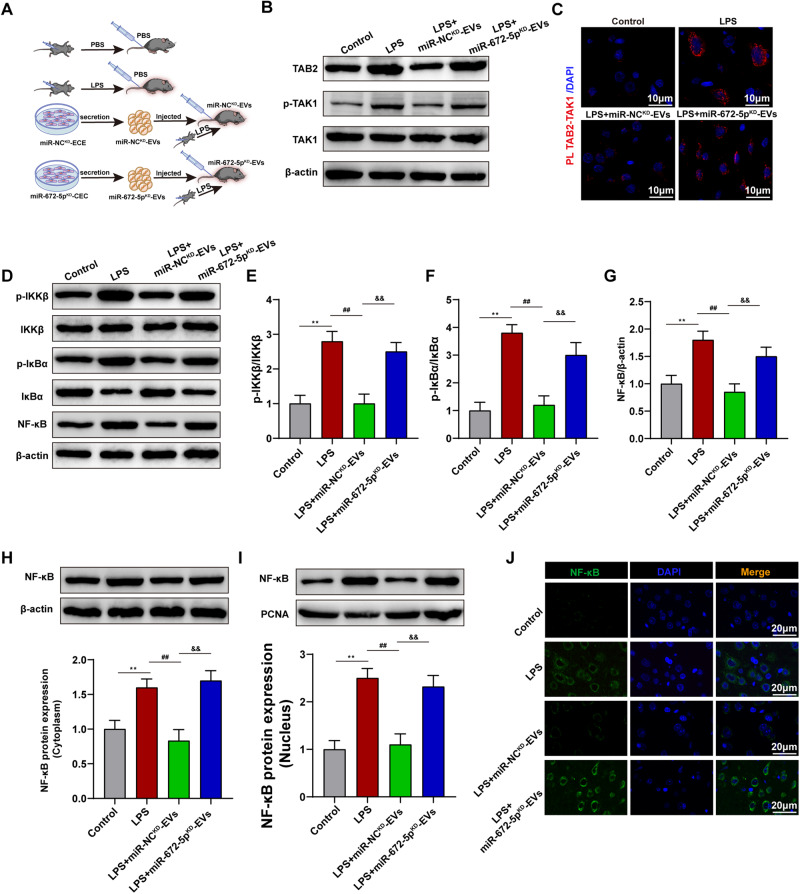
Fig. 6 CEC-EVs-derived miR-672-5p regulated interaction between TAB2 and TAK1 and suppressed NFκB activation in vivo. A Schematic diagram of the of CEC-EVs in vivo experimental study. B Effect of the CEC-EVs-derived miR-672-5p on protein expression level of TAB2, TAK1 and p-TAK1 in vivo. C PLA confirms that CEC-EVs-derived miR-672-5p inhibited the interaction between TAB2 and TAK1. D Representative western blots of p-IKKβ, IKKβ, p-IκBα, IκBα, NFκB. Statistical graphs of protein expression of p-IKKβ (E), p-IκBα (F), NFκB (G). H, I CEC-EVs-derived miR-672-5p promoted NFκB nuclear translocation. J Representative images of immunofluorescence assays of NFκB in vivo. All data are present as means ± SD (n = 6). One-way ANOVA. **p < 0.01 compared to Control group. ##p < 0.01 compared to LPS group. &&p < 0.01 compared to LPS + miR-NCKD-EVs group.
Fig. 6 CEC-EVs-derived miR-672-5p regulated interaction between TAB2 and TAK1 and suppressed NFκB activation in vivo. A Schematic diagram of the of CEC-EVs in vivo experimental study. B Effect of the CEC-EVs-derived miR-672-5p on protein expression level of TAB2, TAK1 and p-TAK1 in vivo. C PLA confirms that CEC-EVs-derived miR-672-5p inhibited the interaction between TAB2 and TAK1. D Representative western blots of p-IKKβ, IKKβ, p-IκBα, IκBα, NFκB. Statistical graphs of protein expression of p-IKKβ (E), p-IκBα (F), NFκB (G). H, I CEC-EVs-derived miR-672-5p promoted NFκB nuclear translocation. J Representative images of immunofluorescence assays of NFκB in vivo. All data are present as means ± SD (n = 6). One-way ANOVA. **p < 0.01 compared to Control group. ##p < 0.01 compared to LPS group. &&p < 0.01 compared to LPS + miR-NCKD-EVs group.CC BY · PubMed Central
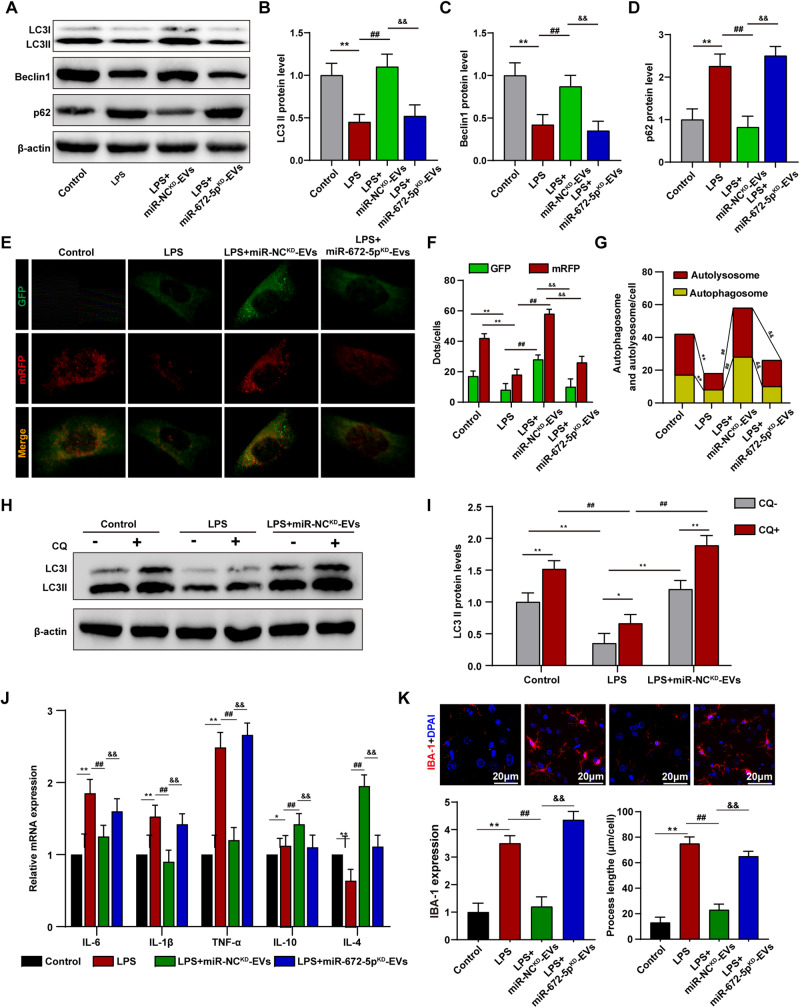
Fig. 7 CEC-EVs-derived miR-672-5p promoted autophagy and suppressed NLRP3 inflammasome activation. A CEC-EVs-derived miR-672-5p enhances LC3II, Beclin1 level and decreases SQSTM1/p62 expression. B–D Statistical graphs of protein expression of LC3II, Beclin1 and SQSTM1/p62. E Immunofluorescence staining of microglial cells transfected with mRFP-GFP-LC3 adenovirus. F, G Calculated numbers of autophagosome (GFP+ RFP+ yellow puncta) and autolysosome (red puncta) numbers. All data are present as means ± SD (n = 3). One-way ANOVA. **p < 0.01 compared to Control group. ##p < 0.01 compared to LPS group. &&p < 0.01 compared to LPS + miR-NCKD-EVs group. H, I Chloroquine (CQ) was used to evaluate the effects of CEC-EVs treatment or LPS treatment on LC3II. CEC-EVs-derived miR-672-5p alleviates LPS-induced microglial inflammatory responses (J) and activation (K). All data are present as means ± SD (n = 6). One-way ANOVA. *p < 0.05, **p < 0.01 compared to CQ− group. ##p < 0.01 compared to CQ+ group.
Fig. 7 CEC-EVs-derived miR-672-5p promoted autophagy and suppressed NLRP3 inflammasome activation. A CEC-EVs-derived miR-672-5p enhances LC3II, Beclin1 level and decreases SQSTM1/p62 expression. B–D Statistical graphs of protein expression of LC3II, Beclin1 and SQSTM1/p62. E Immunofluorescence staining of microglial cells transfected with mRFP-GFP-LC3 adenovirus. F, G Calculated numbers of autophagosome (GFP+ RFP+ yellow puncta) and autolysosome (red puncta) numbers. All data are present as means ± SD (n = 3). One-way ANOVA. **p < 0.01 compared to Control group. ##p < 0.01 compared to LPS group. &&p < 0.01 compared to LPS + miR-NCKD-EVs group. H, I Chloroquine (CQ) was used to evaluate the effects of CEC-EVs treatment or LPS treatment on LC3II. CEC-EVs-derived miR-672-5p alleviates LPS-induced microglial inflammatory responses (J) and activation (K). All data are present as means ± SD (n = 6). One-way ANOVA. *p < 0.05, **p < 0.01 compared to CQ− group. ##p < 0.01 compared to CQ+ group.CC BY · PubMed Central
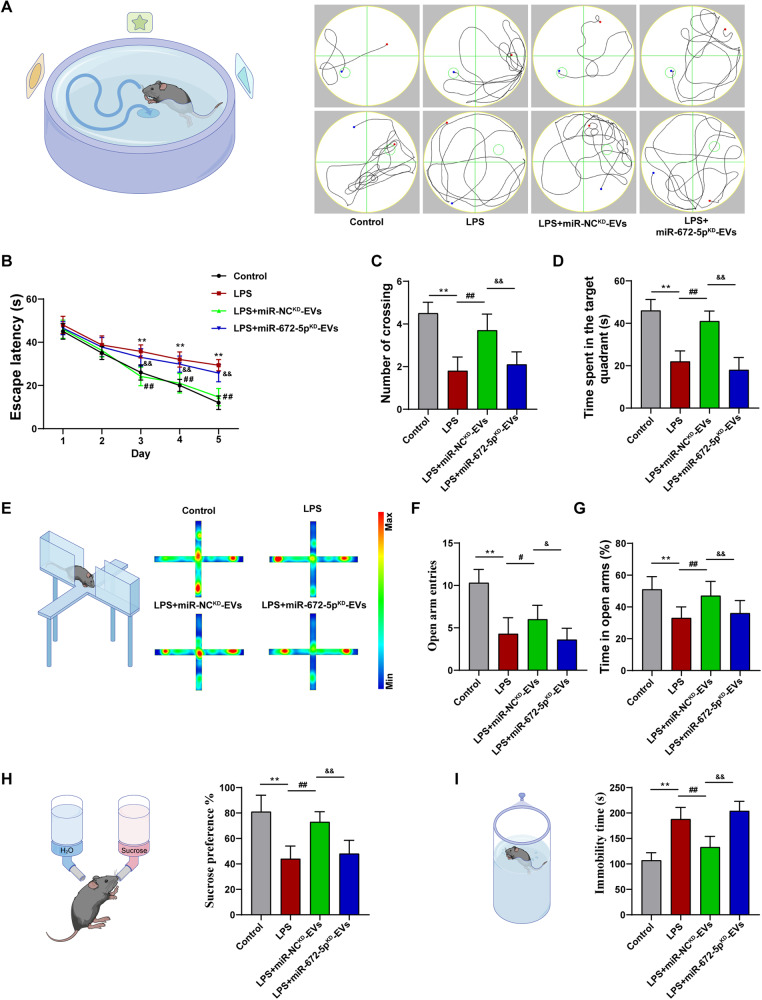
Fig. 8 The neuroprotective effects of CEC-EVs in LPS-induced behavioral deficits in mice. A Representative traces indicating the paths of the mice in the space exploration and orientation navigation test. B CEC-EVs treatment reduced the time spent to find the submerged platform. CEC-EVs treatment enhanced the number of crossing (C) and reduced the time spent on exploring the quadrant that initially contained the platform (D). E Representative heat maps showing EPM results. CEC-EVs treatment increased number of open arm entries (F) and time spent in the open arm of the EPM test (G). H CEC-EVs treatment increased sucrose preference in the SPT. I CEC-EVs treatment decreased immobility time in the FST. All data are present as means ± SD (n = 12). One-way ANOVA. **p < 0.01 compared to Control group. #p < 0.05, ##p < 0.01 compared to LPS group. &p < 0.05, &&p < 0.01 compared to LPS + miR-NCKD-EVs group.
Fig. 8 The neuroprotective effects of CEC-EVs in LPS-induced behavioral deficits in mice. A Representative traces indicating the paths of the mice in the space exploration and orientation navigation test. B CEC-EVs treatment reduced the time spent to find the submerged platform. CEC-EVs treatment enhanced the number of crossing (C) and reduced the time spent on exploring the quadrant that initially contained the platform (D). E Representative heat maps showing EPM results. CEC-EVs treatment increased number of open arm entries (F) and time spent in the open arm of the EPM test (G). H CEC-EVs treatment increased sucrose preference in the SPT. I CEC-EVs treatment decreased immobility time in the FST. All data are present as means ± SD (n = 12). One-way ANOVA. **p < 0.01 compared to Control group. #p < 0.05, ##p < 0.01 compared to LPS group. &p < 0.05, &&p < 0.01 compared to LPS + miR-NCKD-EVs group.CC BY · PubMed Central

Verification

Claims the paper makes

The claims and statistics of this paper haven’t been checked yet.

Run the check — free, no account needed. It reads the open-access text and checks the sources it cites.

A few free checks a day · papers already verified open instantly · results are public

Claims other papers make about this one

Each is checked against this paper’s own text: does it say what the citing paper says it does?

Self-check

Percentages, sums and reported differences re-computed from the paper’s own numbers.

The self-check needs the paper’s full text.

Citations

Cites

Research works printed but not linked: 48

  1. Guzman-Martinez L, Maccioni RB, Andrade V, Navarrete LP, Pastor MG, Ramos-Escobar N. Neuroinflammation as a common feature of neurodegenerative disorders. Front Pharmacol. 2019;10:1008. · DOI · Paper page
  2. Tian L, Ma L, Kaarela T, Li Z. Neuroimmune crosstalk in the central nervous system and its significance for neurological diseases. J Neuroinflammation. 2012;9:155. · DOI
  3. Shen Y, Kapfhamer D, Minnella AM, Kim JE, Won SJ, Chen Y, et al. Bioenergetic state regulates innate inflammatory responses through the transcriptional co-repressor CtBP. Nat Commun. 2017;8:624. · DOI
  4. Ormel PR, Vieira de Sá R, van Bodegraven EJ, Karst H, Harschnitz O, Sneeboer MAM, et al. Microglia innately develop within cerebral organoids. Nat Commun. 2018;9:4167. · DOI
  5. Borst K, Dumas AA, Prinz M. Microglia: Immune and non-immune functions. Immunity. 2021;54:2194–208. · DOI · Paper page
  6. Ransohoff RM. A polarizing question: do M1 and M2 microglia exist? Nat Neurosci. 2016;19:987–91. · DOI · Paper page
  7. Nguyen HM, di Lucente J, Chen YJ, Cui Y, Ibrahim RH, Pennington MW, et al. Biophysical basis for Kv1.3 regulation of membrane potential changes induced by P2X4-mediated calcium entry in microglia. Glia. 2020;68:2377–94. · DOI
  8. Kisler K, Nelson AR, Rege SV, Ramanathan A, Wang Y, Ahuja A, et al. Pericyte degeneration leads to neurovascular uncoupling and limits oxygen supply to brain. Nat Neurosci. 2017;20:406–16. · DOI · Paper page
  9. Nishihara H, Gastfriend BD, Soldati S, Perriot S, Mathias A, Sano Y, et al. Advancing human induced pluripotent stem cell-derived blood-brain barrier models for studying immune cell interactions. FASEB J. 2020;34:16693–715. · DOI
  10. Théry C, Witwer KW, Aikawa E, Alcaraz MJ, Anderson JD, Andriantsitohaina R, et al. Minimal information for studies of extracellular vesicles 2018 (MISEV2018): a position statement of the International Society for Extracellular Vesicles and update of the MISEV2014 guidelines. J Extracell Vesicles. 2018;7:1535750. · DOI · Paper page
  11. Bhatt S, Kanoujia J, Dhar AK, Arumugam S, Silva AKA, Mishra N. Exosomes: a novel therapeutic paradigm for the treatment of depression. Curr Drug Targets 2021;22:183–91.
  12. Roig-Carles D, Willms E, Fontijn RD, Martinez-Pacheco S, Mäger I, de Vries HE, et al. Endothelial-derived extracellular vesicles induce cerebrovascular dysfunction in inflammation. Pharmaceutics. 2021;13:1525. · DOI
  13. Zhang Y, Qin Y, Chopp M, Li C, Kemper A, Liu X, et al. Ischemic cerebral endothelial cell-derived exosomes promote axonal growth. Stroke. 2020;51:3701–12. · DOI
  14. Pan J, He R, Huo Q, Shi Y, Zhao L. Brain microvascular endothelial cell derived exosomes potently ameliorate cognitive dysfunction by enhancing the clearance of Aβ through up-regulation of P-gp in mouse model of AD. Neurochem Res. 2020;45:2161–72. · DOI
  15. Gao B, Zhou S, Sun C, Cheng D, Zhang Y, Li X, et al. Brain endothelial cell-derived exosomes induce neuroplasticity in rats with ischemia/reperfusion injury. ACS Chem Neurosci. 2020;11:2201–13. · DOI
  16. Li P, Kaslan M, Lee SH, Yao J, Gao Z. Progress in exosome isolation techniques. Theranostics. 2017;7:789–804. · DOI
  17. Pais TF, Szegő ÉM, Marques O, Miller-Fleming L, Antas P, Guerreiro P, et al. The NAD-dependent deacetylase sirtuin 2 is a suppressor of microglial activation and brain inflammation. EMBO J. 2013;32:2603–16. · DOI
  18. Buglio D, Palakurthi S, Byth K, Vega F, Toader D, Saeh J, et al. Essential role of TAK1 in regulating mantle cell lymphoma survival. Blood. 2012;120:347–55. · DOI
  19. Bellet MM, Pieroni S, Castelli M, Piobbico D, Fallarino F, Romani L, et al. HOPS/Tmub1 involvement in the NF-kB-mediated inflammatory response through the modulation of TRAF6. Cell Death Dis 2020;11:865. · DOI
  20. Meng Y, Liu C, Shen L, Zhou M, Liu W, Kowolik C, et al. TRAF6 mediates human DNA2 polyubiquitination and nuclear localization to maintain nuclear genome integrity. Nucleic Acids Res. 2019;47:7564–79. · DOI
  21. du Toit A, Hofmeyr JS, Gniadek TJ, Loos B. Measuring autophagosome flux. Autophagy. 2018;14:1060–71.
  22. Liu W, Duan X, Fang X, Shang W, Tong C. Mitochondrial protein import regulates cytosolic protein homeostasis and neuronal integrity. Autophagy. 2018;14:1293–309. · DOI
  23. Wang H, Zhong P, Sun L. Exogenous hydrogen sulfide mitigates NLRP3 inflammasome-mediated inflammation through promoting autophagy via the AMPK-mTOR pathway. Biol Open. 2019;8:bio043653. · DOI
  24. Lizarraga-Valderrama LR, Sheridan GK. Extracellular vesicles and intercellular communication in the central nervous system. FEBS Lett. 2021;595:1391–410. · DOI · Paper page
  25. Wang S, Li F, Ye T, Wang J, Lyu C, Qing S, et al. Macrophage-tumor chimeric exosomes accumulate in lymph node and tumor to activate the immune response and the tumor microenvironment. Sci Transl Med. 2021;13:eabb6981. · DOI
  26. Gao K, Jin J, Huang C, Li J, Luo H, Li L, et al. Exosomes derived from septic mouse serum modulate immune responses via exosome-associated cytokines. Front Immunol. 2019;10:1560. · DOI
  27. Zhou Z, Li C, Bao T, Zhao X, Xiong W, Luo C, et al. Exosome-shuttled miR-672-5p from anti-inflammatory microglia repair traumatic spinal cord injury by inhibiting AIM2/ASC/Caspase-1 signaling pathway mediated neuronal pyroptosis. J Neurotrauma. 2022;39:1057–74. · DOI
  28. Liu T, Zhang L, Joo D, Sun SC. NF-κB signaling in inflammation. Signal Transduct Target Ther. 2017;2:17023. · DOI · Paper page
  29. Ren X, Cui J, Xu T, Sun Y. microRNA-128 inhibits the inflammatory responses by targeting TAB2 in miiuy croaker, Miichthysmiiuy. Dev Comp Immunol. 2021;117:103976. · DOI
  30. Orelio C, Dzierzak E. Expression analysis of the TAB2 protein in adult mouse tissues. Inflamm Res. 2007;56:98–104. · DOI
  31. Criollo A, Niso-Santano M, Malik SA, Michaud M, Morselli E, Mariño G, et al. Inhibition of autophagy by TAB2 and TAB3. EMBO J. 2011;30:4908–20. · DOI
  32. Mandell MA, Jain A, Arko-Mensah J, Chauhan S, Kimura T, Dinkins C, et al. TRIM proteins regulate autophagy and can target autophagic substrates by direct recognition. Dev cell. 2014;30:394–409. · DOI
  33. Zhao Y, Guo Q, Zhao K, Zhou Y, Li W, Pan C, et al. Small molecule GL-V9 protects against colitis-associated colorectal cancer by limiting NLRP3 inflammasome through autophagy. Oncoimmunology. 2017;7:e1375640. · DOI
  34. Haq S, Grondin J, Banskota S, Khan WI. Autophagy: roles in intestinal mucosal homeostasis and inflammation. J Biomed Sci. 2019;26:19. · DOI
  35. Dang R, Yang M, Cui C, Wang C, Zhang W, Geng C, et al. Activation of angiotensin-converting enzyme 2/angiotensin (1-7)/mas receptor axis triggers autophagy and suppresses microglia proinflammatory polarization via forkhead box class O1 signaling. Aging Cell. 2021;20:e13480. · DOI
  36. Yang Y, Yang C, Guo YF, Liu P, Guo S, Yang J, et al. MiR-142a-3p alleviates Escherichia coli derived lipopolysaccharide-induced acute lung injury by targeting TAB2. Microb Pathog. 2019;136:103721. · DOI
  37. Suleymanova EM. Behavioral comorbidities of epilepsy and neuroinflammation: evidence from experimental and clinical studies. Epilepsy Behav. 2021;117:107869. · DOI
  38. Moeendarbary E, Weber IP, Sheridan GK, Koser DE, Soleman S, Haenzi B, et al. The soft mechanical signature of glial scars in the central nervous system. Nat Commun. 2017;8:14787. · DOI
  39. Bernier LP, York EM, Kamyabi A, Choi HB, Weilinger NL, MacVicar BA. Microglial metabolic flexibility supports immune surveillance of the brain parenchyma. Nat Commun. 2020;11:1559. · DOI
  40. Nayak D, Roth TL, McGavern DB. Microglia development and function. Annu Rev Immunol. 2014;32:367–402. · DOI · Paper page
  41. O’Koren EG, Yu C, Klingeborn M, Wong AYW, Prigge CL, Mathew R, et al. Microglial function is distinct in different anatomical locations during retinal homeostasis and degeneration. Immunity. 2019;50:723–737.e7. · DOI · Paper page
  42. Grabert K, Michoel T, Karavolos MH, Clohisey S, Baillie JK, Stevens MP, et al. Microglial brain region-dependent diversity and selective regional sensitivities to aging. Nat Neurosci. 2016;19:504–16. · DOI · Paper page
  43. Li N, Wang Y, Xu H, Wang H, Gao Y, Zhang Y. Exosomes derived from RM-1 cells promote the recruitment of MDSCs into tumor microenvironment by upregulating CXCR4 via TLR2/NF-κB pathway. J Oncol. 2021;2021:5584406. · DOI
  44. Guo S, Kim WJ, Lok J, Lee SR, Besancon E, Luo BH, et al. Neuroprotection via matrix-trophic coupling between cerebral endothelial cells and neurons. Proc Natl Acad Sci USA. 2008;105:7582–7. · DOI · Paper page
  45. Bocchini V, Mazzolla R, Barluzzi R, Blasi E, Sick P, Kettenmann H. An immortalized cell line expresses properties of activated microglial cells. J Neurosci Res. 1992;31:616–21. · DOI
  46. Liu W, Yu M, Xie D, Wang L, Ye C, Zhu Q, et al. Melatonin-stimulated MSC-derived exosomes improve diabetic wound healing through regulating macrophage M1 and M2 polarization by targeting the PTEN/AKT pathway. Stem Cell Res Ther. 2020;11:259. · DOI
  47. Xia J, Gu L, Guo Y, Feng H, Chen S, Jurat J, et al. Gut microbiota mediates the preventive effects of dietary capsaicin against depression-like behavior induced by lipopolysaccharide in mice. Front Cell Infect Microbiol. 2021;11:627608. · DOI
  48. Xie L, Liu Y, Hu Y, Wang B, Zhu Z, Jiang Y, et al. Neonatal sevoflurane exposure induces impulsive behavioral deficit through disrupting excitatory neurons in the medial prefrontal cortex in mice. Transl Psychiatry. 2020;10:202. · DOI

Cited by

Sorted by citations

See all 16

Metadata

Authors
Wang, C., Feng, L., Zhu, L., Wu, L., Chen, B., Cui, C., Yang, M., Gao, Y., & Jiang, P.
Venue
Cell Death & Disease
Published
2023-09-29
Volume
14
Issue
9
ISSN
2041-4889
Cited by
16
References
5
Language
en
Funders
  • National Natural Science Foundation of China (82272253, 81602846, 82302795, 81901954)
  • Taishan Scholar Project of Shandong Province (tsqn201812159)
  • Natural Science Foundation of Shandong Province (ZR2021MH145, ZR2023QH094)
  • Research Fund for Lin He’s Academician Workstation of New Medicine and Clinical Translation of Jining Medical University

About these checks

Registry, retraction, Cites and statistics results are computed, not judged, with one exception: a printed reference that no index lists is read once by a model before it counts as a citation error. Claims are extracted by a model and kept only when their quote appears verbatim in the text; each cited source is then checked, with a model’s help, for whether it says what the claim relies on. Those verdicts can be wrong — read the claim’s quote and the cited source before relying on one.

Statistics and arithmetic are recomputed, not judged.

Confidence bands are shown only for fields calibrated on our annotated test set. None is calibrated yet, so no band is shown.

What counts as a claim ›How we measure confidence ›How we check this ›

Are you an author, or do you see a problem with this page? Request a review