

The DOI matches its Crossref record; 58 of the 58 references it cites were found in a registry or an index; none of the 11 sources its claims cite is checked for support yet.
Tumor treating fields increases membrane permeability in glioblastoma cells
Open accessAbstract
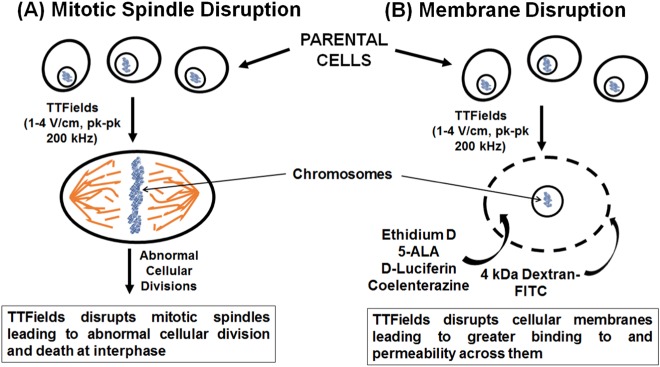
Glioblastoma is the most common yet most lethal of primary brain cancers with a one-year post-diagnosis survival rate of 65% and a five-year survival rate of barely 5%. Recently the U.S. Food and Drug Administration approved a novel fourth approach (in addition to surgery, radiation therapy, and chemotherapy) to treating glioblastoma; namely, tumor treating fields (TTFields). TTFields involves the delivery of alternating electric fields to the tumor but its mechanisms of action are not fully understood. Current theories involve TTFields disrupting mitosis due to interference with proper mitotic spindle assembly. We show that TTFields also alters cellular membrane structure thus rendering it more permeant to chemotherapeutics. Increased membrane permeability through the imposition of TTFields was shown by several approaches. For example, increased permeability was indicated through increased bioluminescence with TTFields exposure or with the increased binding and ingress of membrane-associating reagents such as Dextran-FITC or ethidium D or with the demonstration by scanning electron microscopy of augmented number and sizes of holes on the cellular membrane. Further investigations showed that increases in bioluminescence and membrane hole production with TTFields exposure disappeared by 24 h after cessation of alternating electric fields thus demonstrating that this phenomenom is reversible. Preliminary investigations showed that TTFields did not induce membrane holes in normal human fibroblasts thus suggesting that the phenomenom was specific to cancer cells. With TTFields, we present evidence showing augmented membrane accessibility by compounds such as 5-aminolevulinic acid, a reagent used intraoperatively to delineate tumor from normal tissue in glioblastoma patients. In addition, this mechanism helps to explain previous reports of additive and synergistic effects between TTFields and other chemotherapies. These findings have implications for the design of combination therapies in glioblastoma and other cancers and may significantly alter standard of care strategies for these diseases.
Overview
AI snapshot
Written from the paper’s full text.
TL;DR
Tumor treating fields (TTFields) increase plasma membrane permeability in glioblastoma cells, allowing greater uptake of small molecules and chemotherapeutics. This effect is reversible after TTFields cessation and appears specific to cancer cells in preliminary comparisons with normal human fibroblasts.
Key findings
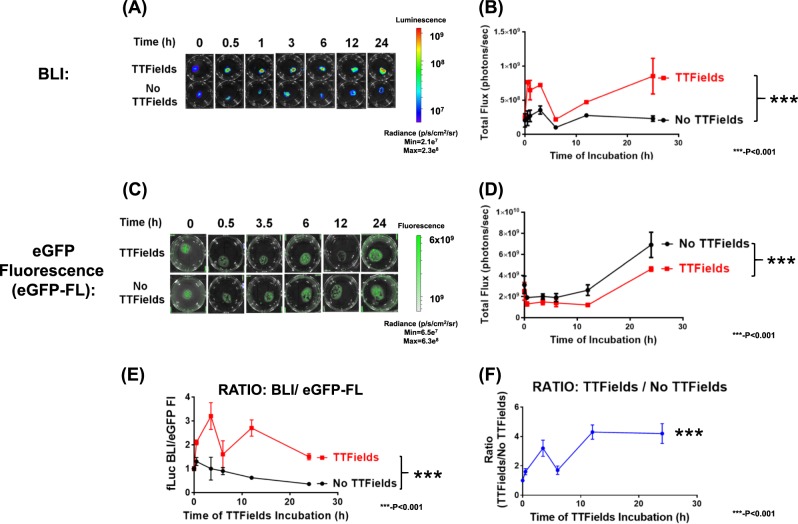
- TTFields (4 V/cm, 200 kHz, 0.5–24 h) significantly increased bioluminescence in luciferase-expressing U87-MG/eGFP-fLuc cells as early as 30 min and through 24 h (p < 0.0001, two-way ANOVA), without significantly increasing eGFP fluorescence.
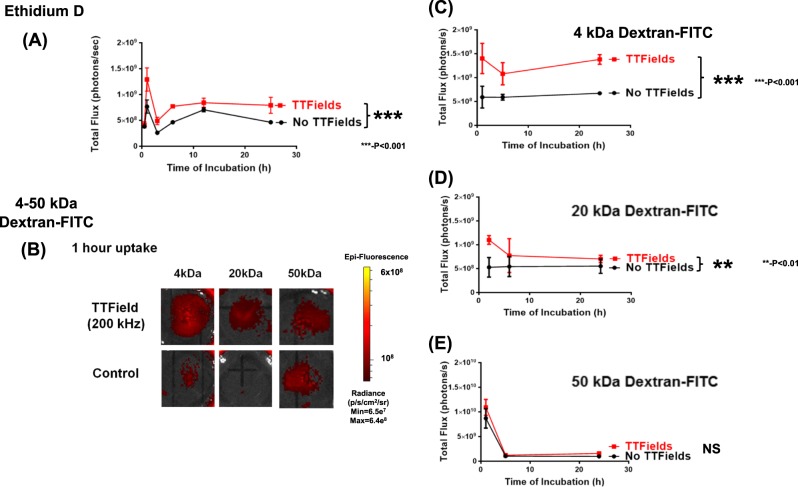
- Uptake of Dextran-FITC was significantly increased for 4 kDa (p < 0.0001) and 20 kDa (p < 0.01) dextrans, but not for 50 kDa dextran (p = 0.26, not significant).
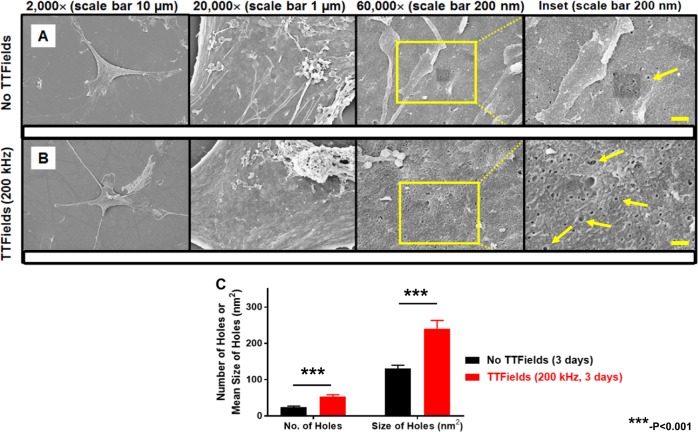
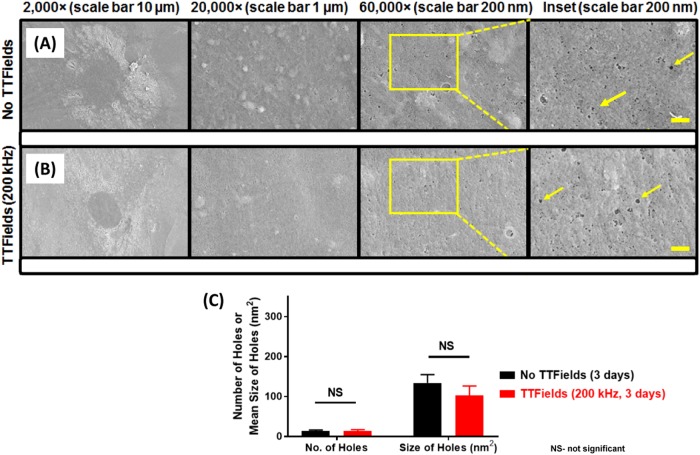
- SEM showed TTFields-exposed U87-MG cells had more holes ≥51.8 nm² (53.5 ± 19.1 vs. 23.9 ± 11.0, p = 0.0002) and larger average hole size (240.6 ± 91.7 nm² vs. 129.8 ± 31.9 nm², p = 0.0005) than unexposed cells; normal human PCS-201 fibroblasts showed no significant change.
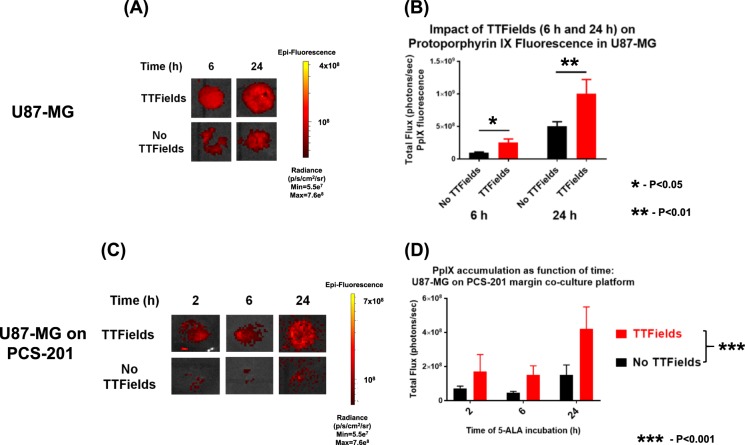
- TTFields increased 5-ALA uptake/PpIX fluorescence in U87-MG cells at 6 h (p = 0.047) and 24 h (p = 0.011), and in U87-MG/PCS-201 co-cultures (p < 0.001); the tumor-to-fibroblast PpIX ratio increased at 24 h (p = 0.043). Effects on bioluminescence, PpIX fluorescence, Dextran-FITC fluorescence, and SEM holes were attenuated after 24 h off TTFields.
Methods
- Cell lines: patient-derived GBM2 and GBM39, commercial U87-MG, murine KR158B astrocytoma, and normal human PCS-201 fibroblasts; some lines were engineered to express firefly, Renilla, or GFP-fusion luciferases.
- TTFields were applied in vitro using the inovitro system at 200 kHz (1–4 V/cm) for 0.5–72 h, with reversibility experiments after 24 h off TTFields; readouts included bioluminescence imaging, fluorescence imaging for Ethidium D, Dextran-FITC, and 5-ALA/PpIX, and scanning electron microscopy.
- Statistical analysis used PRISM 7.0; normally distributed data were analyzed by Student’s t-test or ANOVA, non-normal data by non-parametric tests such as Mann–Whitney U, with alpha = 0.05 and post-hoc corrections for multiple comparisons.
Limitations
- The paper states that results could not be confirmed in an animal model of glioblastoma because a practical device delivering TTFields to rodent brain does not yet exist.
- The paper states that work focused on glioblastoma cells using 200 kHz TTFields because FDA approval exists only for glioblastoma and only at this frequency.
- Evident from the text: experiments used unsynchronized cells, and the normal-fibroblast comparison is described as preliminary; the study is in vitro and does not establish clinical efficacy or blood-brain barrier effects.
Model-written summary. Check it against the paper before relying on it.
Integrity signals
Registry
Cites
Statistics
Figures
Verification
Claims the paper makes
41 Own result · 17 Own interpretation · 7 Not checked yet · 6 Own method
A result the paper reports from its own data — it cites no other source for it, so there is none to check. The quote shows it is in the paper.
In the paper
“There was a significantly increased number of holes greater than 51.8 nm2 in size (equivalent to 9 pixels2 on 60,000× magnification) within the ROI of TTFields-exposed cells (53.5 ± 19.1) compared to the TTFields-unexposed cells (23.9 ± 11.0), (p = 0.0002, univariate Mann–Whitney test).”
§ Tumor treating fields increases membrane permeability in glioblastoma cells > Results > SEM shows that TTFields alters membrane morphology of U87-MG/eGFP-fLuc cells
plaindirect- Asserted: passes — The authors put it forward as true.
- Checkable: passes — It can be checked against evidence.
- Load-bearing: passes — The paper’s conclusions depend on it.
- Based: passes — The paper gives a reason why it holds.
A result the paper reports from its own data — it cites no other source for it, so there is none to check. The quote shows it is in the paper.
In the paper
“Increased membrane permeability caused by TTFields exposure is also demonstrated with other membrane-penetrating reagents such as Dextran-FITC and Ethidium D.”
§ Tumor treating fields increases membrane permeability in glioblastoma cells > Background
boosteddirect- Asserted: passes — The authors put it forward as true.
- Checkable: passes — It can be checked against evidence.
- Load-bearing: passes — The paper’s conclusions depend on it.
- Based: passes — The paper gives a reason why it holds.
A result the paper reports from its own data — it cites no other source for it, so there is none to check. The quote shows it is in the paper.
In the paper
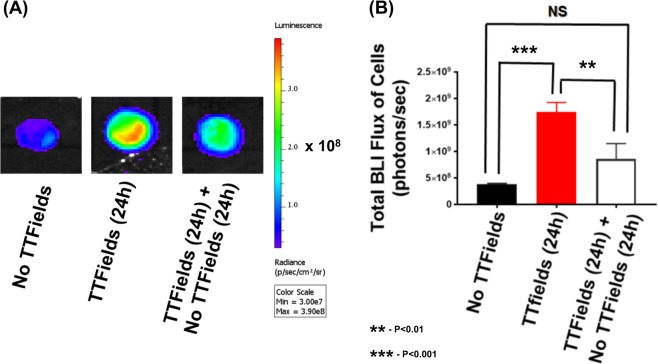
“but this increase was significantly attenuated when the cells were re-introduced to the no TTFields condition for 24 h (Fig. 7, two-way ANOVA, p < 0.005, TTFields [24 h] vs. TTFields [24 h] followed by no TTFields [24 h]).”
§ Tumor treating fields increases membrane permeability in glioblastoma cells > Results > The effect of TTFields on membrane permeability is reversible
plaindirect- Asserted: passes — The authors put it forward as true.
- Checkable: passes — It can be checked against evidence.
- Load-bearing: passes — The paper’s conclusions depend on it.
- Based: passes — The paper gives a reason why it holds.
A result the paper reports from its own data — it cites no other source for it, so there is none to check. The quote shows it is in the paper.
In the paper
“With TTFields, we present evidence showing augmented membrane accessibility by compounds such as 5-aminolevulinic acid, a reagent used intraoperatively to delineate tumor from normal tissue in glioblastoma patients.”
§ Tumor treating fields increases membrane permeability in glioblastoma cells > Abstract
boosteddirect- Asserted: passes — The authors put it forward as true.
- Checkable: passes — It can be checked against evidence.
- Load-bearing: passes — The paper’s conclusions depend on it.
- Based: passes — The paper gives a reason why it holds.
A result the paper reports from its own data — it cites no other source for it, so there is none to check. The quote shows it is in the paper.
In the paper
“We show that TTFields significantly enhances the tumor to normal cell ratio for PpIX fluorescence (brought on by 5-ALA exposure and uptake), and in this manner, may better delineate tumor margins in intraoperative settings.”
§ Tumor treating fields increases membrane permeability in glioblastoma cells > Background
boosteddirect- Asserted: passes — The authors put it forward as true.
- Checkable: passes — It can be checked against evidence.
- Load-bearing: passes — The paper’s conclusions depend on it.
- Based: passes — The paper gives a reason why it holds.
A result the paper reports from its own data — it cites no other source for it, so there is none to check. The quote shows it is in the paper.
In the paper
“although in our hands, there is little evidence of an apoptotic phenotype with a 24-h TTFields exposure.”
§ Tumor treating fields increases membrane permeability in glioblastoma cells > Discussion
hedged- Asserted: passes — The authors put it forward as true.
- Checkable: passes — It can be checked against evidence.
- Load-bearing: unclear — It is unclear whether the paper’s conclusions depend on it.
- Based: passes — The paper gives a reason why it holds.
A result the paper reports from its own data — it cites no other source for it, so there is none to check. The quote shows it is in the paper.
In the paper
“We confirmed the phenomenon of increased cellular membrane permeability for glioblastomas in the presence of TTFields across multiple human GBM cell lines.”
§ Tumor treating fields increases membrane permeability in glioblastoma cells > Discussion
plaindirect- Asserted: passes — The authors put it forward as true.
- Checkable: passes — It can be checked against evidence.
- Load-bearing: passes — The paper’s conclusions depend on it.
- Based: passes — The paper gives a reason why it holds.
A result the paper reports from its own data — it cites no other source for it, so there is none to check. The quote shows it is in the paper.
In the paper
“Furthermore, this finding held true for both ATP-dependent (FLuc) and ATP-independent luciferase (RLuc).”
§ Tumor treating fields increases membrane permeability in glioblastoma cells > Discussion
plaindirect- Asserted: passes — The authors put it forward as true.
- Checkable: passes — It can be checked against evidence.
- Load-bearing: passes — The paper’s conclusions depend on it.
- Based: passes — The paper gives a reason why it holds.
A result the paper reports from its own data — it cites no other source for it, so there is none to check. The quote shows it is in the paper.
In the paper
“Furthermore, we show that the morphology of the glioblastoma cell membrane is perturbed when TTFields are applied.”
§ Tumor treating fields increases membrane permeability in glioblastoma cells > Background
plaindirect- Asserted: passes — The authors put it forward as true.
- Checkable: passes — It can be checked against evidence.
- Load-bearing: passes — The paper’s conclusions depend on it.
- Based: passes — The paper gives a reason why it holds.
A result the paper reports from its own data — it cites no other source for it, so there is none to check. The quote shows it is in the paper.
In the paper
“The presence of TTFields (24 h) significantly increased BLI flux compared to no TTFields exposure (Fig. 7, p < 0.0005, two-way ANOVA, TTFields vs. no TTFields, Supplemental Figures S11)”
§ Tumor treating fields increases membrane permeability in glioblastoma cells > Results > The effect of TTFields on membrane permeability is reversible
plaindirect- Asserted: passes — The authors put it forward as true.
- Checkable: passes — It can be checked against evidence.
- Load-bearing: passes — The paper’s conclusions depend on it.
- Based: passes — The paper gives a reason why it holds.
- It may state two separate claims as one. 17
- Probably not a substantial claim. 8
A result the paper reports from its own data — it cites no other source for it, so there is none to check. The quote shows it is in the paper.
In the paper
“For no TTFields samples, the cell surface appeared to be covered in densely matted, elongated and flattened membrane extensions, similar to membrane ruffles and contiguous with the cellular membrane. In contrast, after 24 h of exposure to TTFields, the densely matted and elongated structures were replaced by short, bulbous and bleb-like structures.”
§ Tumor treating fields increases membrane permeability in glioblastoma cells > Results > SEM shows that TTFields alters membrane morphology of U87-MG/eGFP-fLuc cells
plaindirect- Asserted: passes — The authors put it forward as true.
- Checkable: passes — It can be checked against evidence.
- Load-bearing: unclear — It is unclear whether the paper’s conclusions depend on it.
- Based: passes — The paper gives a reason why it holds.
It may state two separate claims as one.
A result the paper reports from its own data — it cites no other source for it, so there is none to check. The quote shows it is in the paper.
In the paper
“Further investigations showed that increases in bioluminescence and membrane hole production with TTFields exposure disappeared by 24 h after cessation of alternating electric fields thus demonstrating that this phenomenom is reversible.”
§ Tumor treating fields increases membrane permeability in glioblastoma cells > Abstract
boosteddirect- Asserted: passes — The authors put it forward as true.
- Checkable: passes — It can be checked against evidence.
- Load-bearing: passes — The paper’s conclusions depend on it.
- Based: passes — The paper gives a reason why it holds.
It may state two separate claims as one.
A result the paper reports from its own data — it cites no other source for it, so there is none to check. The quote shows it is in the paper.
In the paper
“The accessibility of the cell membrane to small probes in the setting of TTFields was tested with FITC-labeled dextrans, which resulted in an increase in influx of 4 kDa (Stokes’ radius ~1.4 nm44) and 20 kDa (Stokes’ radius ~3.3 nm44) but not 50 kDa dextrans (Stokes’ radius ~5 nm44).”
§ Tumor treating fields increases membrane permeability in glioblastoma cells > Discussion
plaindirect- Asserted: passes — The authors put it forward as true.
- Checkable: passes — It can be checked against evidence.
- Load-bearing: passes — The paper’s conclusions depend on it.
- Based: passes — The paper gives a reason why it holds.
It may state two separate claims as one.
A result the paper reports from its own data — it cites no other source for it, so there is none to check. The quote shows it is in the paper.
In the paper
“and for 4 kDa Dextran-FITC fluorescence (Figure 12B, p < 0.05, two-way ANOVA, TTFields vs. no TTFields; and p < 0.05, TTFields vs. TTFields followed by no TTFields).”
§ Tumor treating fields increases membrane permeability in glioblastoma cells > Results > The effect of TTFields on membrane permeability is reversible
plaindirect- Asserted: passes — The authors put it forward as true.
- Checkable: passes — It can be checked against evidence.
- Load-bearing: passes — The paper’s conclusions depend on it.
- Based: passes — The paper gives a reason why it holds.
It may state two separate claims as one.
A result the paper reports from its own data — it cites no other source for it, so there is none to check. The quote shows it is in the paper.
In the paper
“A similar pattern of reversible readouts occurred with PpIX fluorescence (Supplemental Figure S12A, p < 0.0005, two-way ANOVA, TTFields vs. no TTFields and p < 0.0004, TTFields vs. TTFields followed by no TTFields)”
§ Tumor treating fields increases membrane permeability in glioblastoma cells > Results > The effect of TTFields on membrane permeability is reversible
plaindirect- Asserted: passes — The authors put it forward as true.
- Checkable: passes — It can be checked against evidence.
- Load-bearing: passes — The paper’s conclusions depend on it.
- Based: passes — The paper gives a reason why it holds.
It may state two separate claims as one.
A result the paper reports from its own data — it cites no other source for it, so there is none to check. The quote shows it is in the paper.
In the paper
“When U87-MG cells were subjected to 1 h of 200 kHz TTFields, there was a significant uptake of Dextran-FITC of molecular weights 4 kDa and 20 kDa, compared to no TTFields exposure, but there was no significant difference in uptake for 50 kDa Dextran-FITC (Fig. 3b–e).”
§ Tumor treating fields increases membrane permeability in glioblastoma cells > Results > Effect of TTFields on uptake of membrane-associating reagents
plaindirect- Asserted: passes — The authors put it forward as true.
- Checkable: passes — It can be checked against evidence.
- Load-bearing: passes — The paper’s conclusions depend on it.
- Based: passes — The paper gives a reason why it holds.
It may state two separate claims as one.
A result the paper reports from its own data — it cites no other source for it, so there is none to check. The quote shows it is in the paper.
In the paper
“This increase in BLI occurred as early as 30 minutes after commencement of TTFields and continued to 24 h of TTFields exposure (Fig. 2a).”
§ Tumor treating fields increases membrane permeability in glioblastoma cells > Results > Induction of TTFields increases BLI in luciferase-expressing glioblastomas
plaindirect- Asserted: passes — The authors put it forward as true.
- Checkable: passes — It can be checked against evidence.
- Load-bearing: passes — The paper’s conclusions depend on it.
- Based: passes — The paper gives a reason why it holds.
It may state two separate claims as one.
A result the paper reports from its own data — it cites no other source for it, so there is none to check. The quote shows it is in the paper.
In the paper
“TTFields exposure resulted in significantly increased uptake of 5-ALA into U87-MG/eGFP-fLuc cells as early as 6 h of TTFields exposure (Fig. 4a, b, p = 0.047, Student’s t-test, TTFields vs. no TTFields) and this increase was maintained with prolonged TTFields exposure of 24 h (Fig. 4a, b, p = 0.011).”
§ Tumor treating fields increases membrane permeability in glioblastoma cells > Results > Effect of TTFields on 5-aminolevulinic (5-ALA) acid uptake: single U87-MG culture
plaindirect- Asserted: passes — The authors put it forward as true.
- Checkable: passes — It can be checked against evidence.
- Load-bearing: passes — The paper’s conclusions depend on it.
- Based: passes — The paper gives a reason why it holds.
It may state two separate claims as one.
A result the paper reports from its own data — it cites no other source for it, so there is none to check. The quote shows it is in the paper.
In the paper
“At lengths of TTFields exposure of 0.5–3 h, the duration in BLI augmentation (compared to no TTFields conditions) lasted about 5 min. However, at TTFields exposures of 12–25 h, this difference in BLI between TTFields and no TTFields conditions lasted for more than 20 min (Supplemental Figure S9A).”
§ Tumor treating fields increases membrane permeability in glioblastoma cells > Discussion
plaincorrelational- Asserted: passes — The authors put it forward as true.
- Checkable: passes — It can be checked against evidence.
- Load-bearing: passes — The paper’s conclusions depend on it.
- Based: passes — The paper gives a reason why it holds.
It may state two separate claims as one.
What the paper did — it cites no source for this, so there is none to check. The quote shows it is in the paper.
In the paper
“All experimental conditions were done in triplicate and statistical analysis calculated via 2-way ANOVA.”
§ Tumor treating fields increases membrane permeability in glioblastoma cells > Results > The effect of TTFields on membrane permeability is reversible
plain- Asserted: passes — The authors put it forward as true.
- Checkable: passes — It can be checked against evidence.
- Load-bearing: fails — The paper’s conclusions may not depend on it.
- Based: passes — The paper gives a reason why it holds.
Probably not a substantial claim. The paper’s conclusions may not depend on it. It may state two separate claims as one.
What the paper did — it cites no source for this, so there is none to check. The quote shows it is in the paper.
In the paper
“Unless otherwise mentioned, all experiments were done in at least triplicate samples per condition and per time point.”
§ Tumor treating fields increases membrane permeability in glioblastoma cells > Material and methods > In vitro tumor treating field apparatus30
plain- Asserted: passes — The authors put it forward as true.
- Checkable: passes — It can be checked against evidence.
- Load-bearing: fails — The paper’s conclusions may not depend on it.
- Based: passes — The paper gives a reason why it holds.
Probably not a substantial claim. The paper’s conclusions may not depend on it.
A conclusion the paper draws from its own results — it cites no other source for it, so there is none to check. The quote shows it is in the paper.
In the paper
“We show that TTFields also alters cellular membrane structure thus rendering it more permeant to chemotherapeutics.”
§ Tumor treating fields increases membrane permeability in glioblastoma cells > Abstract
plaindirect- Asserted: passes — The authors put it forward as true.
- Checkable: passes — It can be checked against evidence.
- Load-bearing: passes — The paper’s conclusions depend on it.
- Based: passes — The paper gives a reason why it holds.
It may state two separate claims as one.
- Rests on an assumption: The membrane holes observed by SEM are not artifacts of sample preparation and reflect actual holes in living cell membranes.
None of the sources cited for this claim have been checked yet.
In the paper
“TTFields compliance (≥75% vs. <75%) was an independent predictor of overall survival in the retrospective analysis of the full EF-14 trial dataset2 and the duration of use of TTFields was also found to affect overall survival60.”
§ Tumor treating fields increases membrane permeability in glioblastoma cells > Discussion
What the sources say
- Not checked yetcites [2] Stupp, R. et al. Effect of tumor-treating fields plus maintenance temozolomide vs maintenance temozolomide alone on survival in patients with glioblastoma: a randomized clinical trial. JAMA 318, 2306–2316 (2017). source
- Not checked yetcites [60] Ram, Z., Kim, C. Y., Nicholas, G. A. & Toms, S. A. ACTR-27. Compliance and treatment duration predict survival in a phase 3 EF-14 trial of tumor treating fields with temozolomide in patients with newly diagnosed glioblastoma. NeuroOncology 19(suppl_6), vi6–vi7 (2017).
plaincorrelational- Asserted: passes — The authors put it forward as true.
- Checkable: passes — It can be checked against evidence.
- Load-bearing: passes — The paper’s conclusions depend on it.
- Based: passes — The paper gives a reason why it holds.
It may state two separate claims as one.
What the paper did — it cites no source for this, so there is none to check. The quote shows it is in the paper.
In the paper
“Coverslips from three experiments per condition were used, and at least 5 cells per coverslip were analyzed for hole count and size, in a double-blind manner.”
- Also stated in: § SEM shows that TTFields alters membrane morphology of U87-MG/eGFP-fLuc cells · plain
“Coverslips from three experiments per condition were used, and at least 5 cells per coverslip were analyzed for hole count and size, in a double-blind manner”
§ Tumor treating fields increases membrane permeability in glioblastoma cells > Results > SEM shows that TTFields alters membrane morphology of U87-MG/eGFP-fLuc cells
plain- Asserted: passes — The authors put it forward as true.
- Checkable: passes — It can be checked against evidence.
- Load-bearing: passes — The paper’s conclusions depend on it.
- Based: passes — The paper gives a reason why it holds.
Probably not a substantial claim. It may state two separate claims as one.
- Also stated in: § SEM shows that TTFields alters membrane morphology of U87-MG/eGFP-fLuc cells · plain
In the paper
“Recently we have demonstrated that TTFields treatment, in conjunction with a novel anticancer compound Withaferin A, synergistically inhibited the growth of human glioblastoma cells18.”
§ Tumor treating fields increases membrane permeability in glioblastoma cells > Background
What the sources say
- Not checked yetcites [18] Chang, E. et al. Synergistic inhibition of glioma cell proliferation by Withaferin A and tumor treating fields. J. Neurooncol. 134, 259–268 (2017). source
boosteddirect- Asserted: passes — The authors put it forward as true.
- Checkable: passes — It can be checked against evidence.
- Load-bearing: passes — The paper’s conclusions depend on it.
- Based: passes — The paper gives a reason why it holds.
Probably not a substantial claim.
A conclusion the paper draws from its own results — it cites no other source for it, so there is none to check. The quote shows it is in the paper.
In the paper
“This suggests that TTFields cause GBM cells to become more permeant to substances as large as 20 kDa, but no greater than 50 kDa.”
§ Tumor treating fields increases membrane permeability in glioblastoma cells > Discussion
hedgeddirect- Asserted: passes — The authors put it forward as true.
- Checkable: passes — It can be checked against evidence.
- Load-bearing: passes — The paper’s conclusions depend on it.
- Based: passes — The paper gives a reason why it holds.
It may state two separate claims as one.
None of the sources cited for this claim have been checked yet.
In the paper
“Most recently, TTFields has been shown to prolong median survival (by 5 months) of glioblastoma patients on maintenance temozolomide chemotherapy2,9.”
§ Tumor treating fields increases membrane permeability in glioblastoma cells > Background
What the sources say
- Not checked yetcites [2] Stupp, R. et al. Effect of tumor-treating fields plus maintenance temozolomide vs maintenance temozolomide alone on survival in patients with glioblastoma: a randomized clinical trial. JAMA 318, 2306–2316 (2017). source
- Not checked yetcites [9] Stupp, R. et al. Maintenance therapy with tumor-treating fields plus temozolomide vs temozolomide alone for glioblastoma: a randomized clinical trial. JAMA 314, 2535–2543 (2015). source
boosteddirect- Asserted: passes — The authors put it forward as true.
- Checkable: passes — It can be checked against evidence.
- Load-bearing: fails — The paper’s conclusions may not depend on it.
- Based: passes — The paper gives a reason why it holds.
Probably not a substantial claim. The paper’s conclusions may not depend on it.
In the paper
“TTFields has been shown to disrupt the localization of septins (intracellular proteins responsible for anchoring mitotic spindles during cellular division) and thereby perturb mitosis14.”
§ Tumor treating fields increases membrane permeability in glioblastoma cells > Background
What the sources say
- Not checked yetcites [14] Gera, N. et al. Tumor treating fields perturb the localization of septins and cause aberrant mitotic exit. PLoS ONE 10, e0125269 (2015). source
plaindirect- Asserted: passes — The authors put it forward as true.
- Checkable: passes — It can be checked against evidence.
- Load-bearing: fails — The paper’s conclusions may not depend on it.
- Based: passes — The paper gives a reason why it holds.
Probably not a substantial claim. The paper’s conclusions may not depend on it. It may state two separate claims as one.
A conclusion the paper draws from its own results — it cites no other source for it, so there is none to check. The quote shows it is in the paper.
In the paper
“Increased GBM cell permeability to D-luciferin as measured by BLI was not due to the effects of TTFields on luciferase itself, but rather due to an increased influx of its substrate D-luciferin into the cells engineered to express the firefly luciferase.”
§ Tumor treating fields increases membrane permeability in glioblastoma cells > Discussion
plaindirect- Asserted: passes — The authors put it forward as true.
- Checkable: passes — It can be checked against evidence.
- Load-bearing: passes — The paper’s conclusions depend on it.
- Based: passes — The paper gives a reason why it holds.
It may state two separate claims as one.
What the paper did — it cites no source for this, so there is none to check. The quote shows it is in the paper.
In the paper
“All ROI analyses were performed in a blinded manner in which neither the individual responsible for SEM image acquisition nor the one performing data analyses knew of the experimental conditions for the samples.”
§ Tumor treating fields increases membrane permeability in glioblastoma cells > Material and methods > Scanning electron microscopy (SEM)
plain- Asserted: passes — The authors put it forward as true.
- Checkable: passes — It can be checked against evidence.
- Load-bearing: fails — The paper’s conclusions may not depend on it.
- Based: passes — The paper gives a reason why it holds.
Probably not a substantial claim. The paper’s conclusions may not depend on it.
What the paper did — it cites no source for this, so there is none to check. The quote shows it is in the paper.
In the paper
“In addition, we focused our work in glioblastoma cells using the 200 kHz TTFields frequency, because currently FDA approval exists only for glioblastoma and only at this frequency.”
§ Tumor treating fields increases membrane permeability in glioblastoma cells > Discussion
plaindirect- Asserted: passes — The authors put it forward as true.
- Checkable: passes — It can be checked against evidence.
- Load-bearing: passes — The paper’s conclusions depend on it.
- Based: passes — The paper gives a reason why it holds.
Probably not a substantial claim. It may state two separate claims as one.
The paper relies on this without support.
The PCS-201 fibroblasts used are representative of normal human cells for assessing whether TTFields effects are cancer-specific.
“In contrast to U87-MG cells, TTFields did not significantly alter the size nor the number of holes in normal human fibroblast cells (Fig. 6).”
The paper relies on this without support.
The membrane holes observed by SEM are not artifacts of sample preparation and reflect actual holes in living cell membranes.
“Finally, we present scanning electron microscopy (SEM) data that demonstrate an increase in the number and size of holes in glioblastoma cell membranes caused by TTFields exposure.”
The paper relies on this without support.
This is the first study to report the effects of TTFields on cancer cellular membrane integrity.
“To our knowledge, this is the first study to report the effects of TTFields on cancer cellular membrane integrity.”
The paper relies on this without support.
TTFields exert their maximal antiproliferative effect on dividing cells.
“TTFields exert their maximal antiproliferative effect on dividing cells”
Claims other papers make about this one
Each is checked against this paper’s own text: does it say what the citing paper says it does?
The source backs part of the claim, not all of it — or backs it for a different population, condition or comparison.
In the citing paper
“The results from electroporation studies further support that ion channel activation and ion influx, and perhaps other effects such as cytoskeleton damage, can be used as biomarkers of responsiveness to TTFields, given that these phenomena are observed after exposure to electric fields [27,46,62,65].”
From Permeabilizing Cell Membranes with Electric Fields (2021) · cites this paper as [27]
Experimental — accuracy not yet measuredThe cited source says what the claim attributes to it.
In the citing paper
“Recent investigations [27] have shown that the standard theory of how TTFields work [8] requires further elaboration.”
From Permeabilizing Cell Membranes with Electric Fields (2021) · cites this paper as [27]
The cited source says what the claim attributes to it.
In the citing paper
“The ability to enhance the efficacy of chemotherapeutics may be explained by the induction of fenestrae in the plasma membrane by TTFields, which we previously observed with scanning electron microscopy [27].”
From Permeabilizing Cell Membranes with Electric Fields (2021) · cites this paper as [27]
In the citing paper
“Such effects were shown to occur in cancer cells but not in non-cancer cells [27].”
From Permeabilizing Cell Membranes with Electric Fields (2021) · cites this paper as [27]
In the citing paper
“As shown by scanning electron microscopy (SEM), TTFields induce fenestrae in cancer cellular membranes through increases in the size and number of observed membrane openings post-exposure [27].”
From Permeabilizing Cell Membranes with Electric Fields (2021) · cites this paper as [27]
In the citing paper
“However, if we assume TTFields act on voltage-gated Cav2+ channels, the diameter of the channels is on the order of a few nanometers and therefore is too small to associate them with the pores shown by Chang et al. to be created or enlarged by TTFields, which had cross-sectional areas of 240.6 ± 91.7 nm2 [27], representing diameters of 17.5 ± 10.8 nm.”
From Permeabilizing Cell Membranes with Electric Fields (2021) · cites this paper as [27]
In the citing paper
“Further, we conclude that even if TTFields open Cav2+ channels, the effect would be secondary to the effect of the pores found by Chang et al. [27]. The size of the pores compared to ion channel diameters and their presumed non-ion-specificity implies that, by the Nernst and Goldman equations [52], complete equalization of all ion differentials across the cell membrane would occur rapidly and”
From Permeabilizing Cell Membranes with Electric Fields (2021) · cites this paper as [27]
In the citing paper
“The deformations observed were reversible and non-damaging, similar to the induction of membrane fenestrae by TTFields [27,53].”
From Permeabilizing Cell Membranes with Electric Fields (2021) · cites this paper as [27]
In the citing paper
“AEFs have been shown to permeabilize cancer cell membranes in a selective and reversible manner [27].”
From Permeabilizing Cell Membranes with Electric Fields (2021) · cites this paper as [27]
In the citing paper
“For example, the application of alternating electric fields has been shown to disrupt the membranes of subcellular compartments [85] as well as the plasma membrane of human glioblastoma cells [27].”
From Permeabilizing Cell Membranes with Electric Fields (2021) · cites this paper as [27]
In the citing paper
“The unexpectedly high field strengths achieved in these regions may remove the obstacle of electric field strength being insufficient for bioelectrorheological and electroporative processes to be able to explain the empirical observation of membrane fenestration due to TTFields [27].”
From Permeabilizing Cell Membranes with Electric Fields (2021) · cites this paper as [27]
Self-check
Percentages, sums and reported differences re-computed from the paper’s own numbers.
Each contradiction between two passages listed here was confirmed by an independent check.
Rated minor: it would not touch a result — a value no result rests on, a p-value that stays on the same side of the significance level, or a conflict that is clerical, resolved elsewhere in the paper, or outside its own findings.
In the paper
§ Tumor treating fields increases membrane permeability in glioblastoma cells > Discussion
“5-ALA has a molecular weight of 167.6 g/mol (169 Da)”
§ Tumor treating fields increases membrane permeability in glioblastoma cells > Discussion
“5-ALA has a molecular weight of 167.6 g/mol (169 Da)”
Rated minor: it would not touch a result — a value no result rests on, a p-value that stays on the same side of the significance level, or a conflict that is clerical, resolved elsewhere in the paper, or outside its own findings.
In the paper
§ Tumor treating fields increases membrane permeability in glioblastoma cells > Background
“luciferase (renilla and firefly), and that this induction is due to increased permeation of the substrates (d-luciferin and coelenterazine, respectively)”
§ Tumor treating fields increases membrane permeability in glioblastoma cells > Material and methods > Bioluminescence imaging
“d-Luciferin (0.3 mg/mL final concentration) for fLuc and coelenterazine (1 μg/mL) for rLuc.”
Rated minor: it would not touch a result — a value no result rests on, a p-value that stays on the same side of the significance level, or a conflict that is clerical, resolved elsewhere in the paper, or outside its own findings.
In the paper
§ Tumor treating fields increases membrane permeability in glioblastoma cells > Results > Effect of TTFields on 5-aminolevulinic (5-ALA) acid uptake: single U87-MG culture
“a representative protoporphyrin IX (PpIX) fluorescence panel for TTFields-unexposed vs. TTFields-exposed U87-MG cells after 6 and 24 h of exposure.”
§ Tumor treating fields increases membrane permeability in glioblastoma cells > Results > Effect of TTFields on 5-aminolevulinic (5-ALA) acid uptake: single U87-MG culture
“Scale bar on right used for both 6 h and 12 h post-exposure data.”
Rated minor: it would not touch a result — a value no result rests on, a p-value that stays on the same side of the significance level, or a conflict that is clerical, resolved elsewhere in the paper, or outside its own findings.
In the paper
§ Tumor treating fields increases membrane permeability in glioblastoma cells > Results > The effect of TTFields on membrane permeability is reversible
“No TTFields exposure, standard cell culture conditions (37 oC, 95% O2, 5 %CO2)”
§ Tumor treating fields increases membrane permeability in glioblastoma cells > Material and methods > In vitro tumor treating field apparatus30
“Corresponding control experiments (no TTFields) were done by placing equivalent coverslips within 6-well or 12-well plates into a conventional humidified tissue culture incubator (37 oC, 95% air/5% CO2)”
Citations
Cites
Radiotherapy Plus Concomitant and Adjuvant Temozolomide for Glioblastoma
Stupp, R., Mason, W. P., van den Bent, M. J., Weller, M., Fisher, B., Taphoorn, M. J. B., Belanger, K., Brandes, A. A., Marosi, C., Bogdahn, U., et al. (2005) · New England Journal of Medicine · doi:10.1056/nejmoa043330 · Cited by 21,807
Stupp, R., Taillibert, S., Kanner, A., Read, W., Steinberg, D. M., Lhermitte, B., Toms, S., Idbaih, A., Ahluwalia, M. S., Fink, K., et al. (2017) · JAMA · doi:10.1001/jama.2017.18718 · Cited by 2,644
Stupp, R., Taillibert, S., Kanner, A. A., Kesari, S., Steinberg, D. M., Toms, S. A., Taylor, L. P., Lieberman, F., Silvani, A., Fink, K. L., et al. (2015) · JAMA · doi:10.1001/jama.2015.16669 · Cited by 1,259
Kennedy (1992) · doi:10.1016/1011-1344(92)85108-7 · Cited by 1,166
Neuronal Activity Promotes Glioma Growth through Neuroligin-3 Secretion
Venkatesh, H. S., Johung, T., Caretti, V., Noll, A., Tang, Y., Nagaraja, S., Gibson, E. M., Mount, C., Polepalli, J. S., Mitra, S. S., et al. (2015) · Cell · doi:10.1016/j.cell.2015.04.012 · Cited by 1,011
Alternating electric fields arrest cell proliferation in animal tumor models and human brain tumors
Kirson, E. D., Dbalý, V., Tovaryš, F., Vymazal, J., Soustiel, J. F., Itzhaki, A., Mordechovich, D., Steinberg-Shapira, S., Gurvich, Z., Schneiderman, R., et al. (2007) · Proceedings of the National Academy of Sciences · doi:10.1073/pnas.0702916104 · Cited by 894
Stupp, R., Wong, E. T., Kanner, A. A., Steinberg, D., Engelhard, H., Heidecke, V., Kirson, E. D., Taillibert, S., Liebermann, F., Dbalý, V., et al. (2012) · European Journal of Cancer · doi:10.1016/j.ejca.2012.04.011 · Cited by 862
Disruption of cancer cell replication by alternating electric fields
Kirson, E. D., Gurvich, Z., Schneiderman, R., Dekel, E., Itzhaki, A., Wasserman, Y., Schatzberger, R., & Palti, Y. (2004) · Cancer research · doi:10.1158/0008-5472.can-04-0083 · Cited by 827
Functionally defined therapeutic targets in diffuse intrinsic pontine glioma
Grasso, C. S., Tang, Y., Truffaux, N., Berlow, N. E., Liu, L., Debily, M.-A., Quist, M. J., Davis, L. E., Huang, E. C., Woo, P. J., et al. (2015) · Nature Medicine · doi:10.1038/nm.3855 · Cited by 687
Stupp, R., Taillibert, S., Kanner, A. A., Read, W. L., Steinberg, D. M., Lhermitte, B., Toms, S. A., Idbaïh, A., Ahluwalia, M. S., Fink, K., et al. (2017) · Dipòsit Digital de la Universitat de Barcelona (Universitat de Barcelona) · doi:10.5167/uzh-143757 · Cited by 630
ALTERATIONS IN OUTER MEMBRANE PERMEABILITY
Hancock, R. E. W. (1984) · Annual Review of Microbiology · doi:10.1146/annurev.mi.38.100184.001321 · Cited by 567
Glioblastoma: From Molecular Pathology to Targeted Treatment
Cloughesy, T. F., Cavenee, W. K., & Mischel, P. S. (2011) · Annual Review of Pathology Mechanisms of Disease · doi:10.1146/annurev-pathol-011110-130324 · Cited by 531
Tumor-Treating Fields: A Fourth Modality in Cancer Treatment
Mun, E. J., Babiker, H. M., Weinberg, U., Kirson, E. D., & Von Hoff, D. D. (2018) · Clinical Cancer Research · doi:10.1158/1078-0432.ccr-17-1117 · Cited by 380
Giladi, M., Schneiderman, R. S., Voloshin, T., Porat, Y., Munster, M., Blat, R., Sherbo, S., Bomzon, Z., Urman, N., Itzhaki, A., et al. (2015) · Scientific Reports · doi:10.1038/srep18046 · Cited by 327
Brandes, A. A., Tosoni, A., Spagnolli, F., Frezza, G., Leonardi, M., Calbucci, F., & Franceschi, E. (2008) · Neuro-Oncology · doi:10.1215/15228517-2008-008 · Cited by 280
Overviews on the cellular uptake mechanism of polysaccharide colloidal nanoparticles
Salatin, S., & Khosroushahi, A. Y. (2017) · Journal of Cellular and Molecular Medicine · doi:10.1111/jcmm.13110 · Cited by 270
Kirson, E. D., Schneiderman, R. S., Dbalý, V., Tovaryš, F., Vymazal, J., Itzhaki, A., Mordechovich, D., Gurvich, Z., Shmueli, E., Goldsher, D., et al. (2009) · BMC Medical Physics · doi:10.1186/1756-6649-9-1 · Cited by 224
IEEE Transactions on Ultrasonics, Ferroelectrics and Frequency Control
(2008) · IEEE Transactions on Ultrasonics Ferroelectrics and Frequency Control · doi:10.1109/tuffc.2008.846 · Cited by 223
Tumor Treating Fields Perturb the Localization of Septins and Cause Aberrant Mitotic Exit
Gera, N., Yang, A., Holtzman, T. S., Lee, S. X., Wong, E. T., & Swanson, K. D. (2015) · PLOS ONE · doi:10.1371/journal.pone.0125269 · Cited by 217
Sarkaria, J. N., Yang, L., Grogan, P. T., Kitange, G. J., Carlson, B. L., Schroeder, M. A., Galanis, E., Giannini, C., Wu, W., Dinca, E. B., et al. (2007) · Molecular Cancer Therapeutics · doi:10.1158/1535-7163.mct-06-0691 · Cited by 197
Tumor treating fields: A new frontier in cancer therapy
Davies, A. M., Weinberg, U., & Palti, Y. (2013) · Annals of the New York Academy of Sciences · doi:10.1111/nyas.12112 · Cited by 193
Blebbing confers resistance against cell lysis
Babiychuk, E. B., Monastyrskaya, K., Potez, S., & Draeger, A. (2010) · Cell Death and Differentiation · doi:10.1038/cdd.2010.81 · Cited by 180
Tumor treating fields: A novel treatment modality and its use in brain tumors
Hottinger, A. F., Pacheco, P., & Stupp, R. (2016) · Neuro-Oncology · doi:10.1093/neuonc/now182 · Cited by 177
Valdes, P. A., Jacobs, V. L., Harris, B. T., Wilson, B. C., Leblond, F., Paulsen, K. D., & Roberts, D. W. (2015) · Journal of neurosurgery · doi:10.3171/2014.12.jns14391 · Cited by 175
Herman, B. A., Nieminen, A., Gores, G. J., & Lemasters, J. J. (1988) · The FASEB Journal · doi:10.1096/fasebj.2.2.3342967 · Cited by 164
Giladi, M., Munster, M., Schneiderman, R. S., Voloshin, T., Porat, Y., Blat, R., Zielinska-Chomej, K., Hååg, P., Bomzon, Z., Kirson, E. D., et al. (2017) · Radiation Oncology · doi:10.1186/s13014-017-0941-6 · Cited by 160
Tonn, J., & Stummer, W. (2008) · PubMed · Cited by 158
Mrugala, M. M., Engelhard, H. H., Dinh Tran, D., Kew, Y., Cavaliere, R., Villano, J. L., Annenelie Bota, D., Rudnick, J., Love Sumrall, A., Zhu, J.-J., et al. (2014) · Seminars in Oncology · doi:10.1053/j.seminoncol.2014.09.010 · Cited by 152
Hoffmann, A., Bredno, J., Wendland, M. F., Derugin, N., Ohara, P. T., & Wintermark, M. (2010) · Translational Stroke Research · doi:10.1007/s12975-010-0049-x · Cited by 148
Belykh, E. G., Martirosyan, N. L., Yağmurlu, K., Miller, E. J., Eschbacher, J. M., Izadyyazdanabadi, M., Bardonova, L., Byvaltsev, V. A., Nakaji, P., & Preul, M. C. (2016) · Frontiers in Surgery · doi:10.3389/fsurg.2016.00055 · Cited by 143
Standards of care and novel approaches in the management of glioblastoma multiforme
Hottinger, A. F., Stupp, R., & Homicskó, K. (2014) · 癌症:英文版 · doi:10.5732/cjc.013.10207 · Cited by 141
Active relocation of chromatin and endoplasmic reticulum into blebs in late apoptotic cells
Lane, J. D., Allan, V., & Woodman, P. G. (2005) · Journal of Cell Science · doi:10.1242/jcs.02529 · Cited by 141
Karanam, N. K., Kalayarasan, S., Ding, L., Sishc, B. J., Saha, D., & Story, M. D. (2017) · Cell Death and Disease · doi:10.1038/cddis.2017.136 · Cited by 134
Krieg, R. C., Messmann, H., Rauch, J., Seeger, S., & Knuechel, R. (2002) · Photochemistry and Photobiology · doi:10.1562/0031-8655(2002)0760518mcotcs2.0.co2 · Cited by 133
Giladi, M., Weinberg, U., Schneiderman, R. S., Porat, Y., Munster, M., Voloshin, T., Blatt, R., Cahal, S., Itzhaki, A., Onn, A., et al. (2014) · Seminars in Oncology · doi:10.1053/j.seminoncol.2014.09.006 · Cited by 132
Review of Neurosurgical Fluorescence Imaging Methodologies
Pogue, B. W., Gibbs‐Strauss, S. L., Valdes, P. A., Samkoe, K. S., Roberts, D. W., & Paulsen, K. D. (2010) · IEEE Journal of Selected Topics in Quantum Electronics · doi:10.1109/jstqe.2009.2034541 · Cited by 127
Size-Dependent Dextran Transport across Rat Alveolar Epithelial Cell Monolayers
Matsukawa, Y., Lee, V. H. L., Crandall, E. D., & Kim, K.-J. (1997) · Journal of Pharmaceutical Sciences · doi:10.1021/js960352x · Cited by 114
Colditz, M., & Jeffree, R. L. (2012) · Journal of Clinical Neuroscience · doi:10.1016/j.jocn.2012.03.009 · Cited by 111
Biological activity of tumor-treating fields in preclinical glioma models
Silginer, M., Weller, M., Stupp, R., & Roth, P. (2017) · Cell Death & Disease · doi:10.1038/cddis.2017.171 · Cited by 111
Kanner, A. A., Wong, E. T., Villano, J. L., & Ram, Z. (2014) · Seminars in Oncology · doi:10.1053/j.seminoncol.2014.09.008 · Cited by 108
An Overview of Sub-Cellular Mechanisms Involved in the Action of TTFields
Tuszynski, J., Wenger, C., Friesen, D., & Preto, J. (2016) · International Journal of Environmental Research and Public Health · doi:10.3390/ijerph13111128 · Cited by 95
Kim, E. H., Kim, Y. J., Song, H. S., Jeong, Y. K., Lee, J. Y., Sung, J., Yoo, S., & Yoon, M. (2016) · Oncotarget · doi:10.18632/oncotarget.11407 · Cited by 86
Voloshin, T., Munster, M., Blatt, R., Shteingauz, A., Roberts, P. C., Schmelz, E. M., Giladi, M., Schneiderman, R. S., Zeevi, E., Porat, Y., et al. (2016) · International Journal of Cancer · doi:10.1002/ijc.30406 · Cited by 77
Schneiderman, R. S., Shmueli, E., Kirson, E. D., & Palti, Y. (2010) · BMC Cancer · doi:10.1186/1471-2407-10-229 · Cited by 65
Porat, Y., Giladi, M., Schneiderman, R. S., Blat, R., Shteingauz, A., Zeevi, E., Munster, M., Voloshin, T., Kaynan, N., Tal, O., et al. (2017) · Journal of Visualized Experiments · doi:10.3791/55820 · Cited by 65
Andrade, R., Crisol, L., Prado, R., Boyano, M. D., Arluzea, J., & Aréchaga, J. (2009) · Biology of the Cell · doi:10.1042/bc20090077 · Cited by 54
Clark, P. A., Gaal, J. T., Strebe, J. K., Pasch, C. A., Deming, D. A., Kuo, J. S., & Robins, H. I. (2016) · Journal of Clinical Neuroscience · doi:10.1016/j.jocn.2016.10.042 · Cited by 45
Effects of high-frequency electric fields on the living cell
Füredi, A. A., & Ohad, I. (1964) · Biochimica et Biophysica Acta (BBA) - Specialized Section on Biophysical Subjects · doi:10.1016/0926-6577(64)90032-4 · Cited by 44
Modeling Tumor Treating Fields (TTFields) application in single cells during metaphase and telophase
Wenger, C., Giladi, M., Bomzon, Z., Salvador, R., Basser, P. J., & Miranda, P. C. (2015) · 2015 37th Annual International Conference of the IEEE Engineering in Medicine and Biology Society (EMBC) · doi:10.1109/embc.2015.7319977 · Cited by 44
Synergistic inhibition of glioma cell proliferation by Withaferin A and tumor treating fields
Chang, E., Pohling, C., Beygui, N., Patel, C. B., Rosenberg, J., Ha, D. H., & Gambhir, S. S. (2017) · Journal of Neuro-Oncology · doi:10.1007/s11060-017-2534-5 · Cited by 39
Self-citationDive, C., Watson, J. E. M., & Workman, P. (1990) · Cytometry · doi:10.1002/cyto.990110205 · Cited by 38
Sasportas, L. S., & Gambhir, S. S. (2014) · PLoS ONE · doi:10.1371/journal.pone.0086759 · Cited by 34
Self-citationAn (2002) · doi:10.1562/0031-8655(2002)076 · Cited by 24
Abstract LB-B06: Functionally defined therapeutic targets in diffuse intrinsic pontine glioma
Grasso, C. S. (2015) · Molecular Cancer Therapeutics · doi:10.1158/1535-7163.targ-15-lb-b06 · Cited by 7
Ram, Z., Kim, C., Nicholas, G. A., & Toms, S. A. (2017) · Neuro-Oncology · doi:10.1093/neuonc/nox168.022 · Cited by 7
First steps to creating a platform for high throughput simulation of TTFields
Hershkovich, H. S., Bomzon, Z., Wenger, C., Urman, N., Chaudhry, A., García‐Carracedo, D., Kirson, E. D., Weinberg, U., Wasserman, Y., & Palti, Y. (2016) · Annual International Conference of the IEEE Engineering in Medicine and Biology Society (EMBC) · doi:10.1109/embc.2016.7591203 · Cited by 6
Introduction to the special issue on ultrasound contrast agents and targeted drug delivery
Bouakaz, A., & Dayton, P. A. (2013) · IEEE Transactions on Ultrasonics Ferroelectrics and Frequency Control · doi:10.1109/2013.2532 · Cited by 5
TMIC-38. MODULATION OF CANCER CELL METABOLISM AND IMMUNE PHENOTYPE BY TTFIELDS
Wong, E. T., Fong, J., Xu, O., & Swanson, K. D. (2017) · Neuro-Oncology · doi:10.1093/neuonc/nox168.1026 · Cited by 1
Research works printed but not linked: 6
- Diego UoC-S. SRX2006411: GBM39 EC naive. 2016. https://www.ncbi.nlm.nih.gov/sra/SRX2006411[accn]
- JoVE Science Education Database. Basic Methods in Cellular and Molecular Biology (Passaging Cells, JoVE, Cambridge, MA, 2018).
- Strober, W. in Current Protocols in Immunology (John Wiley and Sons, New York, 2001), Appendix 3: Appendix3A.
- Giladi, M. et al. Mitotic spindle disruption by alternating electric fields leads to improper chromosome segregation and mitotic catastrophe in cancer cells. Sci. Rep. 5, 18046 (2015). · DOI · Paper page
- Pubchem. Molecular weight of firefly d-Luciferin. 2017. https://pubchem.ncbi.nlm.nih.gov/compound/D-Luciferin
- Pubchem. Molecular weight of coelentrazine. 2017. https://pubchem.ncbi.nlm.nih.gov/compound/2762722
Cited by
Sorted by citations
Glioblastoma multiforme (GBM): An overview of current therapies and mechanisms of resistance
Wu, W. E., Klockow, J., Zhang, M., Lafortune, F., Chang, E., Jin, L., Wu, Y., & Daldrup-Link, H. E. (2021) · Pharmacological Research · doi:10.1016/j.phrs.2021.105780 · Cited by 877
Self-citationPrognostic and Predictive Biomarkers in Gliomas
Śledzińska, P., Bebyn, M. G., Furtak, J., Kowalewski, J., & Lewandowska, M. A. (2021) · International Journal of Molecular Sciences · doi:10.3390/ijms221910373 · Cited by 363
Tumour treating fields therapy for glioblastoma: current advances and future directions
Rominiyi, O., Vanderlinden, A., Clenton, S. J., Bridgewater, C. H., Al-Tamimi, Y., & Collis, S. J. (2020) · British Journal of Cancer · doi:10.1038/s41416-020-01136-5 · Cited by 342
Glioblastoma Therapy: Past, Present and Future
Obrador, E., Moreno-Murciano, P., Oriol-Caballo, M., López-Blanch, R., Pineda, B., Gutiérrez-Arroyo, J., Loras, A., Gonzalez-Bonet, L., Martinez-Cadenas, C., Estrela, J., et al. (2024) · International Journal of Molecular Sciences · doi:10.3390/ijms25052529 · Cited by 271
Ceresoli, G. L., Aerts, J. G., Dziadziuszko, R., Ramlau, R., Cedres, S., van Meerbeeck, J. P., Mencoboni, M., Planchard, D., Chella, A., Crinò, L., et al. (2019) · The Lancet Oncology · doi:10.1016/s1470-2045(19)30532-7 · Cited by 164
Metadata
- Authors
- Chang, E., Patel, C. B., Pohling, C., Young, C., Song, J., Flores, T. A., Zeng, Y., Joubert, L.-M., Arami, H., Natarajan, A., Sinclair, R., & Gambhir, S. S.
- Affiliations
- Stanford Medicine (US)
- Stellenbosch University (ZA)
- Corresponding author
- Gambhir, Sanjiv S.
- ORCID
- Venue
- Cell Death Discovery
- Published
- 2018-12-05
- Volume
- 4
- Issue
- 1
- Pages
- 113-113
- ISSN
- 2058-7716 (ISSN-L)
- PMC
- PMC6281619
- OpenAlex
- W2902560780
- Cited by
- 137
- References
- 57
- Citations by year
- 2026: 9 · 2025: 13 · 2024: 26 · 2023: 25 · 2022: 24 · 2021: 21 · 2020: 17 · 2019: 2
- FWCI
- 5.67
- Type
- journal article
- Language
- en
- Open access
- gold
- doi.org
- Locations
- Cell Death Discovery (publishedVersion, cc-by)
- Europe PMC (PubMed Central) (publishedVersion, other-oa)
- PubMed Central (publishedVersion, cc-by)
- PubMed (publishedVersion)
- DOAJ (DOAJ: Directory of Open Access Journals) (submittedVersion)
- Funders
- Ben and Catherine Ivy Foundation
- Ludwig Institute for Cancer Research
- Novocure
- National Cancer Institute (T32CA009695)
- Stanford Cancer Institute
- Topics
- Health Sciences › Medicine › Oncology › Glioma Diagnosis and Treatment
- Life Sciences › Biochemistry, Genetics and Molecular Biology › Biotechnology › Microbial Inactivation Methods
- Life Sciences › Biochemistry, Genetics and Molecular Biology › Biophysics › Electromagnetic Fields and Biological Effects
- Keywords
- tumor treating fields, glioblastoma, membrane permeability, AC electric field, 5-aminolevulinic acid, chemotherapy delivery, combination therapy, bioluminescence
About these checks
Registry, retraction, Cites and statistics results are computed, not judged, with one exception: a printed reference that no index lists is read once by a model before it counts as a citation error. Claims are extracted by a model and kept only when their quote appears verbatim in the text; each cited source is then checked, with a model’s help, for whether it says what the claim relies on. Those verdicts can be wrong — read the claim’s quote and the cited source before relying on one.
A language model drew the claims from the paper on 2026-10-10, under version 3 of the claim definition (model deepseek-v4.1-flash, prompt extract-v3).
A second model labelled each claim on 2026-10-10 (model jev-1.13-20260917, definition revision gold-guideline-v0.2).
Statistics and arithmetic are recomputed, not judged.
Confidence bands are shown only for fields calibrated on our annotated test set. None is calibrated yet, so no band is shown.
What counts as a claim ›How we measure confidence ›How we check this ›
Are you an author, or do you see a problem with this page? Request a review
