

The DOI matches its Crossref record; 62 of the 62 references it cites were found in a registry or an index.
Tumor-associated B-cells induce tumor heterogeneity and therapy resistance
Open accessAbstract
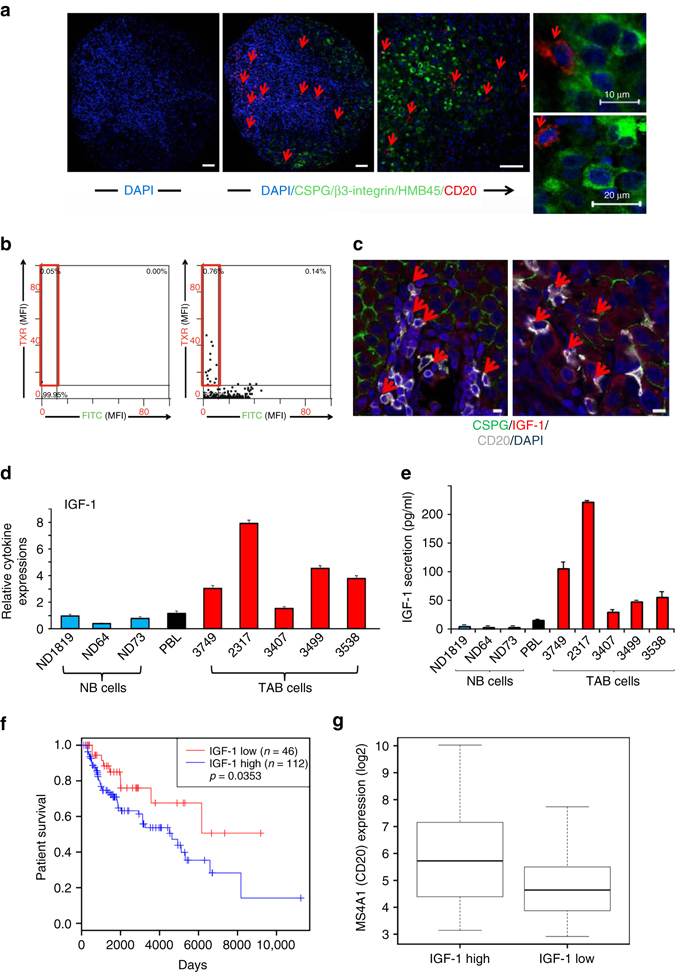
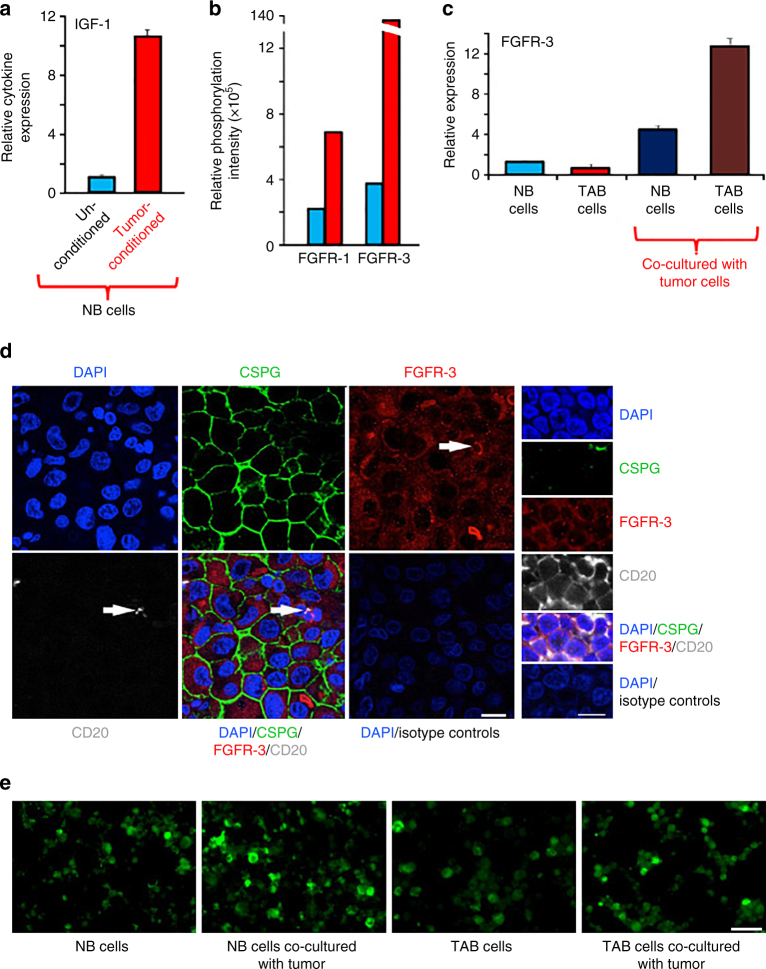
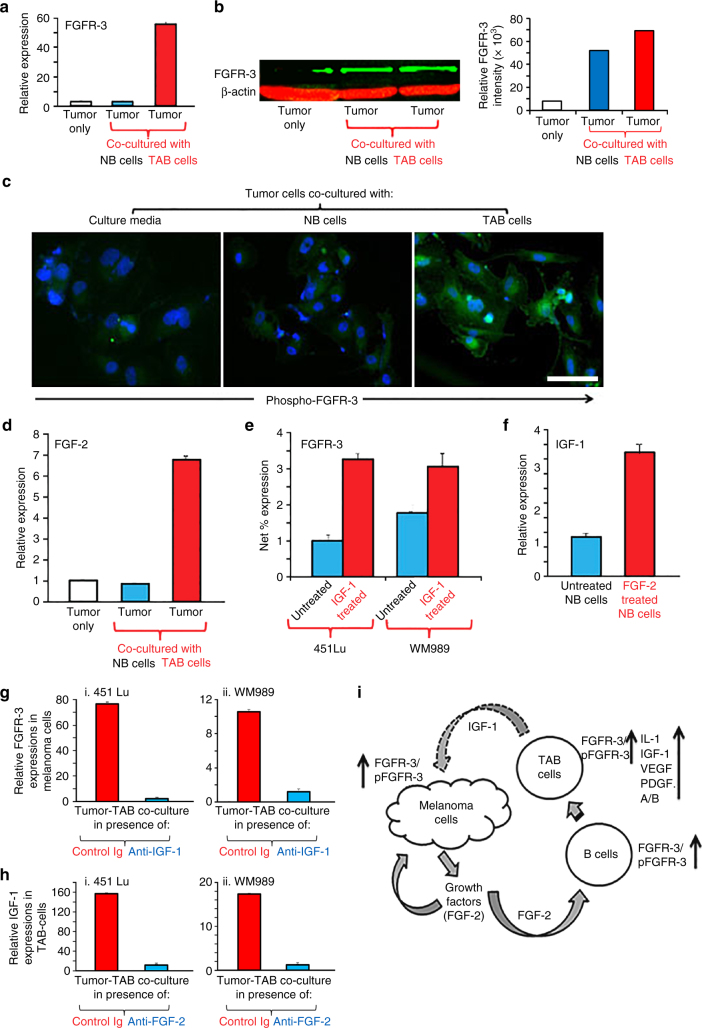
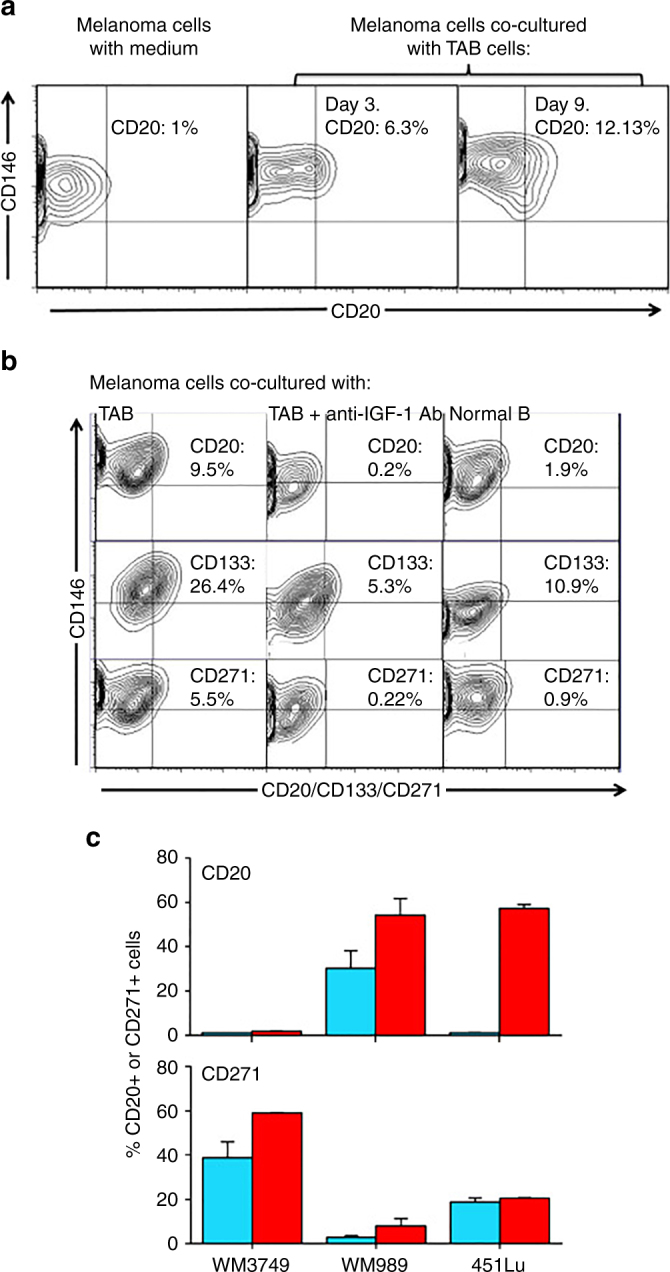
are highly effective but responses are often short-lived due to the emergence of drug-resistant tumor subpopulations. We describe here a mechanism of acquired drug resistance through the tumor microenvironment, which is mediated by human tumor-associated B cells. Human melanoma cells constitutively produce the growth factor FGF-2, which activates tumor-infiltrating B cells to produce the growth factor IGF-1. B-cell-derived IGF-1 is critical for resistance of melanomas to BRAF and MEK inhibitors due to emergence of heterogeneous subpopulations and activation of FGFR-3. Consistently, resistance of melanomas to BRAF and/or MEK inhibitors is associated with increased CD20 and IGF-1 transcript levels in tumors and IGF-1 expression in tumor-associated B cells. Furthermore, first clinical data from a pilot trial in therapy-resistant metastatic melanoma patients show anti-tumor activity through B-cell depletion by anti-CD20 antibody. Our findings establish a mechanism of acquired therapy resistance through tumor-associated B cells with important clinical implications.Resistance to BRAFV600E inhibitors often occurs in melanoma patients. Here, the authors describe a potential mechanism of acquired drug resistance mediated by tumor-associated B cells-derived IGF-1.
Overview
The claims and statistics of this paper haven’t been checked yet.
Run the check — free, no account needed. It reads the open-access text and checks the sources it cites.
Integrity signals
Registry
Cites
Statistics
Figures
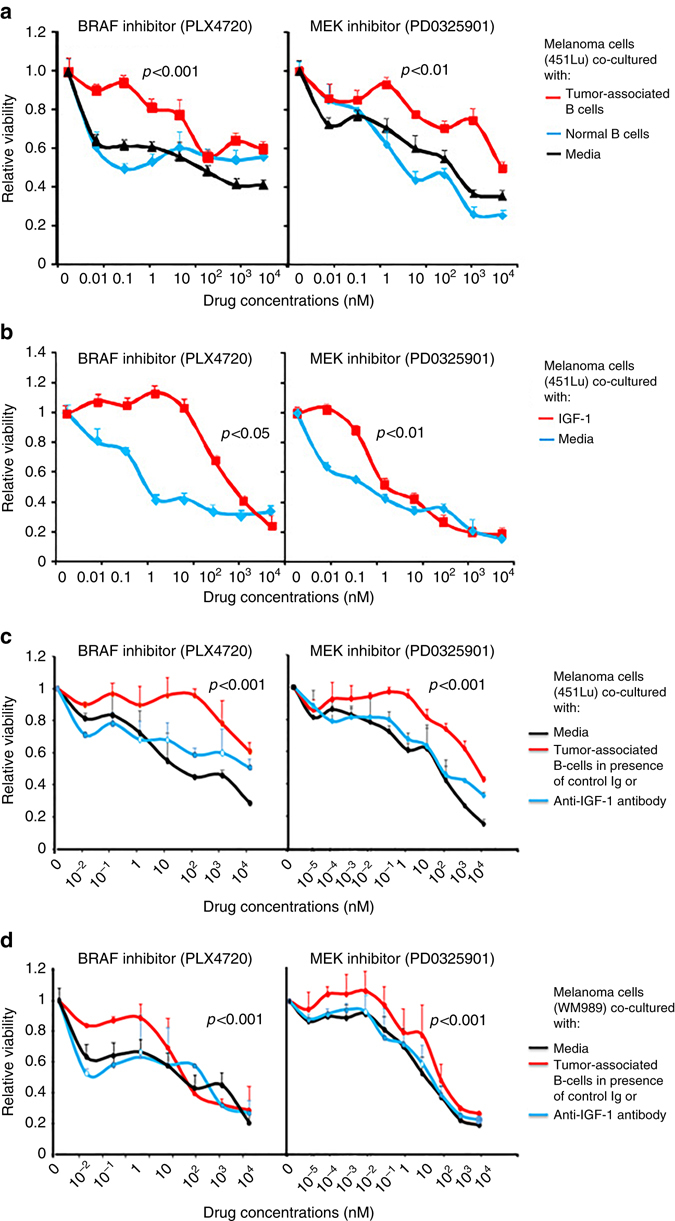
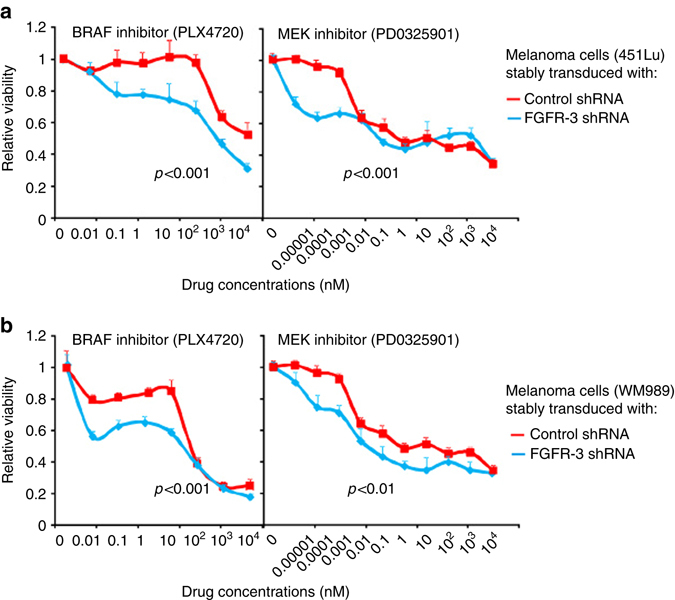
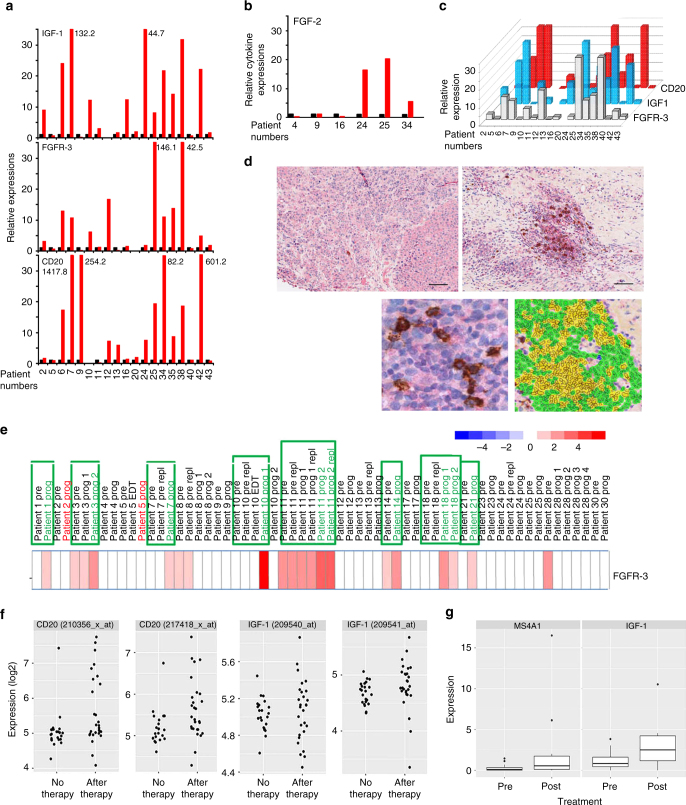
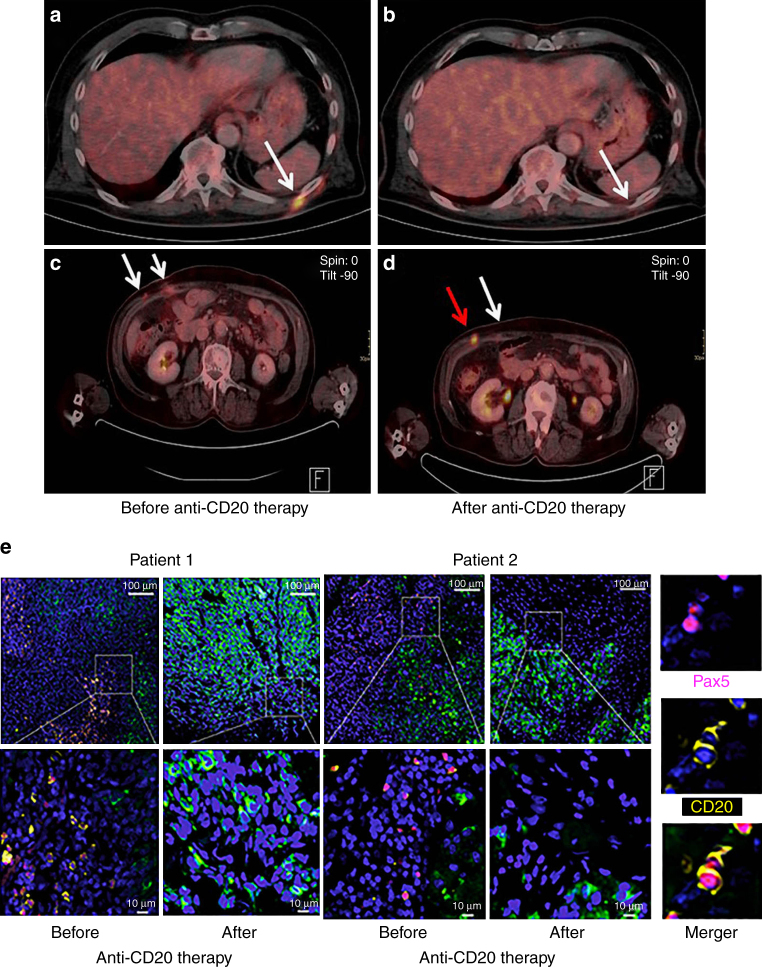
Verification
Claims the paper makes
The claims and statistics of this paper haven’t been checked yet.
Run the check — free, no account needed. It reads the open-access text and checks the sources it cites.
Claims other papers make about this one
Each is checked against this paper’s own text: does it say what the citing paper says it does?
In the citing paper
“Moreover, tumor-associated B cells in melanoma are involved in drug resistance and retain a pro-tumorigenic property in part through insulin-like growth factor-I secretion.86”
From Autoimmune diseases and immune-checkpoint inhibitors for cancer therapy: Review of the literature and personalized risk-based prevention strategy (2020) · cites this paper as [86]
Self-check
Percentages, sums and reported differences re-computed from the paper’s own numbers.
The self-check needs the paper’s full text.
Citations
Cites
PD-1 and PD-L1 Immune Checkpoint Blockade to Treat Breast Cancer
Hartkopf, A. D., Taran, F., Wallwiener, M., Walter, C. B., Krämer, B., Grischke, E., & Brucker, S. Y. (2016) · Breast Care · doi:10.1159/000453569 · Cited by 30,989
New response evaluation criteria in solid tumours: revised RECIST guideline (version 1.1)
Eisenhauer, E. A., Therasse, P., Bogaerts, J., Schwartz, L. H., Sargent, D., Ford, R., Dancey, J., Arbuck, S., Gwyther, S., Mooney, M., et al. (2009) · European Journal of Cancer · doi:10.1016/j.ejca.2008.10.026 · Cited by 29,534
featureCounts: an efficient general purpose program for assigning sequence reads to genomic features
Liao, Y., Smyth, G. K., & Shi, W. (2014) · Bioinformatics · doi:10.1093/bioinformatics/btt656 · Cited by 27,219
Final Version of 2009 AJCC Melanoma Staging and Classification
Balch, C. M., Gershenwald, J. E., Soong, S.-J., Thompson, J. F., Atkins, M. B., Byrd, D. R., Buzaid, A. C., Cochran, A. J., Coit, D. G., Ding, S., et al. (2009) · Journal of Clinical Oncology · doi:10.1200/jco.2009.23.4799 · Cited by 4,653
Accessories to the Crime: Functions of Cells Recruited to the Tumor Microenvironment
Hanahan, D., & Coussens, L. M. (2012) · Cancer Cell · doi:10.1016/j.ccr.2012.02.022 · Cited by 4,632
Wolchok, J. D., Hoos, A., O'Day, S. J., Weber, J. S., Hamid, O., Lebbé, C., Maio, M., Binder, M., Bohnsack, O., Nichol, G. M., et al. (2009) · Clinical Cancer Research · doi:10.1158/1078-0432.ccr-09-1624 · Cited by 3,214
Influence of tumour micro-environment heterogeneity on therapeutic response
Junttila, M. R., & de Sauvage, F. J. (2013) · Nature · doi:10.1038/nature12626 · Cited by 2,694
lumi : a pipeline for processing Illumina microarray
Du, P., Kibbe, W. A., & Lin, S. M. (2008) · Bioinformatics · doi:10.1093/bioinformatics/btn224 · Cited by 2,028
The FGF family: biology, pathophysiology and therapy
Beenken, A., & Mohammadi, M. (2009) · Nature Reviews Drug Discovery · doi:10.1038/nrd2792 · Cited by 1,945
Tumour micro-environment elicits innate resistance to RAF inhibitors through HGF secretion
Straussman, R., Morikawa, T., Shee, K., Barzily-Rokni, M., Qian, Z. R., Du, J., Davis, A., Mongare, M. M., Gould, J., Frederick, D. T., et al. (2012) · Nature · doi:10.1038/nature11183 · Cited by 1,771
Self-citation
Cited by
Sorted by citations
Items 101–151 of 151
Sharma, N., Rájová, J., Mermelekas, G., Thrane, K., Lundeberg, J., Shamikh, A., Vikström, S., Babačić, H., Jensdottir, M., Lehtiö, J., et al. (2025) · Translational Oncology · doi:10.1016/j.tranon.2025.102468 · Cited by 6
Nanomedicines as Multifunctional Modulators of Melanoma Immune Microenvironment
Carreira, B., Acúrcio, R. C., Matos, A. I., Peres, C., Pozzi, S., Vaskovich‐Koubi, D., Kleiner, R., Bento, M., Satchi‐Fainaro, R., & Florindo, H. F. (2020) · Advanced Therapeutics · doi:10.1002/adtp.202000147 · Cited by 6
Khuda‐Bukhsh, A. R., Saha, S. K., Das, S., & Saha, S. S. (2021) · Elsevier eBooks · doi:10.1016/b978-0-12-819547-5.00018-3 · Cited by 6
Role of fibrosarcoma-induced CD11b+ myeloid cells and tumor necrosis factor-α in B cell responses
Wang, Z., Liu, Y., Peng, L., Till, B. G., Liao, Y., Yuan, S., Yan, X., Chen, L., Fu, Q., & Qin, Z. (2022) · Oncogene · doi:10.1038/s41388-022-02187-z · Cited by 8
Ligeiro, D., Rao, M., Maia, A., Castillo-Martín, M., Antonio Lopez-beltran, B., & Maeurer, M. J. (2020) · Advances in experimental medicine and biology · doi:10.1007/978-3-030-49270-0_10 · Cited by 5
IRRS, an Immune-Cell-Pair-Based Prognosis Model for Cutaneous Melanoma
Li, M., Long, X., Bu, W., Zhang, G., Deng, G., Liu, Y., Su, J., Huang, K., & Zhao, S. (2022) · Frontiers in Immunology · doi:10.3389/fimmu.2023.1112181 · Cited by 6
Retraction Note: IspH inhibitors kill Gram-negative bacteria and mobilize immune clearance
Singh, K. S., Sharma, R., Reddy, P. A. N., Vonteddu, P., Good, M., Sundarrajan, A., Choi, H., Muthumani, K., Kossenkov, A. V., Goldman, A. R., et al. (2021) · Nature · doi:10.1038/s41586-021-03961-x · Cited by 5
RetractedDasatinib Resensitizes MAPK Inhibitor Efficacy in Standard-of-Care Relapsed MelanomasPreprint
Rebecca, V. W., Xiao, M., Kossenkov, A. V., Godok, T., Brown, G. S., Fingerman, D. F., Alicea, G. M., Wei, M., Ji, H., Bravo, J., et al. (2023) · bioRxiv (Cold Spring Harbor Laboratory) · doi:10.1101/2023.01.20.524923 · Cited by 5
Booth, L. H., Mahmood, M., Chen, X., Jackow, J., Tsoka, S., Tull, T. J., & Karagiannis, S. N. (2026) · OncoImmunology · doi:10.1080/2162402x.2026.2638620 · Cited by 4
The hypoxic tumor microenvironment: Functional and metabolic reprogramming of key immune populations
Ojaroodi, A. F., Shokravi, S., Eskandarzadeh, S., Ghahremanzadeh, A., Alizadeh, F., Amirikar, F., Mobayen, G., Mahrooghi, D., Lahouty, M., Shamsasenjan, K., et al. (2026) · Pathology - Research and Practice · doi:10.1016/j.prp.2026.156443 · Cited by 5
Zhang, J., Späth, S. S., Weissman, S. M., & Katz, S. G. (2019) · Methods in molecular biology · doi:10.1007/978-1-0716-0203-4_10 · Cited by 3
Systematic evaluation of intratumoral and peripheral BCR repertoires in three cancersPreprint
Krasik, S. V., Bryushkova, E. A., Sharonov, G. V., Myalik, D. S., Shurganova, E. V., Komarov, D. V., Shagina, I. A., Shpudeiko, P. S., Turchaninova, M. A., Vakhitova, M. T., et al. (2024) · eLife · doi:10.7554/elife.89506 · Cited by 3
Li, I., Huo, Y., Yang, T., Gunawan, H., Alexandrov, L. B., & Zage, P. E. (2025) · Cancer Drug Resistance · doi:10.20517/cdr.2024.208 · Cited by 4
Zhang, P., Liu, Y., Tao, Z., Zhang, X., Wang, Y., Zhang, H., Li, J., Yang, Z., Xiong, K., Duan, S., et al. (2025) · Scientific Reports · doi:10.1038/s41598-025-10055-5 · Cited by 2
Fibroblast growth factor 2 in the hotbed of rheumatoid arthritis pathogenesis
Illanad, G. H., Rithvik, A., & Rasool, M. (2025) · International Immunopharmacology · doi:10.1016/j.intimp.2025.115778 · Cited by 2
Current and emerging treatment options for BRAFV600-mutant melanoma
Javaid, A., Peres, T., Pozas, J., Thomas, J. M., & Larkin, J. (2025) · Expert Review of Anticancer Therapy · doi:10.1080/14737140.2025.2451722 · Cited by 3
Multifaceted function of B cells in tumorigenesis
Kang, N., Duan, Q., Min, X., Li, T., Li, Y., Gao, J., & Liu, W. (2025) · Frontiers of Medicine · doi:10.1007/s11684-025-1127-5 · Cited by 2
Fish cancer and its assistance to human cancer research: A fresh perspective
Dan, H., Wang, W., Chen, X., Goda, M. N., Kishta, M. S., & Cao, Q. (2025) · Comparative Biochemistry and Physiology Part C Toxicology & Pharmacology · doi:10.1016/j.cbpc.2025.110369 · Cited by 2
Fourneaux, C., & Dubois, B. (2018) · médecine/sciences · doi:10.1051/medsci/2018219 · Cited by 2
Palladium-based nanoparticles for the treatment of advanced melanoma
(2019) · Journal of the American Academy of Dermatology · doi:10.1016/j.jaad.2019.06.380 · Cited by 2
The Role of B Cells in Tumorigenesis and Immunotherapy
Yin, G., Qi, L. N., Kang, N., Li, T., Li, C., Liu, Y. E., Ye, J., & Liu, W. (2026) · Immune Network · doi:10.4110/in.2026.26.e14 · Cited by 1
Uncovering the Intricate and Heterogeneous Cellular Microenvironment of Cutaneous Melanoma
Țăpoi, D. A., Lambrescu, I. M., Manole, C. G., Gaina, G. F., & Ceafalan, L. C. (2026) · Medicina · doi:10.3390/medicina62040739 · Cited by 2
Advances and prospects in cell therapy for cancer: explorations from T cells to stem cells
Zi, G., Zhang, L., Zhou, L., Liu, X., Wang, L., Zhou, R., Zheng, P., Wei, J., Chen, X., & Wei, S. (2026) · Signal Transduction and Targeted Therapy · doi:10.1038/s41392-026-02780-8 · Cited by 1
Tan, J., Wen, T., Liu, J. S., & Ru, X. (2026) · Journal of Hematology & Oncology · doi:10.1186/s13045-026-01828-0 · Cited by 1
Comprehensive analysis of STAT family members as prognostic markers in human breast cancer
(2022) · European Journal of Gynaecological Oncology · doi:10.22514/ejgo.2022.043 · Cited by 1
Systematic evaluation of intratumoral and peripheral BCR repertoires in three cancers
Krasik, S. V., Bryushkova, E. A., Sharonov, G. V., Myalik, D. S., Shurganova, E. V., Komarov, D. V., Shagina, I. A., Shpudeiko, P. S., Turchaninova, M. A., Vakhitova, M. T., et al. (2025) · eLife · doi:10.7554/elife.89506.4 · Cited by 1
The role and mechanism of tumor-associated regulatory B cell
Wang, Z., Liu, R., & Chu, Y. (2025) · Chinese Science Bulletin (Chinese Version) · doi:10.1360/tb-2024-1397 · Cited by 1
Systematic evaluation of intratumoral and peripheral BCR repertoires in three cancersPreprint
Krasik, S. V., Bryushkova, E. A., Sharonov, G. V., Myalik, D. S., Shurganova, E. V., Komarov, D. V., Shagina, I. A., Shpudeiko, P. S., Turchaninova, M. A., Vakhitova, M. T., et al. (2024) · eLife · doi:10.7554/elife.89506.1 · Cited by 1
Systematic evaluation of intratumoral and peripheral BCR repertoires in three cancersPreprint
Krasik, S. V., Bryushkova, E. A., Sharonov, G. V., Myalik, D. S., Shurganova, E. V., Komarov, D. V., Shagina, I. A., Shpudeiko, P. S., Turchaninova, M. A., Vakhitova, M. T., et al. (2025) · eLife · doi:10.7554/elife.89506.3 · Cited by 1
Targeted Therapies for BRAF-Mutant Metastatic Melanoma
Johnson, D. B., Dummer, R., Flaherty, K. T., & Smalley, K. S. M. (2018) · Springer eBooks · doi:10.1007/978-3-319-46029-1_40-1
Gene dosage effects of polyA track engineered hypomorphsPreprint
Powell, G., Pavlovic-Djuranovic, S., & Djuranovic, S. (2021) · bioRxiv · doi:10.1101/2021.02.10.430645
The indoleamine 2,3 dioxygenase pathway drives intratumoral B cell maintenancePreprint
Johnson, B. A., Aragaki, A. K., Williams, D. M., Rogers, O. C., Mountain, J., Luo, L., Zhang, W., Xian, L., Feng, M., Chia, L., et al. (2021) · bioRxiv (Cold Spring Harbor Laboratory) · doi:10.1101/2021.08.25.456776
Linking the epigonome and transcriptome
Kuijpers, T. (2021) · Research Publications (Maastricht University) · doi:10.26481/dis.20211201tk
Is it Time to Reconsider and Re-Stratergise B Lymphocyte Based Immunotherapy?
Smitha T, A. T. (2022) · Journal of Vaccines Immunology and Immunopathology · doi:10.29011/2575-789x.000166
Targeted Therapies for BRAF-Mutant Metastatic Melanoma
Johnson, D. B., Dummer, R., Flaherty, K. T., & Smalley, K. S. M. (2020) · Springer eBooks · doi:10.1007/978-3-030-05070-2_40
Role of Immune Cells in the Tumor Microenvironment
Ramírez-Salazar, E. G., Schenck, S., & Herlyn, M. (2023) · Springer eBooks · doi:10.1007/978-3-030-80962-1_84-1
Popović, A., Petković, I., Rančić, A., Dimitrijević, A., Brzački, V., Stankov, S. D., Jović, A., & Stojanovic, S. K. (2022) · AFMN Biomedicine · doi:10.5937/afmnai40-40566
Systematic evaluation of intratumoral and peripheral BCR repertoires in three cancersPreprint
Krasik, S. V., Bryushkova, E. A., Sharonov, G. V., Myalik, D. S., Shurganova, E. V., Komarov, D. V., Shagina, I. A., Shpudeiko, P. S., Turchaninova, M. A., Vakhitova, M. T., et al. (2024) · eLife · doi:10.7554/elife.89506.2
B cell-mediated immune tolerance and cancer immune evasion
Ren, D., & Li, Y. (2025) · Elsevier eBooks · doi:10.1016/b978-0-443-14064-8.00045-x
Role of Immune Cells in the Tumor Microenvironment
Ramírez-Salazar, E. G., Schenck, S., & Herlyn, M. (2025) · Springer eBooks · doi:10.1007/978-3-032-00761-2_84
Rebecca, V. W., Xiao, M., Kossenkov, A. V., Godok, T., Brown, G. S., Fingerman, D., Alicea, G. M., Wei, M., Ji, H., Portuallo, M. E., et al. (2026) · iScience · doi:10.1016/j.isci.2026.114669 · Cited by 5
Couillault, C. (2019) · theses.fr (ABES) · doi:10.70675/843d4729zb881z4e85z9bf5z1adbd72f3e7a
Lounici, Y. (2022) · theses.fr (ABES) · doi:10.70675/c6b122dez88bez431czb15az720a90e61462
Immunotherapy in pancreatic cancer: overcoming the challenges of tumor heterogeneity
Nakamura, M., He, Z., Dhulia, R., Manji, G. A., & Reya, T. (2026) · Trends Open · doi:10.1016/j.treopn.2026.04.001
Li, Y., Jiang, Y., Wang, K., Liu, X., Yang, R., Han, L., He, T., Li, N., & Huo, D. (2026) · Chemical Engineering Journal · doi:10.1016/j.cej.2026.180608
B cells in cancer: functions, mechanisms and therapeutic advances
Zhang, H., Cheng, K., Mo, J., Chen, M., Zhou, Z., Wang, Z., Yang, Z., Chen, X., & Zhang, W. (2026) · Signal Transduction and Targeted Therapy · doi:10.1038/s41392-026-02811-4 · Cited by 1
Reprogramming the Melanoma Tumor Microenvironment: From Cellular Crosstalk to Cellular Immunotherapy
Jumaniyazova, E. D., Gantsova, E. A., Казарян, Г. Г., Charyeva, I., & Fatkhudinov, T. (2026) · Cancers · doi:10.3390/cancers18203325
Balke‐Want, H., Theurich, S., Gödel, P., Biedermann, S., Kreuzberg, N., Borchmann, P., Zhang, D., Weiss, L., Dorman, K., Bücklein, V., et al. (2026) · European Journal of Cancer · doi:10.1016/j.ejca.2026.117780
Metadata
- Authors
- Somasundaram, R., Zhang, G., Fukunaga-Kalabis, M., Perego, M., Krepler, C., Xu, X., Wagner, C., Hristova, D., Zhang, J., Tian, T., Wei, Z., Liu, Q., Garg, K., Griss, J., Hards, R., Maurer, M., Hafner, C., Mayerhöfer, M., Karanikas, G., Jalili, A., Bauer-Pohl, V., Weihsengruber, F., Rappersberger, K., Koller, J., Lang, R., Hudgens, C., Chen, G., Tetzlaff, M., Wu, L., Frederick, D. T., Scolyer, R. A., Long, G. V., Damle, M., Ellingsworth, C., Grinman, L., Choi, H., Gavin, B. J., Dunagin, M., Raj, A., Scholler, N., Gross, L., Beqiri, M., Bennett, K., Watson, I., Schaider, H., Davies, M. A., Wargo, J., Czerniecki, B. J., Schuchter, L., Herlyn, D., Flaherty, K., Herlyn, M., & Wagner, S. N.
- Affiliations
- The Wistar Institute (US)
- University of Pennsylvania (US)
- Medical University of Vienna (AT)
- New Jersey Institute of Technology (US)
- Krankenanstalt Rudolfstiftung der Stadt Wien (AT)
- Paracelsus Medical University (AT)
- The University of Texas MD Anderson Cancer Center (US)
- Harvard University (US)
- The University of Sydney (AU)
- SRI International (US)
- Austrian Academy of Sciences (AT)
- McGill University (CA)
- Translational Research Institute (AU)
- Hospital of the University of Pennsylvania (US)
- Corresponding author
- Somasundaram, Rajasekharan
- Herlyn, Meenhard
- Wagner, Stephan N.
- ORCID
- Somasundaram, Rajasekharan
- Zhang, Gao
- Perego, Michela
- Xu, Xiaowei
- Hristova, Denitsa
- Zhang, Jie
- Tian, Tian
- Wei, Zhi
- Liu, Qin
- Garg, Kanika
- Griss, Johannes
- Karanikas, Georgios
- Jalili, Ahmad
- Rappersberger, Klemens
- Lang, Roland
- Hudgens, Courtney
- Tetzlaff, Michael
- Wu, Lawrence
- Frederick, Dennie Tompers
- Scolyer, Richard A.
- Long, Georgina V.
- Damle, Manashree
- Choi, Harry
- Dunagin, Margaret
- Raj, Arjun
- Scholler, Nathalie
- Beqiri, Marilda
- Bennett, Keiryn
- Watson, Ian
- Schaider, Helmut
- Davies, Michael A.
- Wargo, Jennifer
- Czerniecki, Brian J.
- Schuchter, Lynn
- Flaherty, Keith
- Herlyn, Meenhard
- Wagner, Stephan N.
- Venue
- Nature Communications
- Published
- 2017-09-19
- Volume
- 8
- Issue
- 1
- Pages
- 607-607
- ISSN
- 2041-1723 (ISSN-L)
- PMC
- PMC5605714
- OpenAlex
- W2755929010
- Cited by
- 151
- References
- 61
- Citations by year
- 2026: 12 · 2025: 15 · 2024: 8 · 2023: 16 · 2022: 13 · 2021: 27 · 2020: 21 · 2019: 27 · 2018: 11 · 2017: 1
- FWCI
- 6.70
- Type
- journal article
- Language
- en
- Open access
- gold
- doi.org
- Locations
- Nature Communications (publishedVersion, cc-by)
- PubMed Central (publishedVersion, cc-by)
- PubMed (publishedVersion)
- Digital Access to Scholarship at Harvard (DASH) (Harvard University) (submittedVersion, cc-by)
- RePEc: Research Papers in Economics (submittedVersion)
- DOAJ (DOAJ: Directory of Open Access Journals) (submittedVersion)
- DOAJ (DOAJ: Directory of Open Access Journals) (submittedVersion, cc-by-sa)
- Funders
- Dr. Miriam and Sheldon G. Adelson Medical Research Foundation
- Cancer Institute NSW
- Vienna Science and Technology Fund (LS11-045)
- Universität Wien
- Medizinische Universität Wien
- Melanoma Institute Australia
- National Institutes of Health
- Medical Research Council
- National Health and Medical Research Council
- National Cancer Institute (R01CA047159, P01CA114046, P01CA025874, P50CA174523, P30CA010815)
- Topics
- Life Sciences › Biochemistry, Genetics and Molecular Biology › Molecular Biology › Melanoma and MAPK Pathways
- Health Sciences › Medicine › Oncology › Cancer Immunotherapy and Biomarkers
- Life Sciences › Immunology and Microbiology › Immunology › T-cell and B-cell Immunology
- Keywords
- tumor-associated B cells, acquired drug resistance, melanoma, BRAF inhibitors, MEK inhibitors, insulin-like growth factor I, FGF2, FGFR3, tumor heterogeneity, tumor microenvironment, CD20, anti-CD20 monoclonal antibody, B-cell depletion, metastatic melanoma
- MeSH terms
- Antibodies, Monoclonal, Antineoplastic Agents, B-Lymphocytes, Cell Survival, Cisplatin, Humans, Insulin-Like Growth Factor I, Melanoma, Pilot Projects, Skin Neoplasms, Fibroblast Growth Factor 2, Lymphocytes, Tumor-Infiltrating, Paclitaxel, Drug Resistance, Neoplasm, Protein Kinase Inhibitors, Proto-Oncogene Proteins B-raf, Receptor, Fibroblast Growth Factor, Type 3, Tumor Microenvironment, Antibodies, Monoclonal, Humanized, In Vitro Techniques
About these checks
Registry, retraction, Cites and statistics results are computed, not judged, with one exception: a printed reference that no index lists is read once by a model before it counts as a citation error. Claims are extracted by a model and kept only when their quote appears verbatim in the text; each cited source is then checked, with a model’s help, for whether it says what the claim relies on. Those verdicts can be wrong — read the claim’s quote and the cited source before relying on one.
Statistics and arithmetic are recomputed, not judged.
Confidence bands are shown only for fields calibrated on our annotated test set. None is calibrated yet, so no band is shown.
What counts as a claim ›How we measure confidence ›How we check this ›
Are you an author, or do you see a problem with this page? Request a review
