

The DOI matches its Crossref record; 41 of the 42 references it cites were found in a registry or an index.
Room-temperature 2D semiconductor activated vertical-cavity surface-emitting lasers
Open accessAbstract
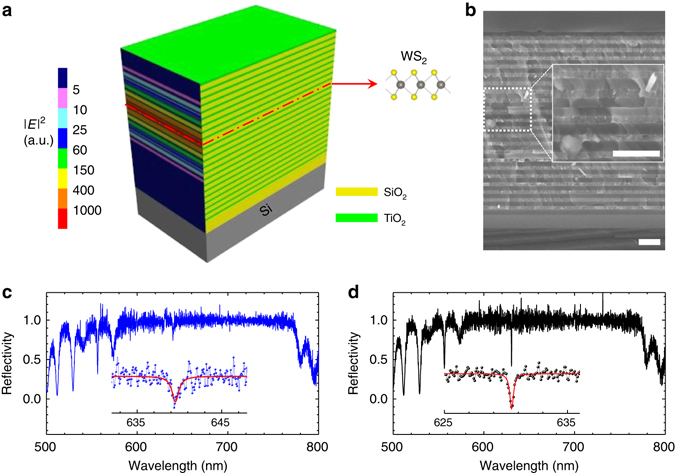
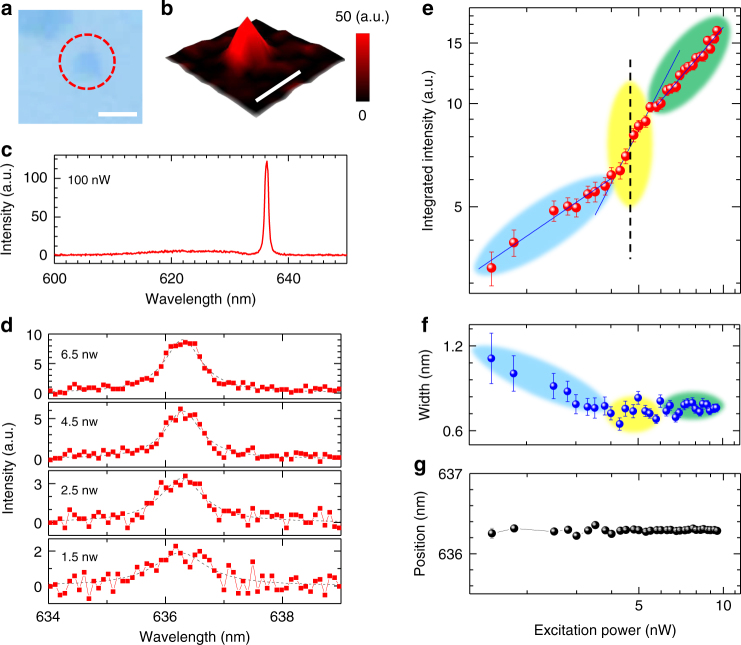
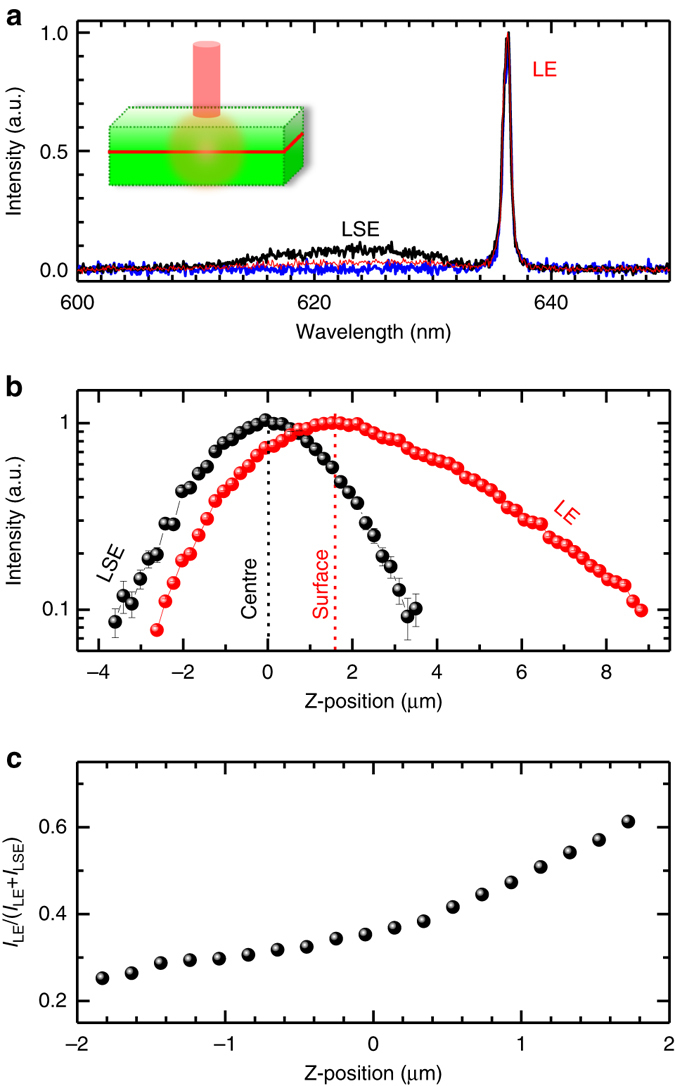
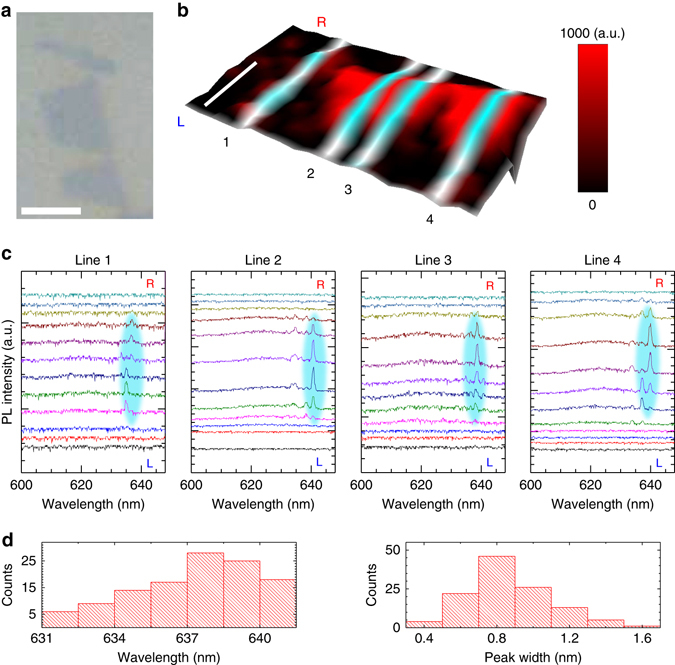
Abstract Two-dimensional (2D) semiconductors are opening a new platform for revitalizing widely spread optoelectronic applications. The realisation of room-temperature vertical 2D lasing from monolayer semiconductors is fundamentally interesting and highly desired for appealing on-chip laser applications such as optical interconnects and supercomputing. Here, we present room-temperature low-threshold lasing from 2D semiconductor activated vertical-cavity surface-emitting lasers (VCSELs) under continuous-wave pumping. 2D lasing is achieved from a 2D semiconductor. Structurally, dielectric oxides were used to construct the half-wavelength-thick cavity and distributed Bragg reflectors, in favour of single-mode operation and ultralow optical loss; in the cavity centre, the direct-bandgap monolayer WS2was embedded as the gain medium, compatible with the planar VCSEL configuration and the monolithic integration technology. This work demonstrates 2D semiconductor activated VCSELs with desirable emission characteristics, which represents a major step towards practical optoelectronic applications of 2D semiconductor lasers.
Overview
The claims and statistics of this paper haven’t been checked yet.
Run the check — free, no account needed. It reads the open-access text and checks the sources it cites.
Integrity signals
Registry
Cites
Statistics
Figures
Verification
Claims the paper makes
The claims and statistics of this paper haven’t been checked yet.
Run the check — free, no account needed. It reads the open-access text and checks the sources it cites.
Claims other papers make about this one
Each is checked against this paper’s own text: does it say what the citing paper says it does?
The cited source says what the claim attributes to it.
In the citing paper
“The possibilities of achieving Bose-Einstein condensation (BEC) [264-267] and polariton lasing [137,268-270], even at room temperature, are some of the current topics in the field of microcavity research.”
From Metal Oxide Thin Films for Advanced Photonic Applications (2026) · cites this paper as [137]
Self-check
Percentages, sums and reported differences re-computed from the paper’s own numbers.
The self-check needs the paper’s full text.
Citations
Cites
Atomically Thin MoS 2 : A New Direct-Gap Semiconductor
Mak, K. F., Lee, C., Hone, J., Shan, J., & Heinz, T. F. (2010) · Physical Review Letters · doi:10.1103/physrevlett.105.136805 · Cited by 15,586
Vahala, K. J. (2003) · Nature · doi:10.1038/nature01939 · Cited by 4,878
Photonics and optoelectronics of 2D semiconductor transition metal dichalcogenides
Mak, K. F., & Shan, J. (2016) · Nature Photonics · doi:10.1038/nphoton.2015.282 · Cited by 3,819
Spin and pseudospins in layered transition metal dichalcogenides
Xu, X., Yao, W., Xiao, D., & Heinz, T. F. (2014) · Nature Physics · doi:10.1038/nphys2942 · Cited by 2,855
Bose–Einstein condensation of exciton polaritons
Kasprzak, J., Richard, M., Kundermann, S., Baas, A., Jeambrun, P., Keeling, J., Marchetti, F., Szymańska, M., André, R., Staehli, J., et al. (2006) · Nature · doi:10.1038/nature05131 · Cited by 2,704
Pimputkar, S., Speck, J. S., DenBaars, S. P., & Nakamura, S. (2009) · Nature Photonics · doi:10.1038/nphoton.2009.32 · Cited by 2,196
Light-emitting diodes by band-structure engineering in van der Waals heterostructures
Withers, F., Pozo-Zamudio, O. D., Mishchenko, A., Rooney, A. P., Gholinia, A., Watanabe, K., Taniguchi, T., Haigh, S. J., Geim, A. K., Tartakovskii, A. I., et al. (2015) · Nature Materials · doi:10.1038/nmat4205 · Cited by 1,690
Electrically tunable excitonic light-emitting diodes based on monolayer WSe2 p–n junctions
Ross, J., Klement, P., Jones, A. M., Ghimire, N., Yan, J., Mandrus, D. G., Taniguchi, T., Watanabe, K., Kitamura, K., Yao, W., et al. (2014) · Nature Nanotechnology · doi:10.1038/nnano.2014.26 · Cited by 1,689
Increase in the extraction efficiency of GaN-based light-emitting diodes via surface roughening
Fujii, T., Gao, Y., Sharma, R. K., Hu, E. L., DenBaars, S. P., & Nakamura, S. (2004) · Applied Physics Letters · doi:10.1063/1.1645992 · Cited by 1,307
Strong light–matter coupling in two-dimensional atomic crystals
Liu, X., Galfsky, T., Sun, Z., Xia, F., Lin, E., Lee, Y., Kéna‐Cohen, S., & Menon, V. M. (2014) · Nature Photonics · doi:10.1038/nphoton.2014.304 · Cited by 1,162
Cited by
Sorted by citations
Perspectives of 2D Materials for Optoelectronic Integration
An, J., Zhao, X., Zhang, Y., Liu, M., Yuan, J., Sun, X., Zhang, Z., Wang, B., Li, S., & Li, D. (2021) · Advanced Functional Materials · doi:10.1002/adfm.202110119 · Cited by 274
Two-dimensional light-emitting materials: preparation, properties and applications
Wang, Z., Qiu, J., Wang, X., Zhang, Z., Chen, Y., Huang, X. B., & Huang, W. (2018) · Chemical Society Reviews · doi:10.1039/c8cs00332g · Cited by 246
Self-citationEnhanced light–matter interaction in two-dimensional transition metal dichalcogenides
Huang, L., Krasnok, A., Alù, A., Yu, Y., Neshev, D. N., & Miroshnichenko, A. E. (2021) · Reports on Progress in Physics · doi:10.1088/1361-6633/ac45f9 · Cited by 229
Liang, Y., Shang, Q., Wei, Q., Zhao, L., Liu, Z., Shi, J. M., Zhong, Y., Chen, J., Gao, Y. N., Li, M., et al. (2019) · Advanced Materials · doi:10.1002/adma.201903030 · Cited by 203
Interlayer exciton laser of extended spatial coherence in atomically thin heterostructures
Paik, E. Y., Zhang, L., Burg, G. W., Gogna, R., Tutuc, E., & Deng, H. (2019) · Nature · doi:10.1038/s41586-019-1779-x · Cited by 200
Metadata
- Authors
- Shang, J., Cong, C., Wang, Z., Peimyoo, N., Wu, L., Zou, C., Chen, Y., Chin, X. Y., Wang, J., Soci, C., Huang, W., & Yu, T.
- Affiliations
- Nanjing Tech University (CN)
- Fudan University (CN)
- Nanyang Technological University (SG)
- Corresponding author
- Huang, Wei
- Yu, Ting
- ORCID
- Venue
- Nature Communications
- Published
- 2017-09-14
- Volume
- 8
- Issue
- 1
- Pages
- 543-543
- ISSN
- 2041-1723 (ISSN-L)
- PMC
- PMC5599555
- OpenAlex
- W2754035931
- Cited by
- 145
- References
- 42
- Citations by year
- 2026: 6 · 2025: 12 · 2024: 18 · 2023: 15 · 2022: 17 · 2021: 18 · 2020: 21 · 2019: 21 · 2018: 17
- FWCI
- 6.81
- Type
- journal article
- Language
- en
- Open access
- gold
- doi.org
- Locations
- Nature Communications (publishedVersion, cc-by)
- Europe PMC (PubMed Central) (publishedVersion, cc-by)
- PubMed Central (publishedVersion, cc-by)
- PubMed (publishedVersion)
- RePEc: Research Papers in Economics (submittedVersion)
- DOAJ (DOAJ: Directory of Open Access Journals) (submittedVersion)
- DOAJ (DOAJ: Directory of Open Access Journals) (submittedVersion, cc-by-sa)
- DR-NTU (Nanyang Technological University) (submittedVersion, cc-by)
- Funders
- Natural Science Foundation of Shanghai (16ZR1402500, BM2012010)
- Synergetic Innovation Center for Organic Electronics and Information Displays (61136003)
- National Natural Science Foundation of China (51173081, 2015CB932200, BM2012010, YX03001, IRT1148, 61136003)
- Ministry of Education of the People's Republic of China (2015CB932200, YX03001, IRT1148)
- Government of Jiangsu Province (BM2012010, YX03001)
- Ministry of Education, India
- Natural Science Foundation of Jiangsu Province (61136003, BM2012010, YX03001)
- Priority Academic Program Development of Jiangsu Higher Education Institutions (YX03001, IRT1148)
- Topics
- Physical Sciences › Materials Science › Materials Chemistry › 2D Materials and Applications
- Physical Sciences › Engineering › Electrical and Electronic Engineering › Semiconductor Lasers and Optical Devices
- Physical Sciences › Engineering › Electrical and Electronic Engineering › Photonic and Optical Devices
- Keywords
- vertical-cavity surface-emitting lasers, two-dimensional semiconductors, monolayer WS2, room-temperature lasing, low-threshold lasing, distributed Bragg reflector, continuous-wave pumping, single-mode operation, monolithic integration
About these checks
Registry, retraction, Cites and statistics results are computed, not judged, with one exception: a printed reference that no index lists is read once by a model before it counts as a citation error. Claims are extracted by a model and kept only when their quote appears verbatim in the text; each cited source is then checked, with a model’s help, for whether it says what the claim relies on. Those verdicts can be wrong — read the claim’s quote and the cited source before relying on one.
Statistics and arithmetic are recomputed, not judged.
Confidence bands are shown only for fields calibrated on our annotated test set. None is calibrated yet, so no band is shown.
What counts as a claim ›How we measure confidence ›How we check this ›
Are you an author, or do you see a problem with this page? Request a review
