Cited by 88

The DOI matches its Crossref record; 8 of the 8 references it cites were found in a registry or an index.

Control of leucine-dependent mTORC1 pathway through chemical intervention of leucyl-tRNA synthetase and RagD interaction

Kim, Jong Hyun, Lee, Chulho, Lee, Minji, Wang, Haipeng, Kim, Kibum, Park, Seung Joon, Yoon, Ina, Jang, Jayun, Zhao, Hanchao, Kim, Hoi Kyoung, Kwon, Nam Hoon, Jeong, Seung Jae, Yoo, Hee Chan, Kim, Jae Hyun, Yang, Jee Sun, Lee, Myeong Youl, Lee, Chang Woo, Yun, Jieun, Oh, Soo Jin, Kang, Jong Soon, Martinis, Susan A., Hwang, Kwang Yeon, Guo, Min, Han, Gyoonhee, Han, Jung Min, Kim, Sunghoon·2017·Nature Communications

Abstract

Leucyl-tRNA synthetase (LRS) is known to function as leucine sensor in the mammalian target of rapamycin complex 1 (mTORC1) pathway. However, the pathophysiological significance of its activity is not well understood. Here, we demonstrate that the leucine sensor function for mTORC1 activation of LRS can be decoupled from its catalytic activity. We identified compounds that inhibit the leucine-dependent mTORC1 pathway by specifically inhibiting the GTPase activating function of LRS, while not affecting the catalytic activity. For further analysis, we selected one compound, BC-LI-0186, which binds to the RagD interacting site of LRS, thereby inhibiting lysosomal localization of LRS and mTORC1 activity. It also effectively suppressed the activity of cancer-associated MTOR mutants and the growth of rapamycin-resistant cancer cells. These findings suggest new strategies for controlling tumor growth that avoid the resistance to existing mTOR inhibitors resulting from cancer-associated MTOR mutations.

Overview

The claims and statistics of this paper haven’t been checked yet.

Run the check — free, no account needed. It reads the open-access text and checks the sources it cites.

A few free checks a day · papers already verified open instantly · results are public

Integrity signals

Registry

Crossref · 10.1038/s41467-017-00785-0

Cites

8 of 8 references verified0 citation errors · 0 not checkable

Statistics

Figures

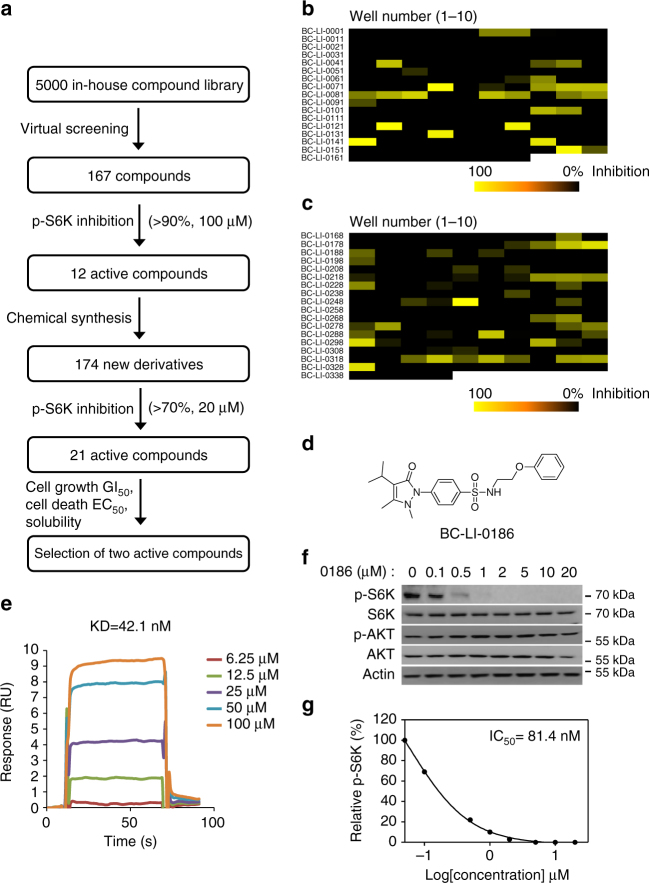
Fig. 1 Identification of the compound inhibiting leucine-induced mTORC1 activity. a Schematic summary of the chemical screening for the mTORC1 inhibitor via LRS. b Level of leucine-induced S6K phosphorylation was monitored with 167 synthetic compounds. From the screening, 12 compounds that inhibited leucine-induced S6K phosphorylation more than 90% at 100 μM were selected. c Level of leucine-induced S6K phosphorylation was monitored with 174 additional synthetic compounds. From the screening, 21 compounds that inhibited leucine-induced S6K phosphorylation more than 70% at 20 μM were selected. Finally, two active compounds were selected based on their effects on mTORC1 activity, cell growth and death, as well as chemical solubility. d Chemical structure of BC-LI-0186. e The binding of BC-LI-0186 to LRS WT was determined by SPR as described in Methods. The inset represents the KD value between LRS WT and BC-LI-0186. f Effect of BC-LI-0186 on S6K phosphorylation was determined by Western blotting. AKT phosphorylation (S473) was monitored as a negative control. g Normalized band intensity of S6K phosphorylation in f was quantified and displayed as line graph. The inset represents the IC50 value of BC-LI-0186
Fig. 1 Identification of the compound inhibiting leucine-induced mTORC1 activity. a Schematic summary of the chemical screening for the mTORC1 inhibitor via LRS. b Level of leucine-induced S6K phosphorylation was monitored with 167 synthetic compounds. From the screening, 12 compounds that inhibited leucine-induced S6K phosphorylation more than 90% at 100 μM were selected. c Level of leucine-induced S6K phosphorylation was monitored with 174 additional synthetic compounds. From the screening, 21 compounds that inhibited leucine-induced S6K phosphorylation more than 70% at 20 μM were selected. Finally, two active compounds were selected based on their effects on mTORC1 activity, cell growth and death, as well as chemical solubility. d Chemical structure of BC-LI-0186. e The binding of BC-LI-0186 to LRS WT was determined by SPR as described in Methods. The inset represents the KD value between LRS WT and BC-LI-0186. f Effect of BC-LI-0186 on S6K phosphorylation was determined by Western blotting. AKT phosphorylation (S473) was monitored as a negative control. g Normalized band intensity of S6K phosphorylation in f was quantified and displayed as line graph. The inset represents the IC50 value of BC-LI-0186CC BY · PubMed Central
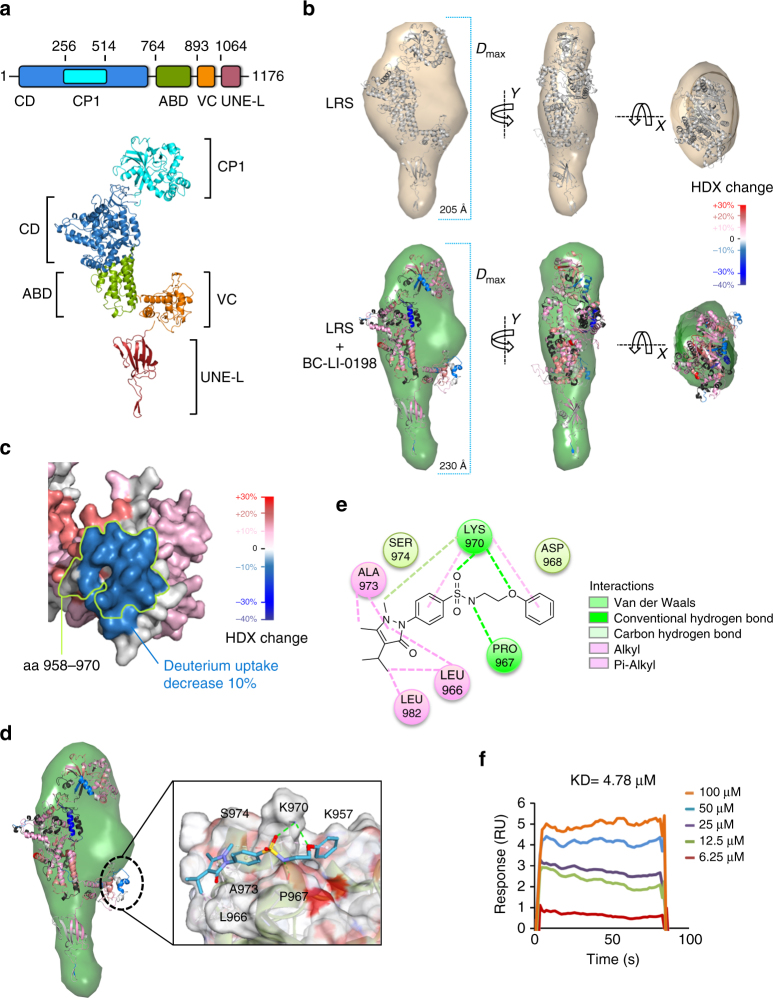
Fig. 2 Determination of BC-LI-0186 docking site. a Structural modeling of human cytoplasmic LRS. Upper: Schematic representation for the domain arrangement of LRS. Lower: The structural model of human LRS, which fit to the LRS SAXS envelope. b SAXS and HDX-MS analysis of the BC-LI-0198 effect on LRS conformation. Structural models of the naked LRS (upper) and BC-LI-0198-bound LRS (lower). D max values of SAXS envelopes were indicated by dashed lines. Colors indicate changes of deuterium uptake compared with naked LRS as shown in the color gradient bar. c Surface representation of deuterium uptake changes of the LRS residues critical for the interaction with RagD upon BC-LI-0198 binding. Difference in deuterium uptake changes was shown in surface colors (color gradient bar). The residues critical for the interaction were circled by lemon line. d Structural modeling of BC-LI-0186 docking position in the pocket of LRS based on HDX-MS analysis. e The chemical binding residues are shown as circles. f The binding of BC-LI-0186 to LRS S974A mutant was determined by SPR as described in Methods. The inset represents the KD value between LRS S974A and BC-LI-0186
Fig. 2 Determination of BC-LI-0186 docking site. a Structural modeling of human cytoplasmic LRS. Upper: Schematic representation for the domain arrangement of LRS. Lower: The structural model of human LRS, which fit to the LRS SAXS envelope. b SAXS and HDX-MS analysis of the BC-LI-0198 effect on LRS conformation. Structural models of the naked LRS (upper) and BC-LI-0198-bound LRS (lower). D max values of SAXS envelopes were indicated by dashed lines. Colors indicate changes of deuterium uptake compared with naked LRS as shown in the color gradient bar. c Surface representation of deuterium uptake changes of the LRS residues critical for the interaction with RagD upon BC-LI-0198 binding. Difference in deuterium uptake changes was shown in surface colors (color gradient bar). The residues critical for the interaction were circled by lemon line. d Structural modeling of BC-LI-0186 docking position in the pocket of LRS based on HDX-MS analysis. e The chemical binding residues are shown as circles. f The binding of BC-LI-0186 to LRS S974A mutant was determined by SPR as described in Methods. The inset represents the KD value between LRS S974A and BC-LI-0186CC BY · PubMed Central
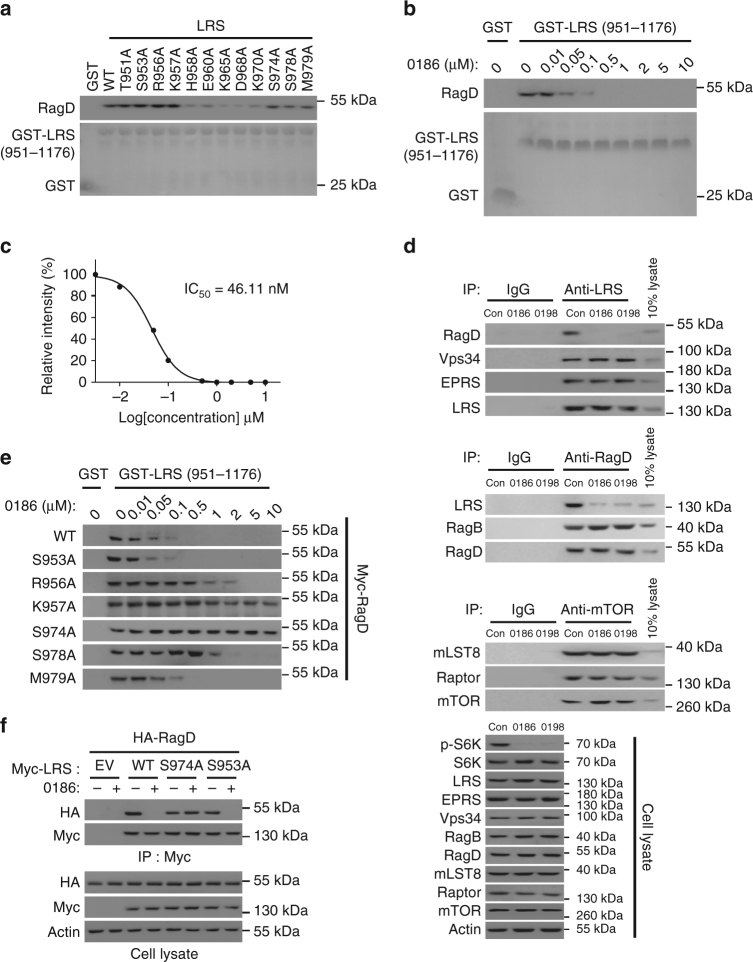
Fig. 3 Chemical inhibition of the LRS–RagD interaction. a Effect of alanine mutations at the indicated residues located in the aa 951–981 peptide region of LRS VC domain on the interaction of LRS and RagD was determined by GST pull-down assays. Purified GST or GST-LRS (aa 951–1176) proteins were incubated with Myc-RagDWT-transfected SW620 cell lysates, precipitated with glutathione sepharose beads and the precipitation of Myc-RagD was analyzed by immunoblotting with anti-Myc antibody. b Effect of BC-LI-0186 on the interaction of LRS WT with RagD was determined by in vitro pull-down of GST-LRS (957–1176 aa) and Myc-RagD. c Relative band intensity of Myc-RagD in b was quantified and displayed as line graph. The inset represents the IC50 value of BC-LI-0186. d Effect of BC-LI-0186 and BC-LI-0198 on the endogenous interaction of LRS with RagD. Cells were treated with 10 μM BC-LI-0186 for 1 h and cell lysates were subjected to immunoprecipitation with anti-LRS, anti-RagD, or anti-mTOR antibodies. Co-immunoprecipitation was confirmed by immunoblotting with the indicated antibodies. e Effect of BC-LI-0186 on the interaction of LRS WT and the indicated mutants with Myc-RagD was determined by co-immunoprecipitation. f SW620 cells were co-transfected with Myc-tagged LRS WT, S974A, or S953A mutant and HA-tagged RagD WT. Cells were treated with 10 μM BC-LI-0186 for 1 h and cell lysates were subjected to immunoprecipitation with anti-Myc antibody. Cellular levels of the indicated proteins were analyzed by immunoblotting with their specific antibodies
Fig. 3 Chemical inhibition of the LRS–RagD interaction. a Effect of alanine mutations at the indicated residues located in the aa 951–981 peptide region of LRS VC domain on the interaction of LRS and RagD was determined by GST pull-down assays. Purified GST or GST-LRS (aa 951–1176) proteins were incubated with Myc-RagDWT-transfected SW620 cell lysates, precipitated with glutathione sepharose beads and the precipitation of Myc-RagD was analyzed by immunoblotting with anti-Myc antibody. b Effect of BC-LI-0186 on the interaction of LRS WT with RagD was determined by in vitro pull-down of GST-LRS (957–1176 aa) and Myc-RagD. c Relative band intensity of Myc-RagD in b was quantified and displayed as line graph. The inset represents the IC50 value of BC-LI-0186. d Effect of BC-LI-0186 and BC-LI-0198 on the endogenous interaction of LRS with RagD. Cells were treated with 10 μM BC-LI-0186 for 1 h and cell lysates were subjected to immunoprecipitation with anti-LRS, anti-RagD, or anti-mTOR antibodies. Co-immunoprecipitation was confirmed by immunoblotting with the indicated antibodies. e Effect of BC-LI-0186 on the interaction of LRS WT and the indicated mutants with Myc-RagD was determined by co-immunoprecipitation. f SW620 cells were co-transfected with Myc-tagged LRS WT, S974A, or S953A mutant and HA-tagged RagD WT. Cells were treated with 10 μM BC-LI-0186 for 1 h and cell lysates were subjected to immunoprecipitation with anti-Myc antibody. Cellular levels of the indicated proteins were analyzed by immunoblotting with their specific antibodiesCC BY · PubMed Central
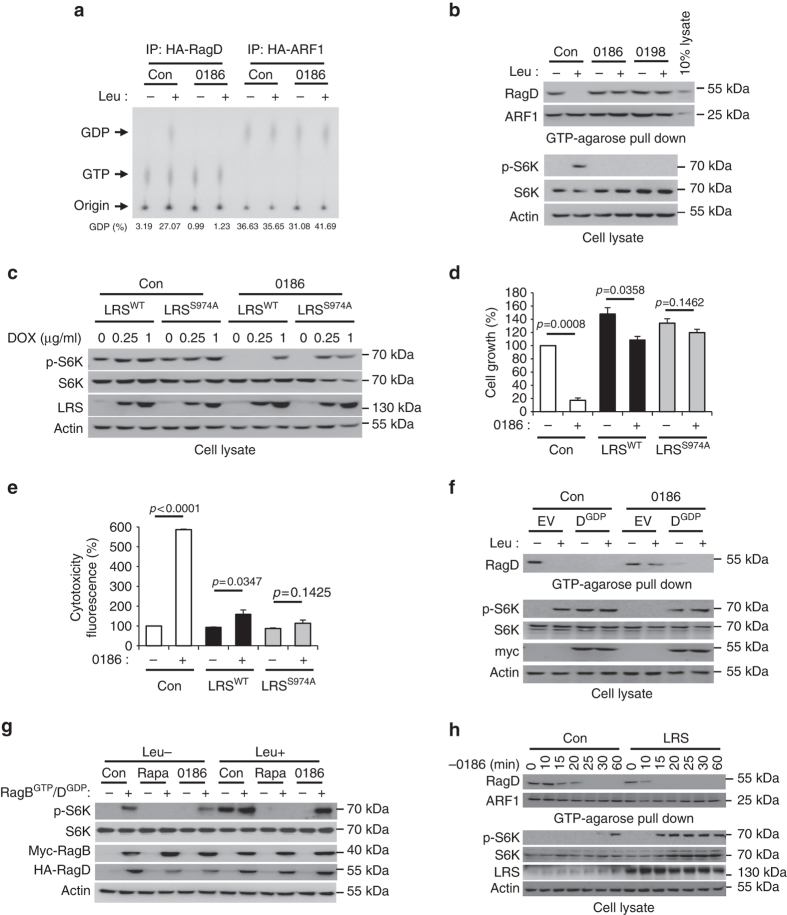
Fig. 4 Chemical validation of LRS role in the control of RagD GTPase and mTORC1. a HA-RagD WT or HA-ARF1 was transfected into SW620 cells. After 24 h, the cells were incubated with 100 μCi/ml 32P-orthophosphate for 8 h, starved for leucine for 90 min, and then re-stimulated with leucine for 10 min. Cells were treated with 10 μM BC-LI-0186 during leucine starvation and re-stimulation. HA-RagD or HA-ARF1 was immunoprecipitated with anti-HA antibody and the bound nucleotides were eluted and analyzed by TLC. GDP% means GDP/(GDP + GTP) × 100. b Effect of BC-LI-0186 and BC-LI-0198 on the leucine-induced change of GTP hydrolysis of RagD. GTP-agarose bead pull-down assays were used to monitor the GTP-bound RagD or ARF1. After cells were treated with 10 μM BC-LI-0186 for 1 h, cell lysates were pulled down with GTP-agarose beads and the precipitated proteins with the beads were analyzed by immunoblotting with anti-RagD and anti-ARF1 antibodies. c Effect of LRS WT or S974A overexpression on S6K phosphorylation inhibited by BC-LI-0186. Inducible LRS WT or S974A-overexpressed SW620 cells were treated with 10 μM BC-LI-0186 for 1 h. Cell lysates were analyzed by immunoblotting with anti-p-S6K (T389), anti-S6K, anti-LRS, and anti-actin antibodies. d Effect of LRS WT or S974A overexpression on BC-LI-0186-induced growth inhibition (d) and cell death (e) (see Supplementary Fig. 5a). The data in Supplementary Fig. 5a were quantified and displayed as bar graphs. The error bars represent mean ± S.D. (n = 3). f Effect of RagDGDP on the BC-LI-0186-dependent inhibition of GTP hydrolysis of RagD and S6K phosphorylation. SW620 cells were transfected with GDP mutant of RagD (S77L) and then starved for leucine for 1 h and re-stimulated with leucine for 10 min in the presence or absence of 10 μM BC-LI-0186. Cell lysates were pulled down with GTP-agarose beads and the precipitated proteins with the beads were analyzed by immunoblotting with anti-RagD antibody. g Effect of RagBGTP/RagDGDP on rapamycin or BC-LI-0186-dependent inhibition of S6K phosphorylation. SW620 cells were co-transfected with GDP mutant of RagD (S77L) and GTP mutant of RagB (Q99L) and then starved for leucine for 1 h and re-stimulated with leucine for 10 min in the presence or absence of 10 μM BC-LI-0186. h Effect of LRS overexpression on the kinetic changes of RagD and S6K phosphorylation that was arrested by BC-LI-0186 pretreatment. SW620 cells were treated with 10 μM BC-LI-0186 for 1 h. Then, cells were incubated with BC-LI-0186-free media for the indicated times. Cell lysates were pulled down with GTP-agarose beads and the precipitated proteins with the beads were analyzed by immunoblotting with anti-RagD or ARF1 antibodies (upper). Cell lysates were analyzed by immunoblotting with their specific antibodies (lower). The error bars represent mean ± S.D. (n = 3)
Fig. 4 Chemical validation of LRS role in the control of RagD GTPase and mTORC1. a HA-RagD WT or HA-ARF1 was transfected into SW620 cells. After 24 h, the cells were incubated with 100 μCi/ml 32P-orthophosphate for 8 h, starved for leucine for 90 min, and then re-stimulated with leucine for 10 min. Cells were treated with 10 μM BC-LI-0186 during leucine starvation and re-stimulation. HA-RagD or HA-ARF1 was immunoprecipitated with anti-HA antibody and the bound nucleotides were eluted and analyzed by TLC. GDP% means GDP/(GDP + GTP) × 100. b Effect of BC-LI-0186 and BC-LI-0198 on the leucine-induced change of GTP hydrolysis of RagD. GTP-agarose bead pull-down assays were used to monitor the GTP-bound RagD or ARF1. After cells were treated with 10 μM BC-LI-0186 for 1 h, cell lysates were pulled down with GTP-agarose beads and the precipitated proteins with the beads were analyzed by immunoblotting with anti-RagD and anti-ARF1 antibodies. c Effect of LRS WT or S974A overexpression on S6K phosphorylation inhibited by BC-LI-0186. Inducible LRS WT or S974A-overexpressed SW620 cells were treated with 10 μM BC-LI-0186 for 1 h. Cell lysates were analyzed by immunoblotting with anti-p-S6K (T389), anti-S6K, anti-LRS, and anti-actin antibodies. d Effect of LRS WT or S974A overexpression on BC-LI-0186-induced growth inhibition (d) and cell death (e) (see Supplementary Fig. 5a). The data in Supplementary Fig. 5a were quantified and displayed as bar graphs. The error bars represent mean ± S.D. (n = 3). f Effect of RagDGDP on the BC-LI-0186-dependent inhibition of GTP hydrolysis of RagD and S6K phosphorylation. SW620 cells were transfected with GDP mutant of RagD (S77L) and then starved for leucine for 1 h and re-stimulated with leucine for 10 min in the presence or absence of 10 μM BC-LI-0186. Cell lysates were pulled down with GTP-agarose beads and the precipitated proteins with the beads were analyzed by immunoblotting with anti-RagD antibody. g Effect of RagBGTP/RagDGDP on rapamycin or BC-LI-0186-dependent inhibition of S6K phosphorylation. SW620 cells were co-transfected with GDP mutant of RagD (S77L) and GTP mutant of RagB (Q99L) and then starved for leucine for 1 h and re-stimulated with leucine for 10 min in the presence or absence of 10 μM BC-LI-0186. h Effect of LRS overexpression on the kinetic changes of RagD and S6K phosphorylation that was arrested by BC-LI-0186 pretreatment. SW620 cells were treated with 10 μM BC-LI-0186 for 1 h. Then, cells were incubated with BC-LI-0186-free media for the indicated times. Cell lysates were pulled down with GTP-agarose beads and the precipitated proteins with the beads were analyzed by immunoblotting with anti-RagD or ARF1 antibodies (upper). Cell lysates were analyzed by immunoblotting with their specific antibodies (lower). The error bars represent mean ± S.D. (n = 3)CC BY · PubMed Central
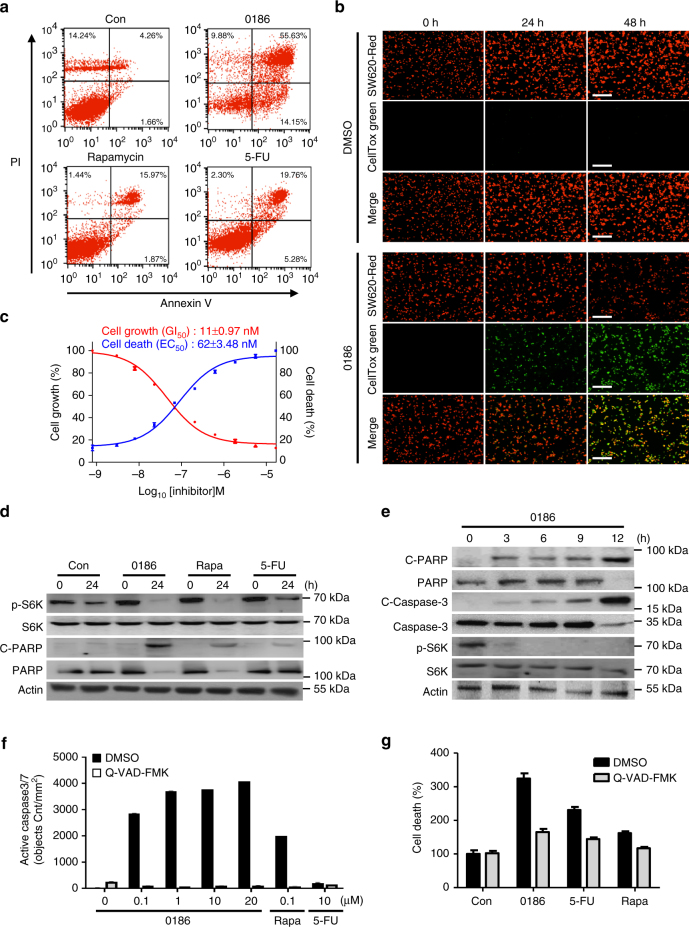
Fig. 5 Effect of BC-LI-0186 on cancer cell death. a SW620 cells were treated with DMSO (Con), rapamycin (100 nM), BC-LI-0186 (10 μM), or 5-FU (10 μM) for 24 h. After cells were stained with PI and Annexin V, cells were separated and counted by FACS. b SW620 cells stably expressing RFP were treated with DMSO or 1.85 µM BC-LI-0186 in the presence of CellTox green. After 0, 24, 48 h, red (cell growth) and green (cell death) fluorescence images were acquired. c SW620 cells stably expressing RFP were treated with various concentration of BC-LI-0186 in the presence of CellTox green to monitor cell growth and death, simultaneously. The GI50 (red line) and EC50 (blue line) of BC-LI-0186 were determined by analyzing dose-response curves using GraphPad Prism tools. The insets represent the GI50 and EC50 values of BC-LI-0186. d SW620 cells were treated with DMSO (Con), BC-LI-0186 (10 μM), rapamycin (100 nM), or 5-FU (10 μM) for 24 h. Cells were analyzed by immunoblotting with the indicated antibodies. e SW620 cells were treated with 10 μM BC-LI-0186 for 0, 3, 6, 9, 12 h and analyzed by immunoblotting with the indicated antibodies. f SW620 cells were treated with DMSO (Con), BC-LI-0186 (0.1, 1, 10, 20 μM), rapamycin (100 nM), or 5-FU (10 μM). After 24 h, apoptosis was measured using Cellplayer caspase-3/7 reagent in the absence or presence of Q-VAD-FMK, which is an apoptosis inhibitor. g SW620 cells were treated with DMSO (Con), BC-LI-0186 (10 μM), rapamycin (100 nM), or 5-FU (10 μM) in the presence of CellTox green to measure cell death. After 24 h, green fluorescence was monitored in the presence of Q-VAD-FMK. The error bars represent mean ± S.D. (n = 3)
Fig. 5 Effect of BC-LI-0186 on cancer cell death. a SW620 cells were treated with DMSO (Con), rapamycin (100 nM), BC-LI-0186 (10 μM), or 5-FU (10 μM) for 24 h. After cells were stained with PI and Annexin V, cells were separated and counted by FACS. b SW620 cells stably expressing RFP were treated with DMSO or 1.85 µM BC-LI-0186 in the presence of CellTox green. After 0, 24, 48 h, red (cell growth) and green (cell death) fluorescence images were acquired. c SW620 cells stably expressing RFP were treated with various concentration of BC-LI-0186 in the presence of CellTox green to monitor cell growth and death, simultaneously. The GI50 (red line) and EC50 (blue line) of BC-LI-0186 were determined by analyzing dose-response curves using GraphPad Prism tools. The insets represent the GI50 and EC50 values of BC-LI-0186. d SW620 cells were treated with DMSO (Con), BC-LI-0186 (10 μM), rapamycin (100 nM), or 5-FU (10 μM) for 24 h. Cells were analyzed by immunoblotting with the indicated antibodies. e SW620 cells were treated with 10 μM BC-LI-0186 for 0, 3, 6, 9, 12 h and analyzed by immunoblotting with the indicated antibodies. f SW620 cells were treated with DMSO (Con), BC-LI-0186 (0.1, 1, 10, 20 μM), rapamycin (100 nM), or 5-FU (10 μM). After 24 h, apoptosis was measured using Cellplayer caspase-3/7 reagent in the absence or presence of Q-VAD-FMK, which is an apoptosis inhibitor. g SW620 cells were treated with DMSO (Con), BC-LI-0186 (10 μM), rapamycin (100 nM), or 5-FU (10 μM) in the presence of CellTox green to measure cell death. After 24 h, green fluorescence was monitored in the presence of Q-VAD-FMK. The error bars represent mean ± S.D. (n = 3)CC BY · PubMed Central
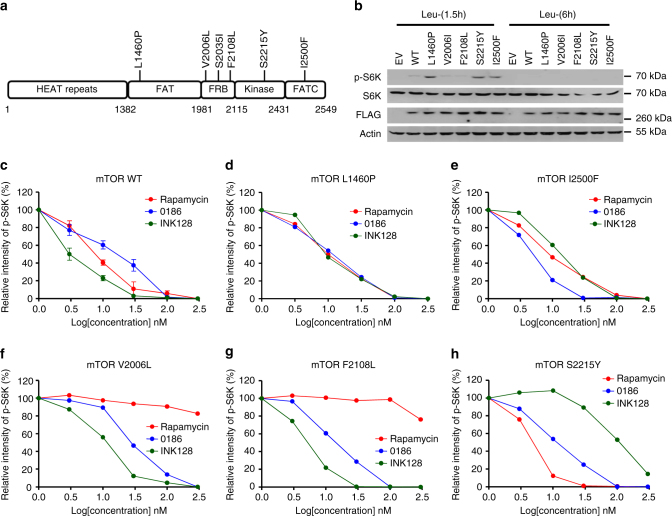
Fig. 6 Effect of BC-LI-0186 on cancer-associated MTOR mutations. a Schematic representation of cancer-associated MTOR mutations. b Leucine-dependency of cancer-associated MTOR mutations. SW620 cells were transfected with FLAG-tagged mTOR WT and the indicated mutants. The cells were starved for leucine for 1.5 and 6 h, and the cell lysates were analyzed with the indicated antibodies. c–h Effect of BC-LI-0186 on S6K phosphorylation in SW620 cells harboring mTOR WT (c), mTOR L1460P (d), mTOR I2500F (e), mTOR V2006L (f), mTOR F2108L (g), mTOR S2215Y (h). The levels of p-S6K shown in Supplementary Fig. 7a–e were quantified and displayed as graph
Fig. 6 Effect of BC-LI-0186 on cancer-associated MTOR mutations. a Schematic representation of cancer-associated MTOR mutations. b Leucine-dependency of cancer-associated MTOR mutations. SW620 cells were transfected with FLAG-tagged mTOR WT and the indicated mutants. The cells were starved for leucine for 1.5 and 6 h, and the cell lysates were analyzed with the indicated antibodies. c–h Effect of BC-LI-0186 on S6K phosphorylation in SW620 cells harboring mTOR WT (c), mTOR L1460P (d), mTOR I2500F (e), mTOR V2006L (f), mTOR F2108L (g), mTOR S2215Y (h). The levels of p-S6K shown in Supplementary Fig. 7a–e were quantified and displayed as graphCC BY · PubMed Central
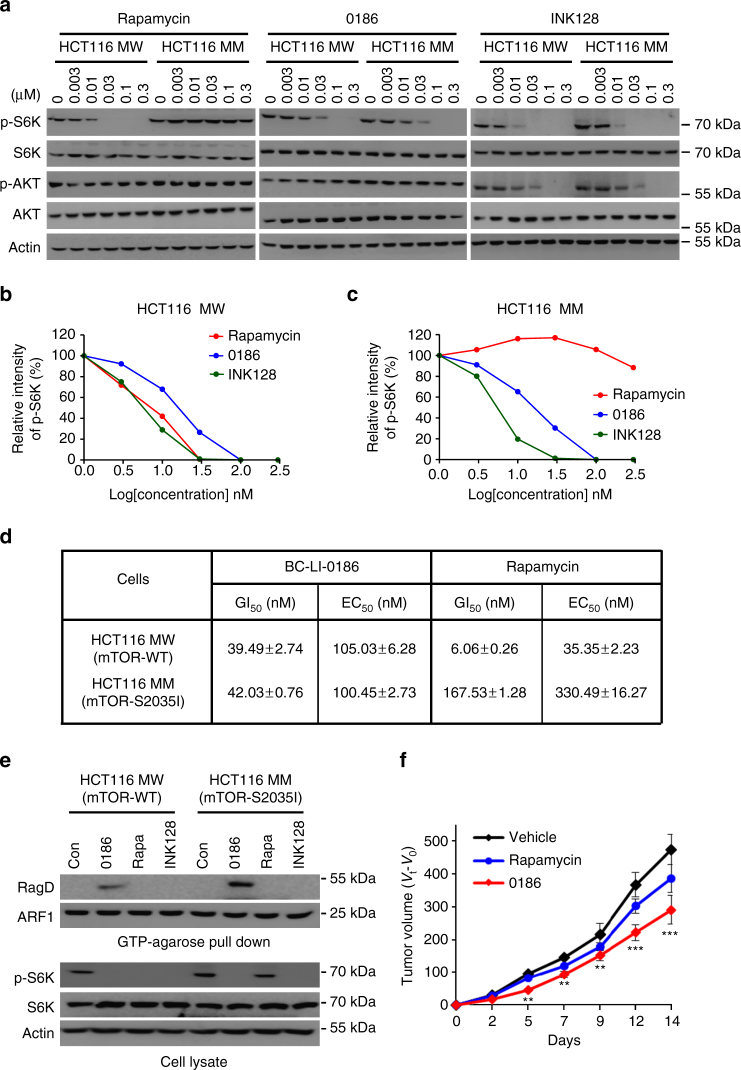
Fig. 7 Efficacy of BC-LI-0186 to rapamycin-resistant cancer cells. a HCT116 MW (mTOR WT) and MM (mTOR S2035I) cells were treated with rapamycin, BC-LI-0186, and INK128 at the indicated concentrations (nM) for 6 h. The cell lysates were subjected to immunoblotting analysis with anti-mTOR, anti-p-S6K, anti-S6K, and anti-actin antibodies. b The level of p-S6K in HCT MW cells shown in a was quantified and displayed as graph. c The level of p-S6K in HCT MM cells shown in a was quantified and displayed as graph. d Cell growth GI50 and cell death EC50 values of BC-LI-0186 and rapamycin against HCT116 MW and MM cells. e GTP-agarose bead pull-down assays were used to monitor the GTP-bound RagD in HCT116 MW and MM cells. After cells were treated with 10 μM BC-LI-0186, 100 nM rapamycin, or 10 μM INK128, the cell lysates were incubated with GTP-agarose beads and the proteins precipitated with the beads were analyzed by immunoblotting with anti-RagD or anti-ARF1 antibodies. f HCT116 MM cells were injected subcutaneously to nude mice. BC-LI-0186 and rapamycin were intraperitoneally administered into the mice at the indicated doses every day (n/group = 6). Tumor volume was measured every other day for 2 weeks. The error bars represent mean ± S.D. *p < 0.05; **p < 0.01; ***p < 0.001 (vs. vehicle)
Fig. 7 Efficacy of BC-LI-0186 to rapamycin-resistant cancer cells. a HCT116 MW (mTOR WT) and MM (mTOR S2035I) cells were treated with rapamycin, BC-LI-0186, and INK128 at the indicated concentrations (nM) for 6 h. The cell lysates were subjected to immunoblotting analysis with anti-mTOR, anti-p-S6K, anti-S6K, and anti-actin antibodies. b The level of p-S6K in HCT MW cells shown in a was quantified and displayed as graph. c The level of p-S6K in HCT MM cells shown in a was quantified and displayed as graph. d Cell growth GI50 and cell death EC50 values of BC-LI-0186 and rapamycin against HCT116 MW and MM cells. e GTP-agarose bead pull-down assays were used to monitor the GTP-bound RagD in HCT116 MW and MM cells. After cells were treated with 10 μM BC-LI-0186, 100 nM rapamycin, or 10 μM INK128, the cell lysates were incubated with GTP-agarose beads and the proteins precipitated with the beads were analyzed by immunoblotting with anti-RagD or anti-ARF1 antibodies. f HCT116 MM cells were injected subcutaneously to nude mice. BC-LI-0186 and rapamycin were intraperitoneally administered into the mice at the indicated doses every day (n/group = 6). Tumor volume was measured every other day for 2 weeks. The error bars represent mean ± S.D. *p < 0.05; **p < 0.01; ***p < 0.001 (vs. vehicle)CC BY · PubMed Central

Verification

Claims the paper makes

The claims and statistics of this paper haven’t been checked yet.

Run the check — free, no account needed. It reads the open-access text and checks the sources it cites.

A few free checks a day · papers already verified open instantly · results are public

Claims other papers make about this one

Each is checked against this paper’s own text: does it say what the citing paper says it does?

Self-check

Percentages, sums and reported differences re-computed from the paper’s own numbers.

The self-check needs the paper’s full text.

Citations

Cites

Research works printed but not linked: 47

  1. Fürst, P. & Stehle, P. What are the essential elements needed for the determination of amino acid requirements in humans? J. Nutr. 134, 1558S–1565S (2004). · DOI
  2. Guertin, D. & Sabatini, D. M. An expanding role for mTOR in cancer. Trends Mol. Med. 11, 353–361 (2005). · DOI
  3. Laplante, M. & Sabatini, D. M. mTOR signaling in growth control and disease. Cell 149, 274–293 (2012). · DOI · Paper page
  4. Oddo, S. The role of mTOR signaling in Alzheimer disease. Front. Biosci. 4, 941–952 (2012). · DOI
  5. Schurmann, A., Brauers, A., Massmann, S., Becker, W. & Joost, H. G. Cloning of a novel family of mammalian GTP-binding proteins (RagA, RagBs, RagB1) with remote similarity to the Ras-related GTPases. J. Biol. Chem. 270, 28982–28988 (1995). · DOI
  6. Sancak, Y. et al. The Rag GTPases bind raptor and mediate amino acid signaling to mTORC1. Science 320, 1496–1501 (2008). · DOI · Paper page
  7. Sekiguchi, T., Hirose, E., Nakashima, N., Ii, M. & Nishimoto, T. Novel G proteins, Rag C and Rag D, interact with GTP-binding proteins, Rag A and Rag B. J. Biol. Chem. 276, 7246–7257 (2001). · DOI
  8. Wang, S. et al. Lysosomal amino acid transporter SLC38A9 signals arginine sufficiency to mTORC1. Science 347, 188–194 (2015). · DOI
  9. Lee, S. W., Cho, B. H., Park, S. G. & Kim, S. Aminoacyl-tRNA synthetase complexes: beyond translation. J. Cell Sci. 117, 3725–3734 (2004). · DOI
  10. Park, S. G., Ewalt, K. L. & Kim, S. Functional expansion of aminoacyl-tRNA synthetases and their interacting factors: new perspectives on housekeepers. Trends Biochem. Sci. 30, 569–574 (2005). · DOI
  11. Han, J. M. et al. Leucyl-tRNA synthetase is an intracellular leucine sensor for the mTORC1-signaling pathway. Cell 149, 410–424 (2012). · DOI · Paper page
  12. Bonfils, G. et al. Leucyl-tRNA synthetase controls TORC1 via the EGO complex. Mol. Cell 46, 105–110 (2012). · DOI
  13. Grabiner, B. C. et al. A diverse array of cancer-associated MTOR mutations are hyperactivating and can predict rapamycin sensitivity. Cancer Discov. 4, 554–563 (2014). · DOI
  14. Hardt, M., Chantaravisoot, N. & Tamanoi, F. Activating mutations of TOR (target of rapamycin). Genes Cells 16, 141–151 (2011). · DOI
  15. Sato, T., Nakashima, A., Guo, L., Coffman, K. & Tamanoi, F. Single amino-acid changes that confer constitutive activation of mTOR are discovered in human cancer. Oncogene 29, 2746–2752 (2010). · DOI
  16. Wagle, N. et al. Activating mTOR mutations in a patient with an extraordinary response on a phase I trial of everolimus and pazopanib. Cancer Discov. 4, 546–553 (2014). · DOI
  17. Chen, J., Zheng, X. F., Brown, E. J. & Schreiber, S. L. Identification of an 11-kDa FKBP12-rapamycin-binding domain within the 289-kDa FKBP12-rapamycin-associated protein and characterization of a critical serine residue. Proc. Natl. Acad. Sci. USA 92, 4947–4951 (1995). · DOI · Paper page
  18. Liu, X. & Zheng, X. F. Endoplasmic reticulum and Golgi localization sequences for mammalian target of rapamycin. Mol. Biol. Cell 18, 1073–1082 (2007). · DOI
  19. Hosoi, H. et al. Rapamycin causes poorly reversible inhibition of mTOR and induces p53-independent apoptosis in human rhabdomyosarcoma cells. Cancer Res. 59, 886–894 (1999).
  20. Rouget, P. & Chapeville, F. Leucyl-tRNA synthetase. Mechanism of leucyl-tRNA formation. Eur. J. Biochem. 23, 443–451 (1971). · DOI
  21. Leeson, P. Drug discovery: chemical beauty contest. Nature 481, 455–456 (2012). · DOI
  22. Rock, F. L. et al. An antifungal agent inhibits an aminoacyl-tRNA synthetase by trapping tRNA in the editing site. Science 316, 1759–1761 (2007). · DOI
  23. Guo, M., Yang, X. L. & Schimmel, P. New functions of aminoacyl-tRNA synthetases beyond translation. Nat. Rev. Mol. Cell Biol. 11, 668–674 (2010). · DOI
  24. Rock, F. L. et al. An antifungal agent inhibits an aminoacyl-tRNA synthetase by trapping tRNA in the editing site. Science 316, 1759–1761 (2007). · DOI
  25. Cusack, S., Yaremchuk, A. & Tukalo, M. The 2 A crystal structure of leucyl-tRNA synthetase and its complex with a leucyl-adenylate analogue. EMBO J. 19, 2351–2361 (2000). · DOI
  26. Fukunaga, R. & Yokoyama, S. Crystal structure of leucyl-tRNA synthetase from the archaeon Pyrococcus horikoshii reveals a novel editing domain orientation. J. Mol. Biol. 346, 57–71 (2005). · DOI
  27. Li, L. et al. Leucyl-tRNA synthetase editing domain functions as a molecular rheostat to control codon ambiguity in Mycoplasma pathogens. Proc. Natl. Acad. Sci. USA 110, 3817–3822 (2013). · DOI
  28. Yoon, M. S. et al. Leucyl-tRNA synthetase activates Vps34 in amino acid-sensing mTORC1 signaling. Cell Rep. 16, 1510–1517 (2016). · DOI
  29. Han, J. M. et al. Hierarchical network between the components of the multi-tRNA synthetase complex: implications for complex formation. J. Biol. Chem. 281, 38663–38667 (2006). · DOI
  30. Laplante, M. & Sabatini, D. M. mTOR signaling in growth control and disease. Cell 149, 274–293 (2012). · DOI · Paper page
  31. Deng, L. et al. The ubiquitination of RagA GTPase by RNF152 negatively regulates mTORC1 activation. Mol. Cell 58, 804–818 (2015). · DOI
  32. Sugiura, A. et al. MITOL regulates endoplasmic reticulum-mitochondria contacts via Mitofusin2. Mol. Cell 51, 20–34 (2013). · DOI · Paper page
  33. Ye, Z. et al. PRL-3 activates mTORC1 in cancer progression. Sci. Rep. 24, 17046 (2015). · DOI
  34. Hassan, B. et al. Catalytic mTOR inhibitors can overcome intrinsic and acquired resistance to allosteric mTOR inhibitors. Oncotarget 5, 8544–8557 (2014). · DOI
  35. Markman, B., Dienstmann, R. & Tabernero, J. Targeting the PI3K/Akt/mTOR pathway—beyond rapalogs. Oncotarget 1, 530–543 (2010). · DOI
  36. Ekstrand, A. I., Jönsson, M., Lindblom, A., Borg, A. & Nilbert, M. Frequent alterations of the PI3K/AKT/mTOR pathways in hereditary nonpolyposis colorectal cancer. Fam. Cancer 9, 125–129 (2010). · DOI
  37. Janku, F. et al. PIK3CA mutations frequently coexist with RAS and BRAF mutations in patients with advanced cancers. PLoS ONE 6, e22769 (2011). · DOI
  38. Wagle, N. et al. Response and acquired resistance to everolimus in anaplastic thyroid cancer. N. Engl. J. Med. 371, 1426–1433 (2014). · DOI
  39. Lorenz, M. C. & Heitman, J. TOR mutations confer rapamycin resistance by preventing interaction with FKBP12-rapamycin. J. Biol. Chem. 270, 27531–27537 (1995). · DOI
  40. Yip, C. K., Murata, K., Walz, T., Sabatini, D. M. & Kang, S. A. Structure of the human mTOR complex I and its implications for rapamycin inhibition. Mol. Cell 38, 768–774 (2010). · DOI · Paper page
  41. Chantranupong, L. et al. The sestrins interact with GATOR2 to negatively regulate the amino-acid-sensing pathway upstream of mTORC1. Cell Rep. 9, 1–8 (2014). · DOI · Paper page
  42. Kim, E., Goraksha-Hicks, P., Li, L., Neufeld, T. P. & Guan, K. L. Regulation of TORC1 by Rag GTPases in nutrient response. Nat. Cell Biol. 10, 935–945 (2008). · DOI · Paper page
  43. Parmigiani, A. et al. Sestrins inhibit mTORC1 kinase activation through the GATOR complex. Cell Rep. 9, 1281–1291 (2014). · DOI · Paper page
  44. Hura, G. L. et al. Robust, high-throughput solution structural analyses by small angle X-ray scattering (SAXS). Nat. Methods 6, 606–612 (2009). · DOI
  45. Kelley, L. A. & Sternberg, M. J. E. Protein structure prediction on the web: a case study using the Phyre server. Nat. Protoc. 4, 363–371 (2009). · DOI
  46. Zhang, H. M., Bou-Assaf, G. M., Emmett, M. R. & Marshall, A. G. Fast reversed-phase liquid chromatography to reduce back exchange and increase throughput in H/D exchange monitored by FT-ICR mass spectrometry. J. Am. Soc. Mass Spectrom. 20, 520–524 (2009). · DOI
  47. Blakney, G. T., Hendrickson, C. L. & Marshall, A. G. Predator data station: a fast data acquisition system for advanced FT-ICR MS experiments. Int. J. Mass Spectrom. 306, 246–252 (2011). · DOI

Cited by

Sorted by citations

See all 88

Metadata

Authors
Kim, J. H., Lee, C., Lee, M., Wang, H., Kim, K., Park, S. J., Yoon, I., Jang, J., Zhao, H., Kim, H. K., Kwon, N. H., Jeong, S. J., Yoo, H. C., Kim, J. H., Yang, J. S., Lee, M. Y., Lee, C. W., Yun, J., Oh, S. J., Kang, J. S., Martinis, S. A., Hwang, K. Y., Guo, M., Han, G., Han, J. M., & Kim, S.
Venue
Nature Communications
Published
2017-09-29
Volume
8
Issue
1
ISSN
2041-1723
Cited by
88
References
8
Language
en

About these checks

Registry, retraction, Cites and statistics results are computed, not judged, with one exception: a printed reference that no index lists is read once by a model before it counts as a citation error. Claims are extracted by a model and kept only when their quote appears verbatim in the text; each cited source is then checked, with a model’s help, for whether it says what the claim relies on. Those verdicts can be wrong — read the claim’s quote and the cited source before relying on one.

Statistics and arithmetic are recomputed, not judged.

Confidence bands are shown only for fields calibrated on our annotated test set. None is calibrated yet, so no band is shown.

What counts as a claim ›How we measure confidence ›How we check this ›

Are you an author, or do you see a problem with this page? Request a review