

Atomic-resolution three-dimensional hydration structures on a heterogeneously charged surface
Open accessThe DOI matches its Crossref record; 59 of the 59 references it cites were found in a registry or an index.
Abstract
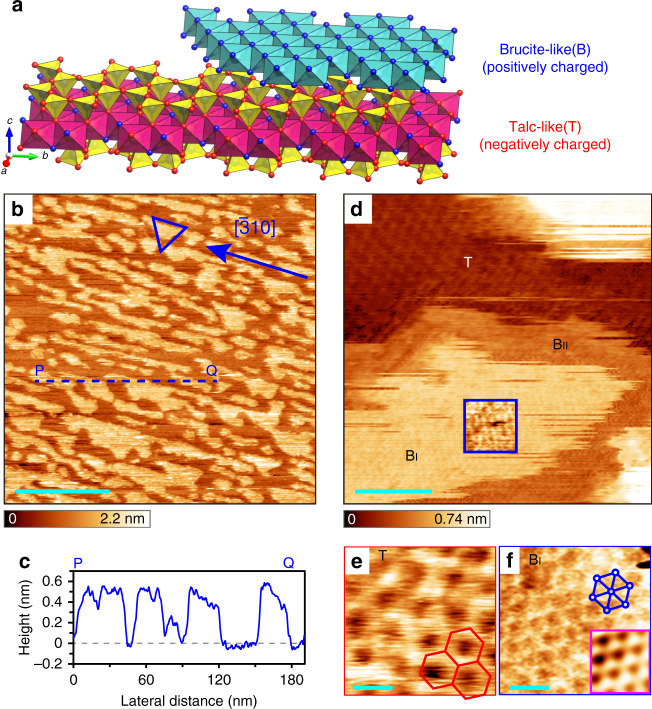
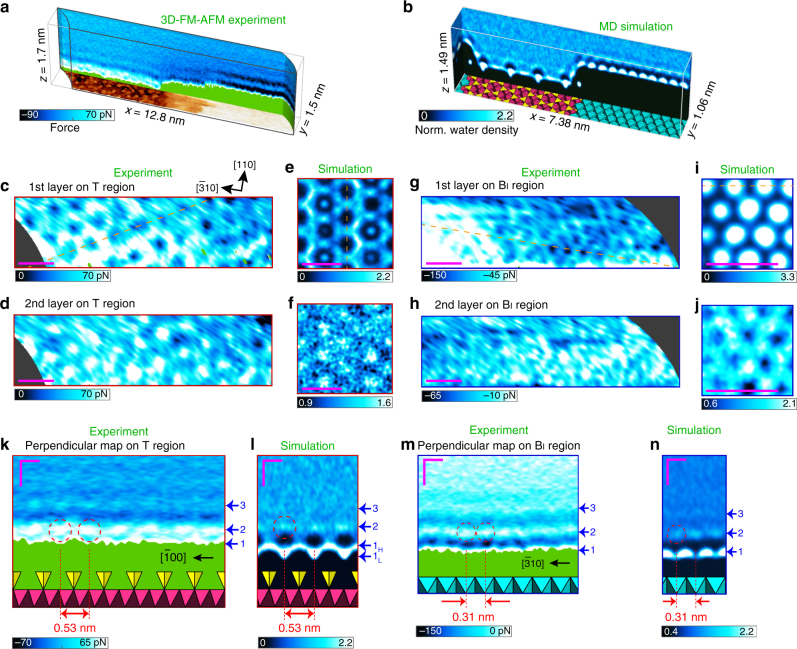
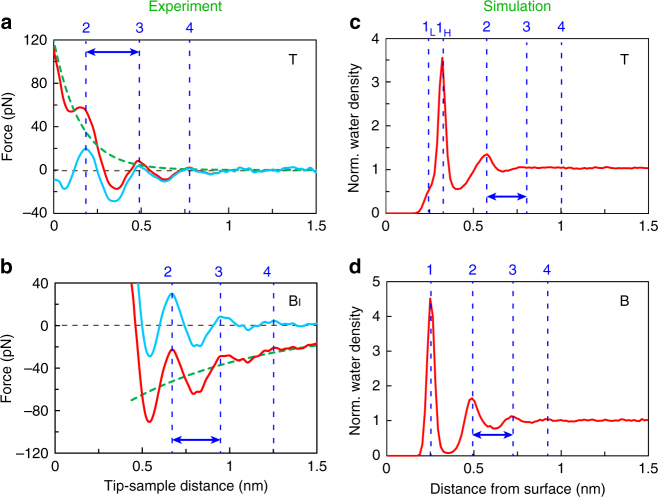
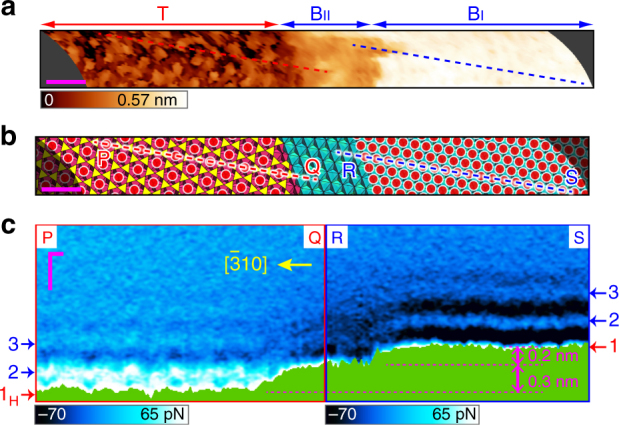
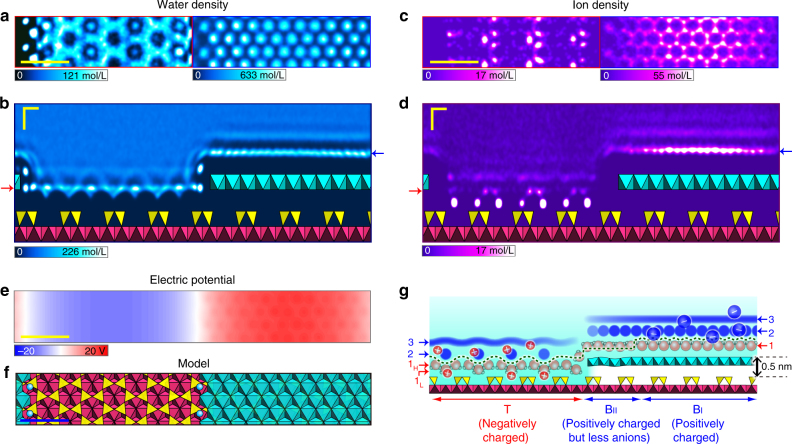
Local hydration structures at the solid–liquid interface around boundary edges on heterostructures are key to an atomic-level understanding of various physical, chemical and biological processes. Recently, we succeeded in visualising atomic-scale three-dimensional hydration structures by using ultra-low noise frequency-modulation atomic force microscopy. However, the time-consuming three-dimensional-map measurements on uneven heterogeneous surfaces have not been achieved due to experimental difficulties, to the best of our knowledge. Here, we report the local hydration structures formed on a heterogeneously charged phyllosilicate surface using a recently established fast and nondestructive acquisition protocol. We discover intermediate regions formed at step edges of the charged surface. By combining with molecular dynamics simulations, we reveal that the distinct structural hydrations are hard to observe in these regions, unlike the charged surface regions, possibly due to the depletion of ions at the edges. Our methodology and findings could be crucial for the exploration of further functionalities.
Overview
The claims and statistics of this paper haven’t been checked yet.
Free: it reads the open-access text and checks the first 5 claims that cite a source we can check. Create a free account to check every claim.
Integrity signals
Registry
Cites
Statistics
Figures
Verification
Claims the paper makes
The claims and statistics of this paper haven’t been checked yet.
Free: it reads the open-access text and checks the first 5 claims that cite a source we can check. Create a free account to check every claim.
Self-check
Percentages, sums and reported differences re-computed from the paper’s own numbers.
The self-check needs the paper’s full text.
Citations
Cites
VMD: visual molecular dynamics
Humphrey, W., Dalke, A., & Schulten, K. (1996) · Journal of Molecular Graphics · doi:10.1016/0263-7855(96)00018-5 · Cited by 66,952
Fast Parallel Algorithms for Short-Range Molecular Dynamics
Plimpton, S. (1995) · Journal of Computational Physics · doi:10.1006/jcph.1995.1039 · Cited by 44,721
VESTA 3 for three-dimensional visualization of crystal, volumetric and morphology data
Momma, K., & Izumi, F. (2011) · Journal of Applied Crystallography · doi:10.1107/s0021889811038970 · Cited by 26,054
Intermolecular and Surface Forces
(2011) · Intermolecular and Surface Forces · doi:10.1016/b978-0-12-391927-4.10024-6 · Cited by 16,923
MDAnalysis: A toolkit for the analysis of molecular dynamics simulations
Michaud‐Agrawal, N., Denning, E. J., Woolf, T. B., & Beckstein, O. (2011) · Journal of Computational Chemistry · doi:10.1002/jcc.21787 · Cited by 4,486
Cygan, R. T., Liang, J.-J., & Kalinichev, A. G. (2004) · The Journal of Physical Chemistry B · doi:10.1021/jp0363287 · Cited by 3,191
The role of graphene for electrochemical energy storage
Raccichini, R., Varzi, A., Passerini, S., & Scrosati, B. (2015) · Nature Materials · doi:10.1038/nmat4170 · Cited by 2,687
Catalysis with two-dimensional materials and their heterostructures
Deng, D., Novoselov, K. S., Fu, Q., Zheng, N., Tian, Z., & Bao, X. (2016) · Nature Nanotechnology · doi:10.1038/nnano.2015.340 · Cited by 2,308
Calibration of rectangular atomic force microscope cantilevers
Sader, J. E., Chon, J. W. M., & Mulvaney, P. (1999) · Review of Scientific Instruments · doi:10.1063/1.1150021 · Cited by 2,145
Enhanced electrocatalytic CO2 reduction via field-induced reagent concentration
Liu, M., Pang, Y., Zhang, B., De Luna, P., Voznyy, O., Xu, J., Zheng, X., Dinh, C. T., Fan, F., Cao, C., et al. (2016) · Nature · doi:10.1038/nature19060 · Cited by 2,000
Research works printed but not linked: 1
- Phillips, T. L., Loveless, J. K. & Bailey, S. W. Cr3+ coordination in chlorites - structural study of 10 chromian chlorites. Am. Mineral. 65, 112–122 (1980).
Cited by
Cygan, R. T., Greathouse, J. A., & Kalinichev, A. G. (2021) · The Journal of Physical Chemistry C · doi:10.1021/acs.jpcc.1c04600 · Cited by 350
Bian, K., Gerber, C., Heinrich, A. J., Müller, D. J., Scheuring, S., & Jiang, Y. (2021) · Nature Reviews Methods Primers · doi:10.1038/s43586-021-00033-2 · Cited by 314
Atomic- and Molecular-Resolution Mapping of Solid–Liquid Interfaces by 3D Atomic Force Microscopy
Fukuma, T., & Garcia, R. (2018) · ACS Nano · doi:10.1021/acsnano.8b07216 · Cited by 198
Hydration layer structure modulates superlubrication by trivalent La 3+ electrolytes
Han, T., Cao, W., Xu, Z., Adibnia, V., Olgiati, M., Valtiner, M., Ma, L., Zhang, C., Ma, M., Luo, J., et al. (2023) · Science Advances · doi:10.1126/sciadv.adf3902 · Cited by 112
Ion-Specific and pH-Dependent Hydration of Mica–Electrolyte Interfaces
van Lin, S. R., Grotz, K. K., Siretanu, I., Schwierz, N., & Mugele, F. (2019) · Langmuir · doi:10.1021/acs.langmuir.9b00520 · Cited by 79
Metadata
- Authors
- Umeda, K., Zivanovic, L., Kobayashi, K., Ritala, J., Kominami, H., Spijker, P., Foster, A. S., & Yamada, H.
- Affiliations
- Kyoto University (JP)
- Aalto University (FI)
- Kanazawa University (JP)
- Corresponding author
- Foster, Adam S.
- Yamada, Hirofumi
- ORCID
- Venue
- Nature Communications
- Published
- 2017-12-13
- Volume
- 8
- Issue
- 1
- Pages
- 2111-2111
- ISSN
- 2041-1723 (ISSN-L)
- PMC
- PMC5727385
- OpenAlex
- W2773814214
- Cited by
- 85
- References
- 59
- Citations by year
- 2026: 5 · 2025: 8 · 2024: 14 · 2023: 6 · 2022: 16 · 2021: 13 · 2020: 13 · 2019: 4 · 2018: 6
- FWCI
- 3.06
- Type
- journal article
- Language
- en
- Update notices
- correction (2018-05-23)
- Open access
- gold
- doi.org
- Licence
- cc-by
- creativecommons.org/licenses/by/4.0 (tdm)
- creativecommons.org/licenses/by/4.0 (vor)
- Locations
- Nature Communications (publishedVersion, cc-by)
- PubMed Central (publishedVersion, cc-by)
- PubMed (publishedVersion)
- Aaltodoc (Aalto University) (submittedVersion, cc-by)
- Institutional Repositories DataBase (IRDB) (submittedVersion, cc-by)
- RePEc: Research Papers in Economics (submittedVersion)
- DOAJ (DOAJ: Directory of Open Access Journals) (submittedVersion, cc-by-sa)
- DOAJ (DOAJ: Directory of Open Access Journals) (submittedVersion)
- Kyoto University Research Information Repository (Kyoto University) (submittedVersion, cc-by)
- Funders
- Foundation Advanced Technology Institute
- European Commission (610446)
- Ministry of Education, Culture, Sports, Science and Technology
- Academy of Finland (915804)
- China Scholarship Council
- Murata Science Foundation
- Japan Society for the Promotion of Science (24221008, 16J01165, 25286057, 15K17467, 16H03870, 17H06122)
- Topics
- Physical Sciences › Physics and Astronomy › Atomic and Molecular Physics, and Optics › Force Microscopy Techniques and Applications
- Physical Sciences › Chemistry › Physical and Theoretical Chemistry › Electrostatics and Colloid Interactions
- Life Sciences › Biochemistry, Genetics and Molecular Biology › Biophysics › Chemical and Physical Studies
- Keywords
- hydration structure, solid-liquid interface, phyllosilicates, surface steps, frequency modulation atomic force microscopy, 3D mapping, ion depletion, boundary edges, molecular dynamics simulation
About these checks
Registry, retraction, Cites and statistics results are computed, not judged, with one exception: a printed reference that no index lists is read once by a model before it counts as a citation error. Claims are extracted by a model and kept only when their quote appears verbatim in the text; each cited source is then checked, with a model’s help, for whether it says what the claim relies on. Those verdicts can be wrong — read the claim’s quote and the cited source before relying on one.
Statistics and arithmetic are recomputed, not judged.
Confidence bands are shown only for fields calibrated on our annotated test set. None is calibrated yet, so no band is shown.
What counts as a claim ›How we measure confidence ›How we check this ›
Are you an author, or do you see a problem with this page? Request a review
How to cite
Cite CoChat for the checks on this page, and the paper for its own findings.
- This page
- CoChat. (2026). Citation check: Atomic-resolution three-dimensional hydration structures on a heterogeneously charged surface. https://app.cochat.ai/papers/10.1038/s41467-017-01896-4
- The paper
- Umeda, K., Zivanovic, L., Kobayashi, K., Ritala, J., Kominami, H., Spijker, P., Foster, A. S., & Yamada, H. (2017). Atomic-resolution three-dimensional hydration structures on a heterogeneously charged surface. Nature Communications. https://doi.org/10.1038/s41467-017-01896-4
Data sources
Bibliographic data: Semantic Scholar, OpenAlex, Crossref.
Contains information from the Semantic Scholar Academic Graph Datasets, made available under the ODC Attribution License (ODC-BY 1.0).
Semantic Scholar’s data is described in: Kinney, R., et al. (2023). The Semantic Scholar Open Data Platform. arXiv:2301.10140.
