

The DOI matches its Crossref record; 64 of the 64 references it cites were found in a registry or an index.
Regulatory T cells trigger effector T cell DNA damage and senescence caused by metabolic competition
Open accessAbstract
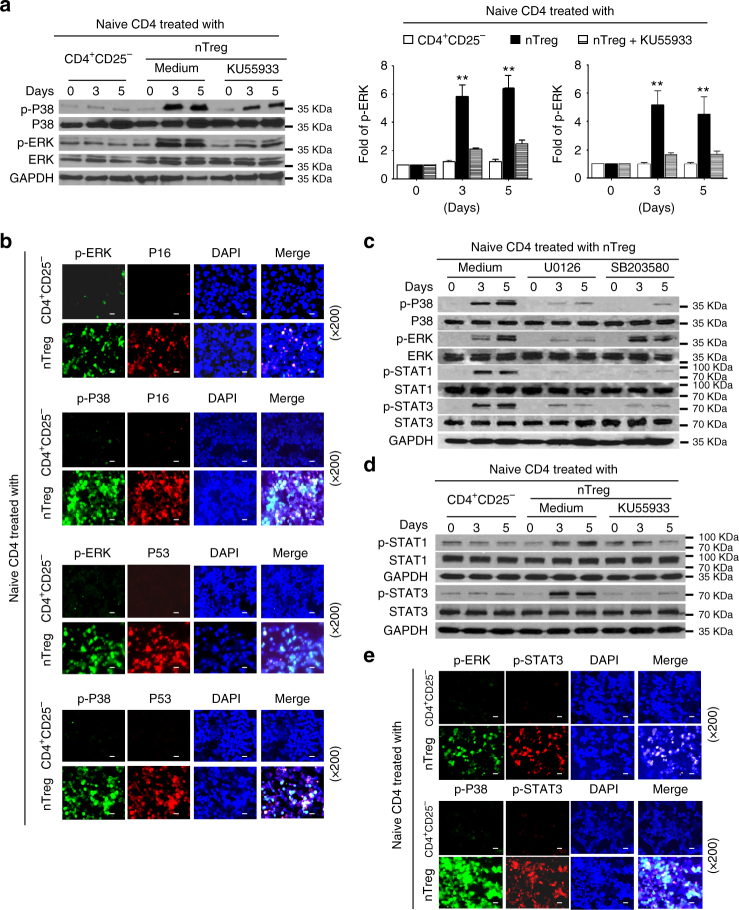
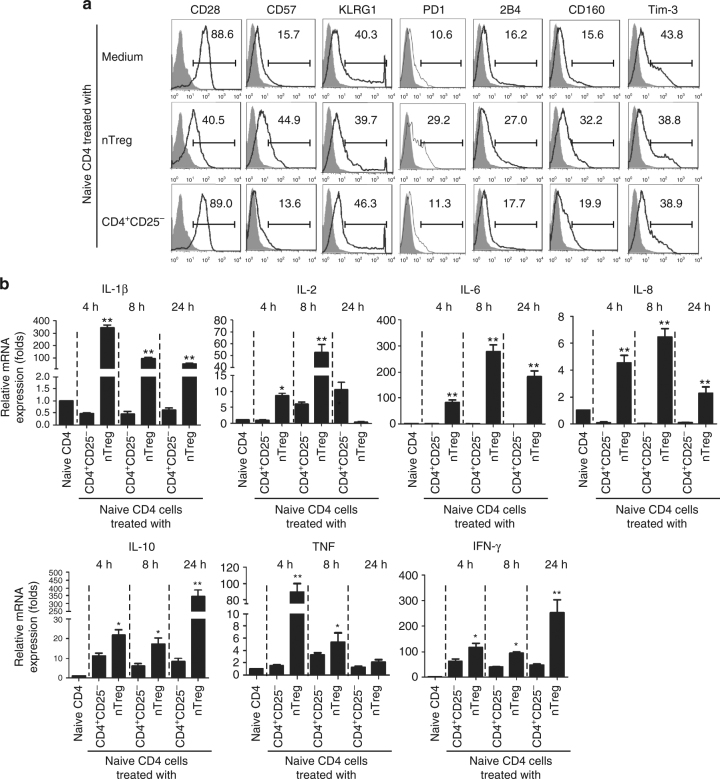
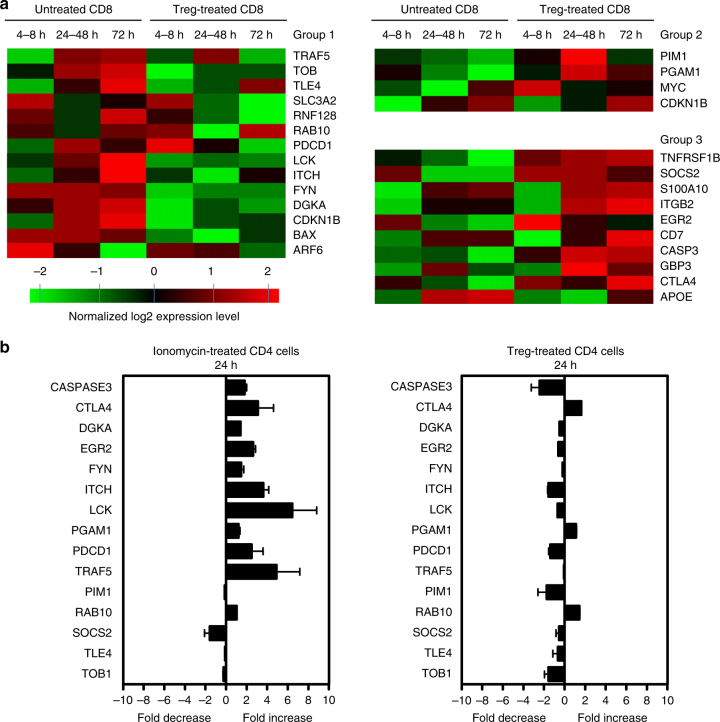
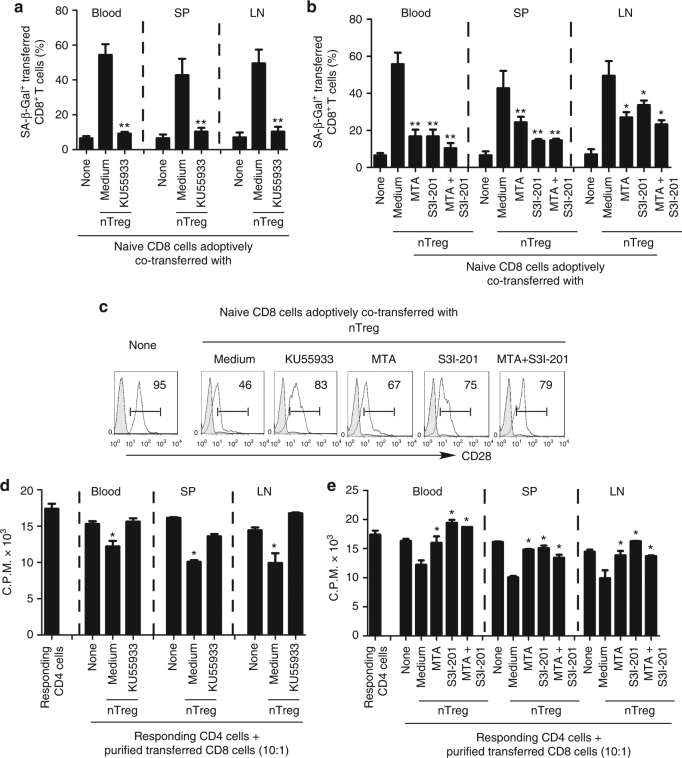
Defining the suppressive mechanisms used by regulatory T (Treg) cells is critical for the development of effective strategies for treating tumors and chronic infections. The molecular processes that occur in responder T cells that are suppressed by Treg cells are unclear. Here we show that human Treg cells initiate DNA damage in effector T cells caused by metabolic competition during cross-talk, resulting in senescence and functional changes that are molecularly distinct from anergy and exhaustion. ERK1/2 and p38 signaling cooperate with STAT1 and STAT3 to control Treg-induced effector T-cell senescence. Human Treg-induced T-cell senescence can be prevented via inhibition of the DNA damage response and/or STAT signaling in T-cell adoptive transfer mouse models. These studies identify molecular mechanisms of human Treg cell suppression and indicate that targeting Treg-induced T-cell senescence is a checkpoint for immunotherapy against cancer and other diseases associated with Treg cells.
Overview
The claims and statistics of this paper haven’t been checked yet.
Run the check — free, no account needed. It reads the open-access text and checks the sources it cites.
Integrity signals
Registry
Cites
Statistics
Figures
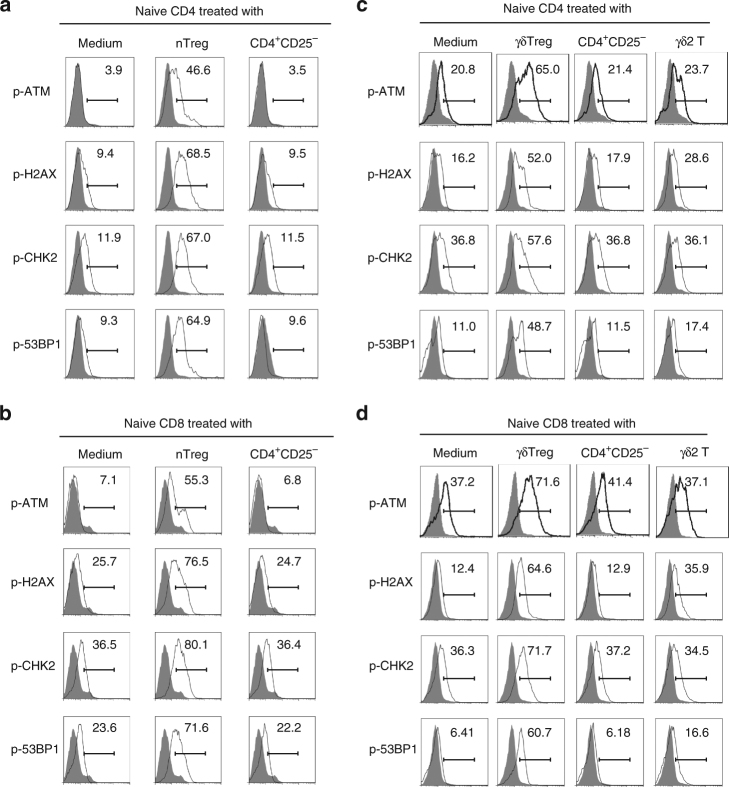
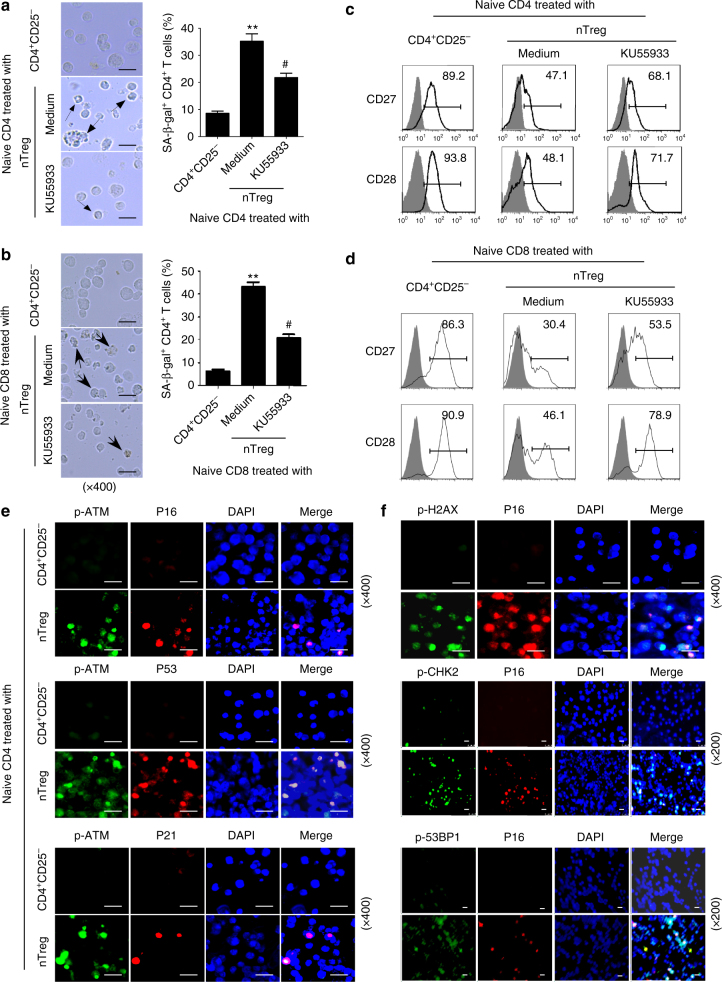
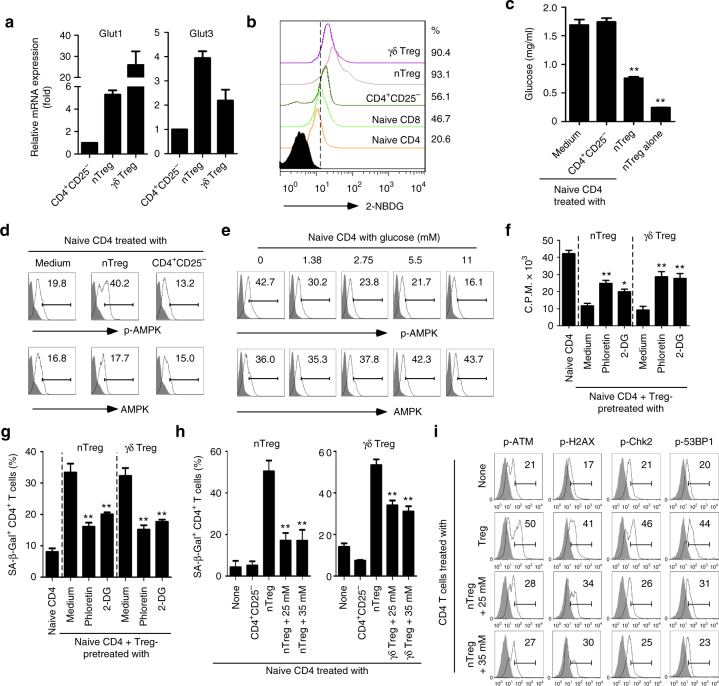
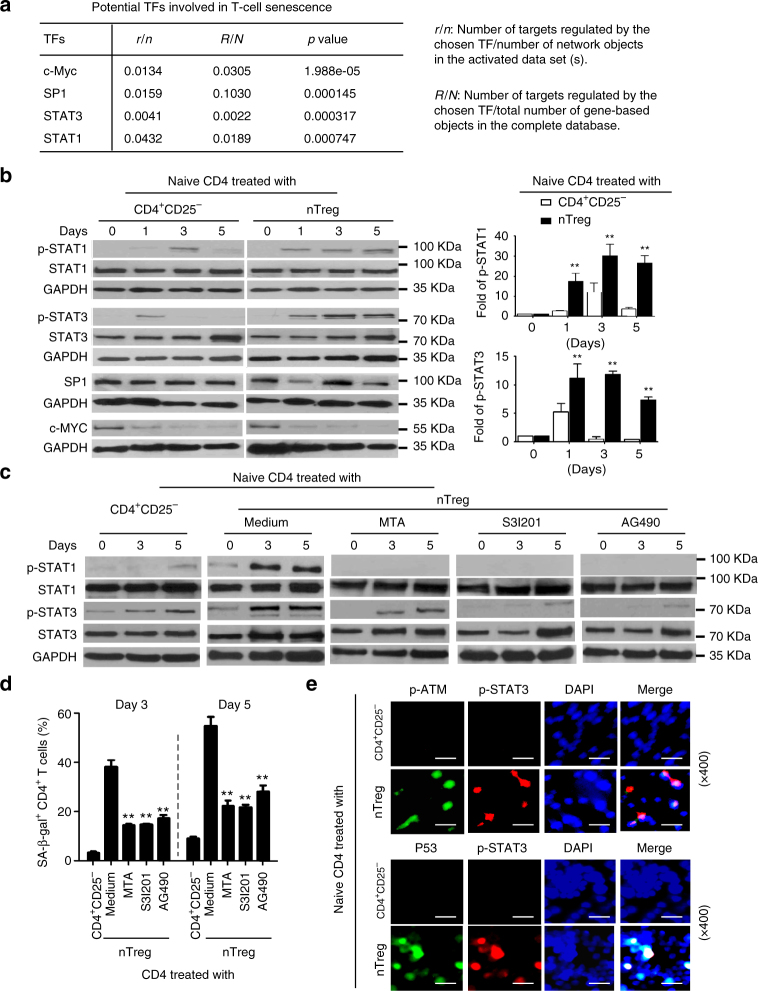
Verification
Claims the paper makes
The claims and statistics of this paper haven’t been checked yet.
Run the check — free, no account needed. It reads the open-access text and checks the sources it cites.
Claims other papers make about this one
Each is checked against this paper’s own text: does it say what the citing paper says it does?
In the citing paper
“The role of immunosenescence in tumors is sophisticated: the many factors involved include cAMP, glucose competition, and oncogenic stress in the tumor microenvironment, which can induce the senescence of T cells, macrophages, natural killer cells, and dendritic cells.”
From Immunosenescence: a key player in cancer development (2020) · cites this paper as [53]
In the citing paper
“In addition, tumor cells activate the PKA-CREB and P38 pathways by producing cAMP, thereby causing DNA damage and senescence of T cells [51, 53, 58–63].”
From Immunosenescence: a key player in cancer development (2020) · cites this paper as [53]
Self-check
Percentages, sums and reported differences re-computed from the paper’s own numbers.
The self-check needs the paper’s full text.
Citations
Cites
PD-1 and PD-L1 Immune Checkpoint Blockade to Treat Breast Cancer
Hartkopf, A. D., Taran, F., Wallwiener, M., Walter, C. B., Krämer, B., Grischke, E., & Brucker, S. Y. (2016) · Breast Care · doi:10.1159/000453569 · Cited by 30,989
The blockade of immune checkpoints in cancer immunotherapy
Pardoll, D. M. (2012) · Nature Reviews Cancer · doi:10.1038/nrc3239 · Cited by 13,838
Molecular and cellular insights into T cell exhaustion
Wherry, E. J., & Kurachi, M. (2015) · Nature Reviews Immunology · doi:10.1038/nri3862 · Cited by 4,652
Cellular senescence: when bad things happen to good cells
Campisi, J., & d'Adda di Fagagna, F. (2007) · Nature Reviews Molecular Cell Biology · doi:10.1038/nrm2233 · Cited by 4,441
Vignali, D. A. A., Collison, L. W., & Workman, C. J. (2008) · Nature Reviews Immunology · doi:10.1038/nri2343 · Cited by 3,463
Watterson, K. R., Bestow, D., Gallagher, J. R., Hamilton, D. L., Ashford, F. B., Meakin, P. J., & Ashford, M. L. J. (2012) · Neurosignals · doi:10.1159/000334144 · Cited by 3,395
Metabolic Competition in the Tumor Microenvironment Is a Driver of Cancer Progression
Chang, C.-H., Qiu, J., O’Sullivan, D., Buck, M. D., Noguchi, T., Curtis, J. D., Chen, Q., Gindin, M., Gubin, M. M., van der Windt, G. J. W., et al. (2015) · Cell · doi:10.1016/j.cell.2015.08.016 · Cited by 3,331
Sakaguchi, S. (2003) · Annual Review of Immunology · doi:10.1146/annurev.immunol.21.120601.141122 · Cited by 3,315
Persistent DNA damage signalling triggers senescence-associated inflammatory cytokine secretion
Rodier, F., Coppé, J.-P., Patil, C. K., Hoeijmakers, W. A. M., Muñoz, D. P., Raza, S. R., Freund, A., Campeau, E., Davalos, A. R., & Campisi, J. (2009) · Nature Cell Biology · doi:10.1038/ncb1909 · Cited by 2,232
Molecular Signature of CD8+ T Cell Exhaustion during Chronic Viral Infection
Wherry, E. J., Ha, S.-J., Kaech, S. M., Haining, W. N., Sarkar, S., Kalia, V., Subramaniam, S., Blattman, J. N., Barber, D. L., & Ahmed, R. (2007) · Immunity · doi:10.1016/j.immuni.2007.09.006 · Cited by 2,103
Cited by
Sorted by citations
Items 101–200 of 224
Senescence and Cancer: Role of Nitric Oxide (NO) in SASP
Mabrouk, N., Ghione, S., Laurens, V., Plenchette, S., Bettaı̈eb, A., & Paul, C. (2020) · Cancers · doi:10.3390/cancers12051145 · Cited by 28
Metabolic checkpoints and novel approaches for immunotherapy against cancer
Li, Y., Tang, J., Jiang, J., & Chen, Z. (2021) · International Journal of Cancer · doi:10.1002/ijc.33781 · Cited by 29
Admasu, T. D., & Yu, J. S. (2025) · Aging Cell · doi:10.1111/acel.70055 · Cited by 30
Fu, T., Jin, X., He, M., Chen, Y.-Y., Yang, Y., Chen, L., Zhang, H.-Y.-L., Fan, L., Wu, J., Wang, Z.-H., et al. (2025) · Science Translational Medicine · doi:10.1126/scitranslmed.adj7808 · Cited by 26
Senescent Stromal Cells in the Tumor Microenvironment: Victims or Accomplices?
Ye, M., Huang, X., Wu, Q., & Liu, F. (2023) · Cancers · doi:10.3390/cancers15071927 · Cited by 27
T cell exhaustion and senescence for ovarian cancer immunotherapy
Zhao, J., Wang, Z., Tian, Y., Ning, J., & Ye, H. (2024) · Seminars in Cancer Biology · doi:10.1016/j.semcancer.2024.07.001 · Cited by 26
Gao, D., Kan, P., He, Y., Sun, S., Tang, L., & Yang, F. (2025) · Frontiers in Immunology · doi:10.3389/fimmu.2025.1656733 · Cited by 25
Senescent Tumor CD8+ T Cells: Mechanisms of Induction and Challenges to Immunotherapy
Liu, W., Stachura, P., Xu, H. C., Bhatia, S., Borkhardt, A., Lang, P. A., & Pandyra, A. A. (2020) · Cancers · doi:10.3390/cancers12102828 · Cited by 27
TRIM15 drives chondrocyte senescence and osteoarthritis progression
Li, Z., Zhang, W., Xiao, W., Hu, J. Z., Hu, X., Liu, H., Lü, J., Shen, S., & Ji, M.-L. (2025) · Science Translational Medicine · doi:10.1126/scitranslmed.adq1735 · Cited by 26
Reprogramming cellular senescence and aging clocks for advanced cancer immunotherapy
Yang, H., Liu, D., Qiu, L., Wang, R., Zhang, C., Yu, D., Zhong, Q., Yuki, N., Song, Z., Zhu, Τ., et al. (2025) · Molecular Cancer · doi:10.1186/s12943-025-02459-8 · Cited by 30
Gut microbiota and immunosenescence in cancer
Xu, Y., He, C., Xi, Y., Zhang, Y., & Bai, Y. (2024) · Seminars in Cancer Biology · doi:10.1016/j.semcancer.2024.07.004 · Cited by 23
Self-citationWhen DNA damage responses meet tumor immunity: From mechanism to therapeutic opportunity
Pan, D., Wang, Q., Shen, A., Qi, Z., Zheng, C., & Hu, B. (2024) · International Journal of Cancer · doi:10.1002/ijc.34954 · Cited by 21
Nguyen, H. Q., Belkacémi, Y., Mann, C., Hoffschir, F., Kerbrat, S., Surénaud, M., Zadigue, P., TAILLE, A. D. L., Roméo, P., & Gouvello, S. L. (2019) · International Journal of Radiation Oncology*Biology*Physics · doi:10.1016/j.ijrobp.2019.10.045 · Cited by 23
Accumulation of CD28null Senescent T-Cells Is Associated with Poorer Outcomes in COVID19 Patients
Coleman, M. J., Zimmerly, K. M., & Yang, X. O. (2021) · Biomolecules · doi:10.3390/biom11101425 · Cited by 20
The cell cycle regulator p16 promotes tumor infiltrated CD8+ T cell exhaustion and apoptosis
Zhang, X., Wang, J., Tang, K., Yang, Y., Liu, X., Yuan, S., Guo, F., Zhang, L., & Ma, K. (2024) · Cell Death and Disease · doi:10.1038/s41419-024-06721-7 · Cited by 21
Self-citationImplications of Senescent T Cells for Cancer Immunotherapy
Kasamatsu, T. (2023) · Cancers · doi:10.3390/cancers15245835 · Cited by 20
Gökalp, F. (2021) · Nutrition and Cancer · doi:10.1080/01635581.2021.1895233 · Cited by 18
Gu, W., Wang, L., Wu, Y., & Liu, J. (2018) · Clinical and Experimental Pharmacology and Physiology · doi:10.1111/1440-1681.13056 · Cited by 18
de Nałęcz, A. K., Ciszak, L., Usnarska‐Zubkiewicz, L., Frydecka, I., Pawlak, E., Szmyrka−Kaczmarek, M., & Kosmaczewska, A. (2021) · International Journal of Molecular Sciences · doi:10.3390/ijms22179298 · Cited by 18
Aging-associated immune system changes in multiple myeloma: The dark side of the moon.
Visram, A., & Kourelis, T. (2021) · Cancer Treatment and Research Communications · doi:10.1016/j.ctarc.2021.100494 · Cited by 20
Jinna, N., Rida, P. C. G., Su, T., Gong, Z., Yao, S., LaBarge, M. A., Natarajan, R. D., Jovanović‐Talisman, T., Ambrosone, C. B., & Seewaldt, V. L. (2022) · Cells · doi:10.3390/cells11233818 · Cited by 21
Integrin-linked kinase control dental pulp stem cell senescence via the mTOR signaling pathway
Chen, L., Wang, X., Tian, S., Zhou, L., Wang, L., Liu, X., Yang, Z., Fu, G., Liu, X., Ding, C., et al. (2024) · Stem Cells · doi:10.1093/stmcls/sxae047 · Cited by 17
Self-citationZhang, J., Guan, X., & Zhong, X. (2024) · Seminars in Cancer Biology · doi:10.1016/j.semcancer.2024.10.006 · Cited by 20
Decoding T cell senescence in cancer: Is revisiting required?
Magkouta, S., Markaki, E., Evangelou, K., Petty, R., Verginis, P., & Gorgoulis, V. G. (2024) · Seminars in Cancer Biology · doi:10.1016/j.semcancer.2024.11.003 · Cited by 17
Fungi, immunosenescence and cancer
Xu, B., Luo, Z., Niu, X., Li, Z., Lu, Y., & Li, J. (2025) · Seminars in Cancer Biology · doi:10.1016/j.semcancer.2025.01.002 · Cited by 17
Immunometabolism of regulatory T cells in cancer
Galgani, M., Bruzzaniti, S., Rocca, C. L., Micillo, T., de Candia, P., Bifulco, M., & Matarese, G. (2020) · Molecular Aspects of Medicine · doi:10.1016/j.mam.2020.100936 · Cited by 17
Zhang, J., He, T., Yin, Z., Shang, C., Xue, L., & Guo, H. (2022) · Frontiers in Oncology · doi:10.3389/fonc.2022.864021 · Cited by 20
Participation of T cells in generating immune protection against cancers
Deo, A. S., Shrijana, Sruthika, S. U., Karun, S., Bisaria, K., & Sarkar, K. (2024) · Pathology - Research and Practice · doi:10.1016/j.prp.2024.155534 · Cited by 18
Wen, S., Zhong, Z., He, L., Zhao, D., Chen, X., Mi, H., & Liu, F. (2021) · Journal of Ethnopharmacology · doi:10.1016/j.jep.2021.114109 · Cited by 16
Targeting regulatory T cell metabolism in disease: Novel therapeutic opportunities
Halvorson, T., Tuomela, K., & Levings, M. K. (2023) · European Journal of Immunology · doi:10.1002/eji.202250002 · Cited by 18
Regulatory T cells as therapeutic targets and mediators
Sharma, A., & Rudra, D. (2019) · International Reviews of Immunology · doi:10.1080/08830185.2019.1621310 · Cited by 17
Das, J. K., Ren, Y., Kumar, A., Peng, H., Wang, L., Xiong, X., Alaniz, R. C., de Figueiredo, P., Ren, X., Liu, X., et al. (2022) · Science Advances · doi:10.1126/sciadv.abl9783 · Cited by 14
Self-citationSenescent T Cells in Age-Related Diseases
Yu, P.-J., Zhou, M. L., Liu, Y., & Du, J. (2024) · Aging and Disease · doi:10.14336/ad.2024.0219 · Cited by 16
Characteristics and mechanisms of T‐cell senescence: A potential target for cancer immunotherapy
Wu, H., Li, J., Zhang, Z., & Zhang, Y. (2024) · European Journal of Immunology · doi:10.1002/eji.202451093 · Cited by 14
Self-citationHurdle or thruster: Glucose metabolism of T cells in anti-tumour immunity
Zhang, S., Zhang, X., Yang, H., Liang, T., & Bai, X. (2023) · Biochimica et Biophysica Acta (BBA) - Reviews on Cancer · doi:10.1016/j.bbcan.2023.189022 · Cited by 14
Li, Y., Zhang, N., Ma, C., Xu, W., Jin, G., Zheng, Y., Zhang, L., Liu, B., Gao, C., & Liu, S. (2021) · Cell Death and Disease · doi:10.1038/s41419-021-04289-0 · Cited by 13
Zhou, Y., Xiao, L., Long, G., Cao, J., Liu, S., Tao, Y., Zhou, L., & Tang, J. (2022) · Frontiers in Immunology · doi:10.3389/fimmu.2022.921182 · Cited by 13
Kulikowska de Nałęcz, A., Ciszak, L., Usnarska-Zubkiewicz, L., Pawlak, E., Frydecka, I., Szmyrka, M., & Kosmaczewska, A. (2023) · International Journal of Molecular Sciences · doi:10.3390/ijms24065730 · Cited by 13
Shi, H., Xiao, M., Li, Y., Liu, X., Na, J., Liang, C., Hua, J., Meng, Q., Wei, M., Wang, W., et al. (2025) · Theranostics · doi:10.7150/thno.112633 · Cited by 12
Self-citationCD8+ T cell stressors converge on shared metabolic–epigenetic networks
Shangguan, Y., Wang, J., Ho, P., & Xu, Y. (2025) · Trends in Endocrinology and Metabolism · doi:10.1016/j.tem.2025.08.009 · Cited by 14
Lin, Y., Luo, S., Wei, J., Lin, S., Wang, D., Zhao, X., Feng, Z., Shen, Y., & Chen, Q. (2025) · International Journal of Molecular Sciences · doi:10.3390/ijms26199669 · Cited by 12
TLR8 reprograms human Treg metabolism and function
Liu, X., Li, L., & Peng, G. (2019) · Aging · doi:10.18632/aging.102223 · Cited by 12
Self-citationRegulatory T Cells in Tumor Microenvironment: Therapeutic Approaches and Clinical Implications
Sureka, N., & Zaheer, S. (2025) · Cell Biology International · doi:10.1002/cbin.70031 · Cited by 13
To Remember or to Forget: The Role of Good and Bad Memories in Adoptive T Cell Therapy for Tumors
Mondino, A., & Manzo, T. (2020) · Frontiers in Immunology · doi:10.3389/fimmu.2020.01915 · Cited by 11
Huang, M., & Dong, J. (2021) · Journal of Immunology Research · doi:10.1155/2021/8816055 · Cited by 11
Immunosenescence: Molecular Mechanisms, Diseases, and Therapeutic Innovations
Gong, N., Pan, X., Deng, Y., Che, J., Bao, J., Wang, M., Xu, C., Liu, X., & Shi, Y. (2025) · MedComm · doi:10.1002/mco2.70515 · Cited by 14
Self-citationKasamatsu, T., Awata, M., Ishihara, R., Murakami, Y., Masuda, Y., Gotoh, N., Oda, T., Yokohama, A., Matsumura, I., Handa, H., et al. (2023) · Clinical and Experimental Medicine · doi:10.1007/s10238-023-01034-z · Cited by 10
High Levels of CD244 Rather Than CD160 Associate With CD8+ T-Cell Aging
Wang, X., Wang, D., Du, J., Wei, Y., Song, R., Wang, B., Qiu, S., Li, B., Zhang, L., Zeng, Y., et al. (2022) · Frontiers in Immunology · doi:10.3389/fimmu.2022.853522 · Cited by 10
Wang, Z., Chen, C., Ai, J., Gao, Y., Wang, L., Xia, S., Jia, Y., & Qin, Y. (2025) · MedComm · doi:10.1002/mco2.70048 · Cited by 12
Immunosenescence and organoids: pathophysiology and therapeutic opportunities
Kamroo, A., Kakroudi, M. H., Sarmadian, A. J., Firouzabadi, A., Mousavi, S., Yazdanpanah, N., Saleki, K., & Rezaei, N. (2025) · Immunity & Ageing · doi:10.1186/s12979-025-00530-y · Cited by 12
Regulatory T Cell Metabolism in Cancer
Mortezaee, K. (2025) · Immunology · doi:10.1111/imm.70096 · Cited by 15
Carroll, K. R., Elfers, E. E., Stevens, J., McNally, J. P., Hildeman, D. A., Jordan, M. B., & Katz, J. D. (2018) · Diabetes · doi:10.2337/db18-0204 · Cited by 10
What Are the Roles of Proprotein Convertases in the Immune Escape of Tumors?
Mehranzadeh, E., Crende, O., Badiola, I., & García-Gallastegui, P. (2022) · Biomedicines · doi:10.3390/biomedicines10123292 · Cited by 9
Kinney, B. L. C., Brammer, B., Kansal, V., Parrish, C. J., Kissick, H. T., Liu, Y., Saba, N. F., Buchwald, Z. S., El‐Deiry, M. W., Patel, M. R., et al. (2024) · OncoImmunology · doi:10.1080/2162402x.2024.2367777 · Cited by 10
Cheng, J., Zheng, J., Ma, C., Li, Y., & Hao, H. (2025) · Seminars in Cancer Biology · doi:10.1016/j.semcancer.2025.05.010 · Cited by 8
Causes and consequences of T cell DNA damage
Koufaris, C., Berger, M., & Aqeilan, R. I. (2025) · Trends in Immunology · doi:10.1016/j.it.2025.04.006 · Cited by 8
Impact and potential value of immunosenescence on solid gastrointestinal tumors
Zhang, T., Wen, R., Fan, H., Yu, Y., Jia, H., Peng, Z., Zhou, L., Yu, G., & Zhang, W. (2024) · Frontiers in Immunology · doi:10.3389/fimmu.2024.1375730 · Cited by 8
Immunosenescence in skeletal muscle: The role-play in cancer cachexia chessboard
Giovarelli, M., Mocciaro, E., Carnovale, C., Cervia, D., Perrotta, C., & Clementi, E. (2025) · Seminars in Cancer Biology · doi:10.1016/j.semcancer.2025.02.012 · Cited by 8
Benito-Lopez, J. J., Marroquin-Muciño, M., Perez-Medina, M., Chavez-Dominguez, R., Aguilar‐Cázares, D., Galicia-Velasco, M., & López-González, J. S. (2023) · Frontiers in Oncology · doi:10.3389/fonc.2022.1101503 · Cited by 7
Nutrition Interventions of Herbal Compounds on Cellular Senescence
Chen, Z., Wu, Y., Lin, Q., Cai, J., Liu, X., & Liang, Y. (2022) · Oxidative Medicine and Cellular Longevity · doi:10.1155/2022/1059257 · Cited by 8
Self-citationGiannotta, C., Castella, B., Tripoli, E., Grimaldi, D., Avonto, I., D’Agostino, M., Larocca, A., Kopecka, J., Grasso, M., Riganti, C., et al. (2022) · Frontiers in Immunology · doi:10.3389/fimmu.2022.1073227 · Cited by 7
Taechangam, N., Walker, N. J., & Borjesson, D. L. (2021) · Stem Cell Research & Therapy · doi:10.1186/s13287-021-02558-5 · Cited by 7
Exploring the Complexity and Promise of Tumor Immunotherapy in Drug Development
Feng, Y., He, C., Liu, C., Shao, B., Wang, D., & Wu, P. (2024) · International Journal of Molecular Sciences · doi:10.3390/ijms25126444 · Cited by 6
Ross, R. B., Gadwa, J., Yu, J., Darragh, L. B., Knitz, M. W., Nguyen, D., Olimpo, N. A., Abdelazeem, K. N. M., Nguyen, A. T., Corbo, S., et al. (2024) · Clinical Cancer Research · doi:10.1158/1078-0432.ccr-23-3433 · Cited by 7
SPROUT: spectral sparsification helps restore the spatial structure at single-cell resolution
Wang, J., Li, S., Chen, L., & Li, S. C. (2022) · NAR Genomics and Bioinformatics · doi:10.1093/nargab/lqac069 · Cited by 6
SATB1, senescence and senescence‐related diseases
Qi, W., Bai, J., Wang, R., Zeng, X., & Zhang, L. (2024) · Journal of Cellular Physiology · doi:10.1002/jcp.31327 · Cited by 6
Emran, T. B., Amin, M. A., Rab, S. O., Jahnavi, P., Vodeti, R., Gupta, J. K., Arjun, U. V. N. V., Umamaheswari, T. N., Balaji, P., Dayalan, G., et al. (2025) · 3 Biotech · doi:10.1007/s13205-025-04651-5 · Cited by 5
Gao, P., Zhou, C., Yang, H., Deng, S., Jiang, B., Wang, Z., Di, J., & Su, X. (2025) · Journal of Translational Medicine · doi:10.1186/s12967-025-06481-8 · Cited by 4
Senescent cancer cells in immune surveillance and evasion: mechanisms and therapeutic implications
De-chang, L., Wang, J., Wei, Y., Wu, H. Y., Yuan, S., Yang, M. J., & Sun, L. (2025) · Journal of Leukocyte Biology · doi:10.1093/jleuko/qiaf125 · Cited by 4
Aging modulation of the immune system and immunotherapy efficacy in cancer
Wang, Y., Liang, M., Mao, Y., Zhu, W., Shen, X., & Guan, W. (2026) · Frontiers in Immunology · doi:10.3389/fimmu.2026.1781885 · Cited by 5
Wu, F., Guo, Z., Guan, J., Xu, J. M., Chen, Y., & Chen, Z. (2026) · Journal of Gastroenterology and Hepatology · doi:10.1111/jgh.70359 · Cited by 4
Jung, M., Kim, H., Choi, E., Shin, M., & Shin, S. J. (2024) · Human Vaccines & Immunotherapeutics · doi:10.1080/21645515.2024.2317439 · Cited by 5
Li, Z., Luo, Y., & Shen, H. (2025) · Journal of Orthopaedic Surgery and Research · doi:10.1186/s13018-025-05473-0 · Cited by 4
Cellular Senescence in Cancer: Mechanisms, Roles in Tumor Progression, and Therapeutic Implications
Yan, J., Zhang, Y., Mao, G., Yu, J., Zhou, T., & Hao, J. (2025) · MedComm – Oncology · doi:10.1002/mog2.70029 · Cited by 3
Self-citationAging‐Driven Immunosuppression: The Role of Tregs in the Ovarian Tumor Microenvironment
Udumula, M. P., Anjaly, K., Rashid, F., Nematullah, M., Singh, H., Bhardwaj, T., Hijaz, M., Giri, S., Chini, E. N., Gibson, H. M., et al. (2026) · Aging Cell · doi:10.1111/acel.70510 · Cited by 4
Pîrlog, L.-M., Catana, A. M., Pitforodeschi, A.-D., Pilatec, A.-N., Băilă, R.-M., Rusu, I., Militaru, M.-S., Iordănescu, I. I., & Belbe, A.-A. (2026) · Genes · doi:10.3390/genes17060681 · Cited by 4
Singh, A. R., Herman, A., Dey, D., Menge, S., Singh, S., Tran, A., Matson, A. W., Mourad, A., Rangarajan, P., Masuria, R., et al. (2026) · Science Advances · doi:10.1126/sciadv.aea0567 · Cited by 3
Dong, C., Sun, Y., Zhang, Y., Qin, B., & Tao, L. (2022) · Journal of Oncology · doi:10.1155/2022/8177948 · Cited by 3
Self-citation[Latest Findings on the Function of Immune Metabolism in Tumor Immunity].
Yang, Y., Fan, D., Zheng, B.-H., & Zhou, S. (2023) · 四川大学学报:医学版 · doi:10.12182/20230560304 · Cited by 4
Watanabe, T., Yazaki, M., Yazaki, T., Furukawa, M., & Izumo, N. (2024) · Food Bioscience · doi:10.1016/j.fbio.2024.103903 · Cited by 3
Development of therapeutic cancer vaccines based on cancer immunity cycle
Zhang, J., Zheng, Y., Xu, L., Gao, J., Ou, Z., Zhu, M., & Wang, W. (2025) · Frontiers of Medicine · doi:10.1007/s11684-025-1134-6 · Cited by 2
Pre‐Encoded IFN‐I Sensitivity Exacerbates Memory T Cell Senescence in Solid Tumors
Nguyen, A., Walsh, S. R., Deng, L., Chen, L., & Wan, Y. (2025) · Advanced Science · doi:10.1002/advs.202504474 · Cited by 2
CD8+ T cell aging, senescence, and related disease
He, Z., Guo, F., Zhao, Q., & Lu, W. (2026) · Science China Life Sciences · doi:10.1007/s11427-025-3101-7 · Cited by 3
Mondal, S., Becker, N. J., Huo, Y., Zhang, P., Johnson, T. S., Landgren, O., Coffey, D. G., Walker, B. A., & Liu, E. (2026) · Biomedicines · doi:10.3390/biomedicines14071556 · Cited by 2
van den Broecke, L., der Vreken, A. V., Watté, F., Meeus, F., Veirman, K. D., Breckpot, K., Bruyne, E. D., & Menu, E. (2026) · Signal Transduction and Targeted Therapy · doi:10.1038/s41392-026-02923-x · Cited by 3
(2021) · Frontiers research topics · doi:10.3389/978-2-88966-718-5 · Cited by 3
Senescent T Cells: The Silent Culprit in Acute Myeloid Leukemia Progression?
Zhang, X., & Liu, L. (2024) · International Journal of Molecular Sciences · doi:10.3390/ijms252312550 · Cited by 2
T Cell Senescence and Tumor Immunotherapy
Liu, X., & Peng, G. (2018) · Springer eBooks · doi:10.1007/978-3-319-64597-1_136-1 · Cited by 2
Self-citationThe potential of cord blood to replenish young immune cells against cancer
Li, X., Cheng, L., Li, J., & Ren, R. (2021) · Aging and Cancer · doi:10.1002/aac2.12032 · Cited by 1
Jabrane‐Ferrat, N., Raffin, J., Gouilly, J., Najib, S., Iscache, A.-L., Marques, C., Hall, J., Jolivet, N., Combes, G., Viguerie, N., et al. (2025) · The Journals of Gerontology Series A · doi:10.1093/gerona/glaf112 · Cited by 1
Immune checkpoint inhibition in the context of aging
Baxevanis, C. N., & Tsitsilonis, O. (2025) · Ageing and Cancer Research & Treatment · doi:10.70401/acrt.2025.0002 · Cited by 1
cPLA2α-driven Cox-2/PGE2 axis promotes hypoxia-induced senescence in Jurkat T cells
Jung, J., Yang, Y., & Kim, Y. (2025) · Biochemical and Biophysical Research Communications · doi:10.1016/j.bbrc.2025.152894 · Cited by 1
Wang, N., Wang, C., Wang, X., Meng, Y., Cui, S., Zhao, K., Jia, Y., & Kong, F. (2026) · Biochimica et Biophysica Acta (BBA) - Reviews on Cancer · doi:10.1016/j.bbcan.2026.189587 · Cited by 1
Zhang, Y., Zhou, X., Wei, Y. Y., Zhang, H., Zhao, Y., Tong, H., Jiang, Z., Li, G., Jiang, Y., Yin, X., et al. (2026) · Cell Reports · doi:10.1016/j.celrep.2026.117583 · Cited by 1
Self-citationSodium Butyrate Promotes CD8 T Cell Response to Low Affinity Ligand
Yu, Z., Zhao, Y., Li, F., Chen, G., & Zhang, L. (2020) · International Conference on Biological Information and Biomedical Engineering (BIBE) · doi:10.1145/3403782.3403788 · Cited by 1
T Cell Senescence and Tumor Immunotherapy
Liu, X., & Peng, G. (2019) · Springer eBooks · doi:10.1007/978-3-319-99375-1_136 · Cited by 1
Self-citationSivakumar, S., Abu‐Shah, E., Ahern, D., Arbe-Barnes, E. H., Mangal, N., Reddy, S., Rendek, A., Easton, A., Kurz, E., Silva, M., et al. (2020) · bioRxiv (Cold Spring Harbor Laboratory) · doi:10.1101/2020.06.20.163071 · Cited by 1
Robust metabolic transcriptional components in 34,494 patient-derived samples and cell linesPreprint
Leeuwenburgh, V. C., Urzúa-Traslaviña, C. G., Bhattacharya, A., Walvoort, M. T. C., Jalving, M., de Jong, S., & Fehrmann, R. S. N. (2020) · bioRxiv (Cold Spring Harbor Laboratory) · doi:10.1101/2020.10.01.321950
The Paradigm of T Cells in Shaping Tumor Microenvironment
Roy, D., Bose, S., Dutta, S., & Sa, G. (2020) · Trends in Oncology · doi:10.37155/2717-5278-0202-2
Spectral sparsification helps restore the spatial structure at single-cell resolutionPreprint
Wang, J., Li, S., Chen, L., & Li, S. C. (2022) · bioRxiv (Cold Spring Harbor Laboratory) · doi:10.1101/2022.01.25.477389
Metadata
- Authors
- Liu, X., Mo, W., Ye, J., Li, L., Zhang, Y., Hsueh, E. C., Hoft, D. F., & Peng, G.
- Affiliations
- Saint Louis University (US)
- Corresponding author
- Peng, Guangyong
- Venue
- Nature Communications
- Published
- 2018-01-16
- Volume
- 9
- Issue
- 1
- Pages
- 249-249
- ISSN
- 2041-1723 (ISSN-L)
- PMC
- PMC5770447
- OpenAlex
- W2782893319
- Cited by
- 224
- References
- 64
- Citations by year
- 2026: 17 · 2025: 40 · 2024: 39 · 2023: 16 · 2022: 30 · 2021: 32 · 2020: 28 · 2019: 13 · 2018: 9
- FWCI
- 8.81
- Type
- journal article
- Language
- en
- Open access
- gold
- doi.org
- Locations
- Nature Communications (publishedVersion, cc-by)
- Europe PMC (PubMed Central) (publishedVersion, cc-by)
- PubMed Central (publishedVersion, cc-by)
- PubMed (publishedVersion)
- RePEc: Research Papers in Economics (submittedVersion)
- DOAJ (DOAJ: Directory of Open Access Journals) (submittedVersion)
- DOAJ (DOAJ: Directory of Open Access Journals) (submittedVersion, cc-by-sa)
- Funders
- American Cancer Society (RSG‐10‐160‐01‐LIB)
- Melanoma Research Alliance
- Washington University in St. Louis
- National Institutes of Health (AI097852)
- National Cancer Institute (R01CA184379)
- National Institute of Allergy and Infectious Diseases (R21AI094478, R21AI097852)
- Topics
- Life Sciences › Immunology and Microbiology › Immunology › T-cell and B-cell Immunology
- Life Sciences › Biochemistry, Genetics and Molecular Biology › Cell Biology › Telomeres, Telomerase, and Senescence
- Health Sciences › Medicine › Oncology › Cancer Immunotherapy and Biomarkers
- Keywords
- regulatory T cells, effector T cells, metabolic competition, DNA damage, ERK signaling, p38 MAPK signaling, STAT1, STAT3, DNA damage response, T cell exhaustion, anergy, adoptive T cell therapy, cancer immunotherapy, chronic infection
- MeSH terms
- DNA Damage, Glucose, Humans, Immunotherapy, Cellular Senescence, MAP Kinase Signaling System, T-Lymphocytes, Regulatory, STAT1 Transcription Factor, STAT3 Transcription Factor
About these checks
Registry, retraction, Cites and statistics results are computed, not judged, with one exception: a printed reference that no index lists is read once by a model before it counts as a citation error. Claims are extracted by a model and kept only when their quote appears verbatim in the text; each cited source is then checked, with a model’s help, for whether it says what the claim relies on. Those verdicts can be wrong — read the claim’s quote and the cited source before relying on one.
Statistics and arithmetic are recomputed, not judged.
Confidence bands are shown only for fields calibrated on our annotated test set. None is calibrated yet, so no band is shown.
What counts as a claim ›How we measure confidence ›How we check this ›
Are you an author, or do you see a problem with this page? Request a review
