

The DOI matches its Crossref record; 62 of the 62 references it cites were found in a registry or an index.
A spatial gradient of bacterial diversity in the human oral cavity shaped by salivary flow
Open accessAbstract
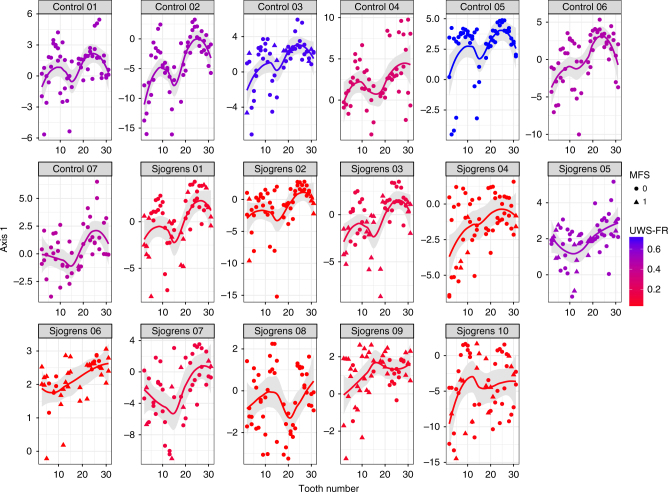
Spatial and temporal patterns in microbial communities provide insights into the forces that shape them, their functions and roles in health and disease. Here, we used spatial and ecological statistics to analyze the role that saliva plays in structuring bacterial communities of the human mouth using >9000 dental and mucosal samples. We show that regardless of tissue type (teeth, alveolar mucosa, keratinized gingiva, or buccal mucosa), surface-associated bacterial communities vary along an ecological gradient from the front to the back of the mouth, and that on exposed tooth surfaces, the gradient is pronounced on lingual compared to buccal surfaces. Furthermore, our data suggest that this gradient is attenuated in individuals with low salivary flow due to Sjögren’s syndrome. Taken together, our findings imply that salivary flow influences the spatial organization of microbial communities and that biogeographical patterns may be useful for understanding host physiological processes and for predicting disease.
Overview
The claims and statistics of this paper haven’t been checked yet.
Run the check — free, no account needed. It reads the open-access text and checks the sources it cites.
Integrity signals
Registry
Cites
Statistics
Figures
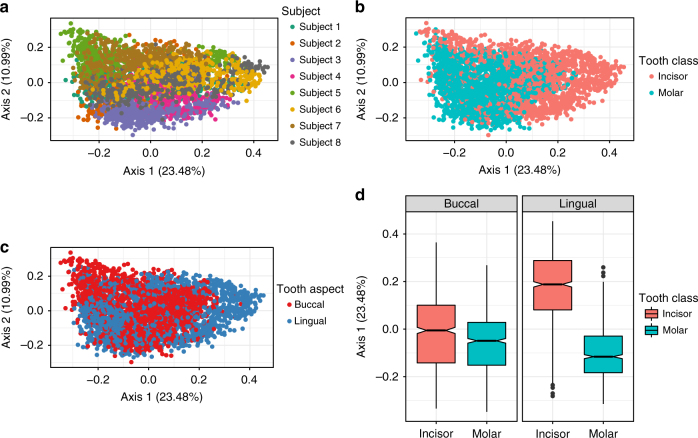
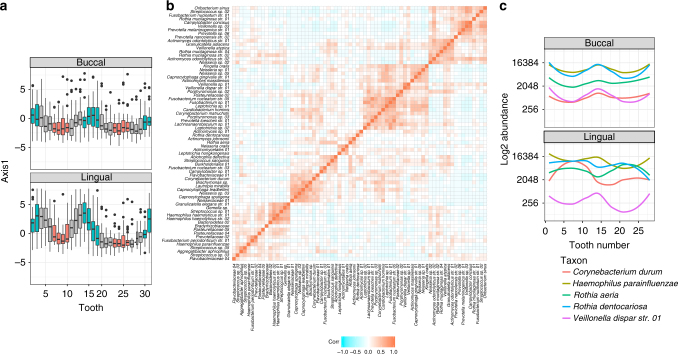
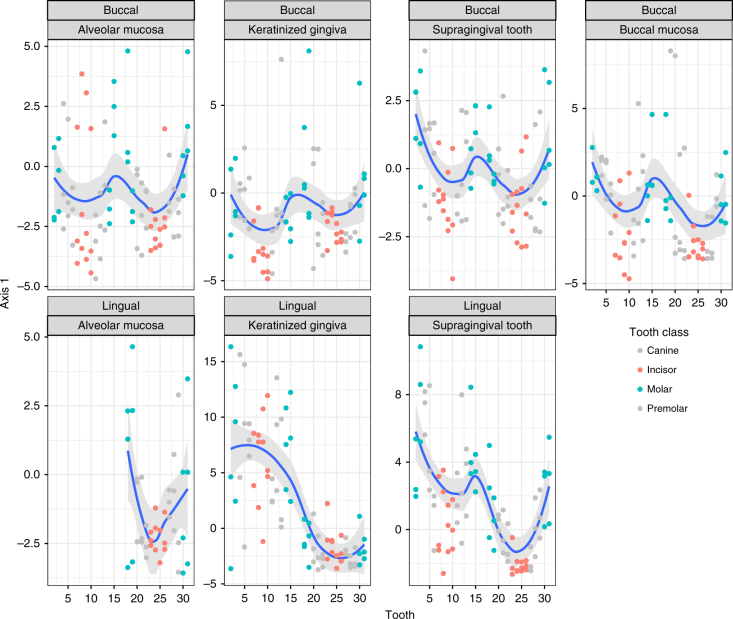
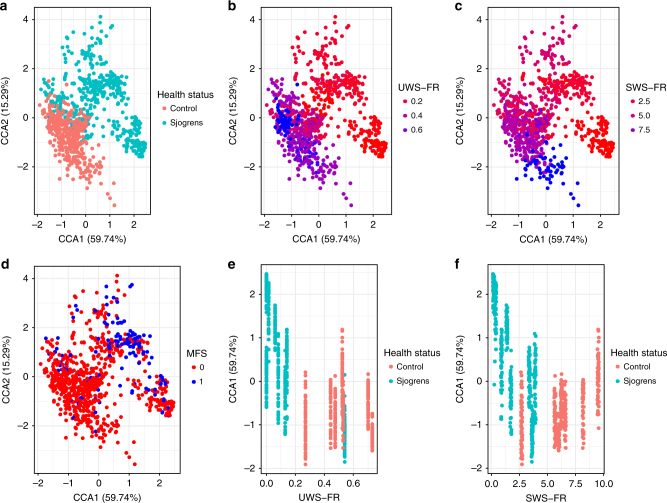
Verification
Claims the paper makes
The claims and statistics of this paper haven’t been checked yet.
Run the check — free, no account needed. It reads the open-access text and checks the sources it cites.
Claims other papers make about this one
Each is checked against this paper’s own text: does it say what the citing paper says it does?
In the citing paper
“Variation in the amount and velocity of salivary flow experienced by these sites, dictated by proximity to salivary glands, affects the composition of microbial communities harbored in distinct niches.231”
From The oral microbiome: Role of key organisms and complex networks in oral health and disease (2021) · cites this paper as [231]
In the citing paper
“The oral cavity as a microbial environment is further complicated by spatial gradients created by salivary flow, nutrient availability, oxygen concentration, saliva, and gingival crevicular fluids,61, 227, 231, 232 in addition to regular environmental disturbances caused by eating and mastication, facial movement related to speaking and expression, and oral hygiene practices.227”
From The oral microbiome: Role of key organisms and complex networks in oral health and disease (2021) · cites this paper as [231]
Self-check
Percentages, sums and reported differences re-computed from the paper’s own numbers.
The self-check needs the paper’s full text.
Citations
Cites
DADA2: High–resolution sample inference from Illumina amplicon data
Callahan, B. J., McMurdie, P. J., Rosen, M. J., Han, A. W., Johnson, A. J. A., & Holmes, S. P. (2016) · Nature Methods · doi:10.1038/nmeth.3869 · Cited by 35,698
Self-citationStructure, function and diversity of the healthy human microbiome
The Human Microbiome Project Consortium (2012) · Nature · doi:10.1038/nature11234 · Cited by 11,726
The ade4 Package: Implementing the Duality Diagram for Ecologists
Dray, S., & Dufour, A. (2007) · Journal of Statistical Software · doi:10.18637/jss.v022.i04 · Cited by 6,740
Landscape Ecology: The Effect Of Pattern On Process
Turner, M. G. (1989) · Annual Review of Ecology and Systematics · doi:10.1146/annurev.es.20.110189.001131 · Cited by 3,289
Exact sequence variants should replace operational taxonomic units in marker-gene data analysis
Callahan, B. J., McMurdie, P. J., & Holmes, S. (2017) · The ISME Journal · doi:10.1038/ismej.2017.119 · Cited by 3,253
Self-citationMicrobial biogeography: putting microorganisms on the map
Martiny, J. B. H., Bohannan, B. J. M., Brown, J. H., Colwell, R. K., Fuhrman, J. A., Green, J. L., Horner‐Devine, M. C., Kane, M. D., Krumins, J. A., Kuske, C. R., et al. (2006) · Nature Reviews Microbiology · doi:10.1038/nrmicro1341 · Cited by 3,093
Occlusal Caries: Biological Approach for Its Diagnosis and Management
Carvalho, J. C., Dige, I., Mačhiulskienė, V., Qvist, V., Bakhshandeh, A., Parolo, C. C. F., & Maltz, M. (2016) · Caries Research · doi:10.1159/000448662 · Cited by 2,159
Dray, S., Legendre, P., & Peres‐Neto, P. R. (2006) · Ecological Modelling · doi:10.1016/j.ecolmodel.2006.02.015 · Cited by 2,062
Shiboski, S. C., Shiboski, C. H., Criswell, L. A., Baer, A. N., Challacombe, S., Lanfranchi, H. E., Schiødt, M., Umehara, H., Vivino, F. B., Zhao, Y., et al. (2012) · Arthritis Care & Research · doi:10.1002/acr.21591 · Cited by 1,355
Defining the healthy “core microbiome” of oral microbial communities
Zaura, E., Keijser, B. J., Huse, S. M., & Crielaard, W. (2009) · BMC Microbiology · doi:10.1186/1471-2180-9-259 · Cited by 1,323
Cited by
Sorted by citations
Davis, N. M., Proctor, D. M., Holmes, S. P., Relman, D. A., & Callahan, B. J. (2018) · Microbiome · doi:10.1186/s40168-018-0605-2 · Cited by 3,493
Self-citationThe oral microbiome: Role of key organisms and complex networks in oral health and disease
Sedghi, L., DiMassa, V., Harrington, A., Lynch, S. V., & Kapila, Y. L. (2021) · Periodontology 2000 · doi:10.1111/prd.12393 · Cited by 755
Biogeography of the Oral Microbiome: The Site-Specialist Hypothesis
Mark Welch, J. L., Dewhirst, F. E., & Borisy, G. G. (2019) · Annual Review of Microbiology · doi:10.1146/annurev-micro-090817-062503 · Cited by 284
Identifying biases and their potential solutions in human microbiome studies
Nearing, J. T., Comeau, A. M., & Langille, M. G. I. (2021) · Microbiome · doi:10.1186/s40168-021-01059-0 · Cited by 240
Oral Microbiome Geography: Micron-Scale Habitat and Niche
Welch, J. L. M., Ramírez-Puebla, S. T., & Borisy, G. G. (2020) · Cell Host & Microbe · doi:10.1016/j.chom.2020.07.009 · Cited by 267
Metadata
- Authors
- Proctor, D. M., Fukuyama, J. A., Loomer, P. M., Armitage, G. C., Lee, S. A., Davis, N. M., Ryder, M. I., Holmes, S. P., & Relman, D. A.
- Affiliations
- University of California, San Francisco (US)
- Fred Hutch Cancer Center (US)
- Stanford Medicine (US)
- Stanford University (US)
- VA Palo Alto Health Care System (US)
- Corresponding author
- Relman, David A.
- ORCID
- Venue
- Nature Communications
- Published
- 2018-02-14
- Volume
- 9
- Issue
- 1
- Pages
- 681-681
- ISSN
- 2041-1723 (ISSN-L)
- PMC
- PMC5813034
- OpenAlex
- W2801640552
- Cited by
- 115
- References
- 62
- Citations by year
- 2026: 8 · 2025: 13 · 2024: 8 · 2023: 10 · 2022: 12 · 2021: 24 · 2020: 23 · 2019: 11 · 2018: 6
- FWCI
- 18.39
- Type
- journal article
- Language
- en
- Open access
- gold
- doi.org
- Locations
- Nature Communications (publishedVersion, cc-by)
- Europe PMC (PubMed Central) (publishedVersion, cc-by)
- PubMed Central (publishedVersion, cc-by)
- PubMed (publishedVersion)
- RePEc: Research Papers in Economics (submittedVersion)
- DOAJ (DOAJ: Directory of Open Access Journals) (submittedVersion)
- DOAJ (DOAJ: Directory of Open Access Journals) (submittedVersion, cc-by-sa)
- eScholarship (California Digital Library) (submittedVersion)
- eScholarship (California Digital Library) (submittedVersion, cc-by)
- IUScholarWorks Open (Indiana University) (submittedVersion)
- Funders
- National Institutes of Health (DP1OD000964)
- National Institute of General Medical Sciences (T32GM007276)
- National Institute of Allergy and Infectious Diseases (T32AI007328)
- National Institute of Dental and Craniofacial Research (R01DE023113)
- Division of Graduate Education
- Topics
- Health Sciences › Dentistry › Periodontics › Oral microbiology and periodontitis research
- Physical Sciences › Environmental Science › Ecology › Microbial Community Ecology and Physiology
- Life Sciences › Biochemistry, Genetics and Molecular Biology › Molecular Biology › Gut microbiota and health
- Keywords
- oral microbiota, salivary flow, spatial gradients, bacterial diversity, Sjögren's syndrome, dental plaque, oral mucosa, biogeography, microbial community structure, tooth surface
- MeSH terms
- Adult, Aged, Bacteria, Female, Humans, Male, Middle Aged, Mouth, Mouth Mucosa, RNA, Ribosomal, 16S, Saliva, Salivation, Sjogren's Syndrome, Tongue, Tooth, Genetic Variation, Xerostomia, Biodiversity, Young Adult
About these checks
Registry, retraction, Cites and statistics results are computed, not judged, with one exception: a printed reference that no index lists is read once by a model before it counts as a citation error. Claims are extracted by a model and kept only when their quote appears verbatim in the text; each cited source is then checked, with a model’s help, for whether it says what the claim relies on. Those verdicts can be wrong — read the claim’s quote and the cited source before relying on one.
Statistics and arithmetic are recomputed, not judged.
Confidence bands are shown only for fields calibrated on our annotated test set. None is calibrated yet, so no band is shown.
What counts as a claim ›How we measure confidence ›How we check this ›
Are you an author, or do you see a problem with this page? Request a review
