

The DOI matches its Crossref record; 62 of the 62 references it cites were found in a registry or an index.
Basal lamina remodeling at the skeletal muscle stem cell niche mediates stem cell self-renewal
Open accessAbstract
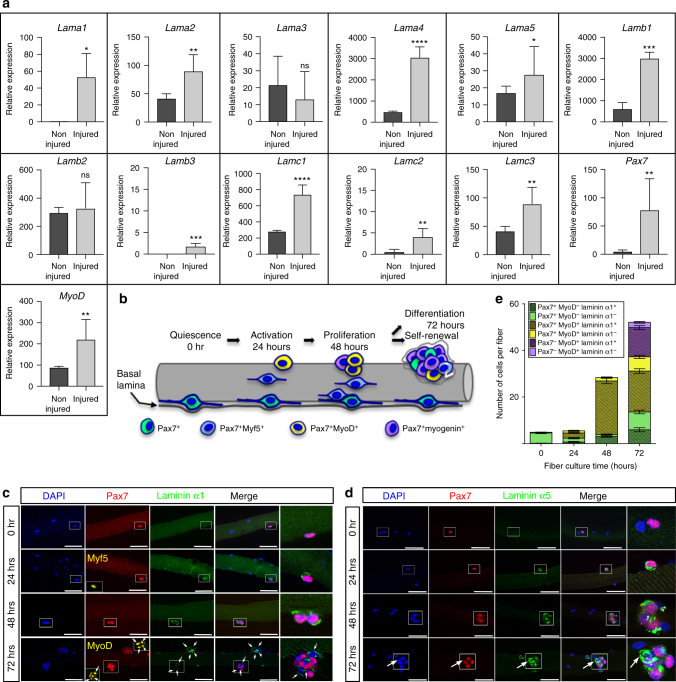
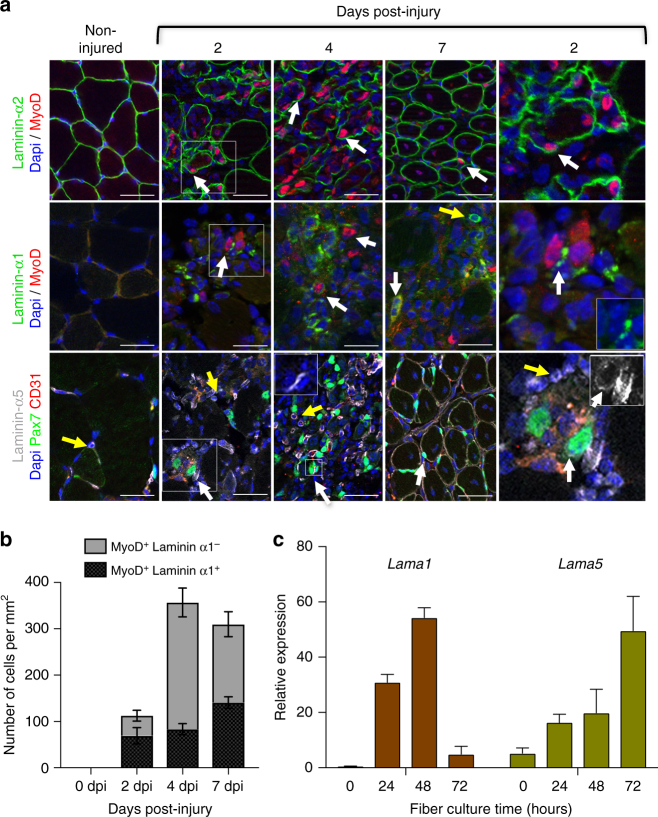
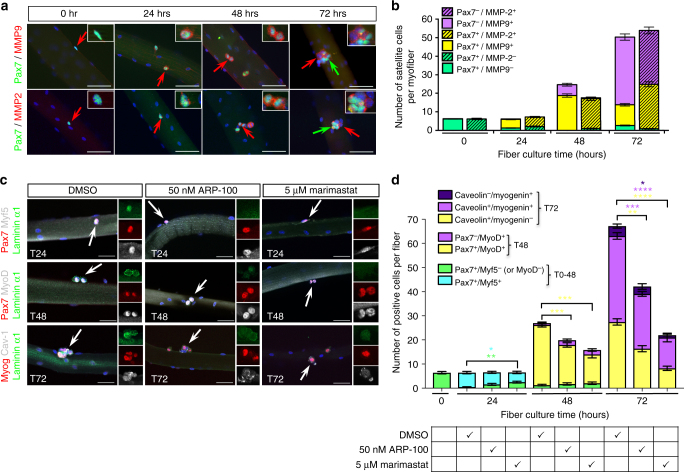
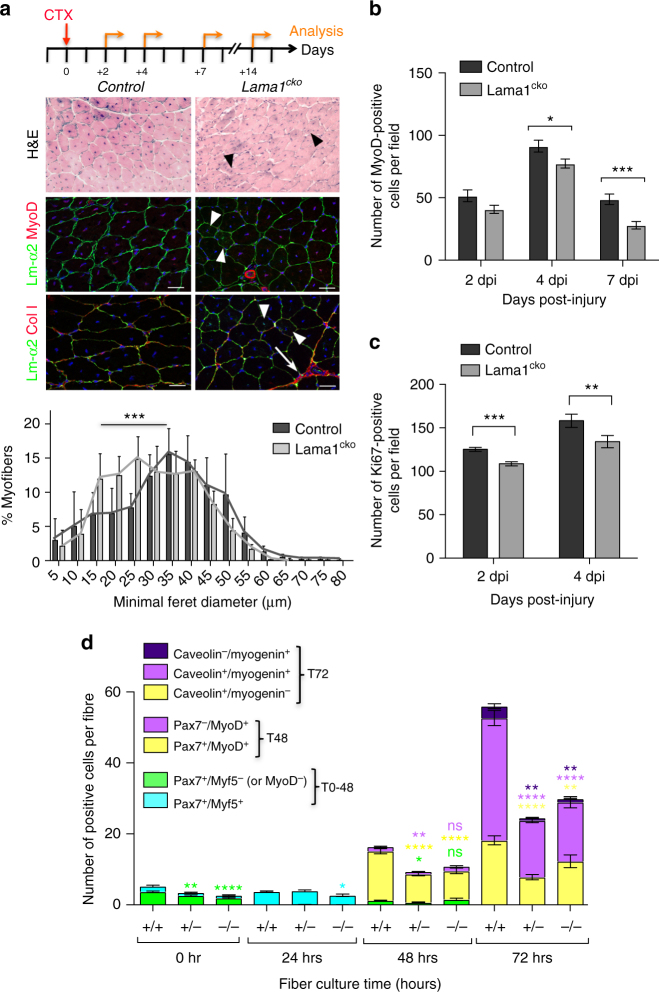
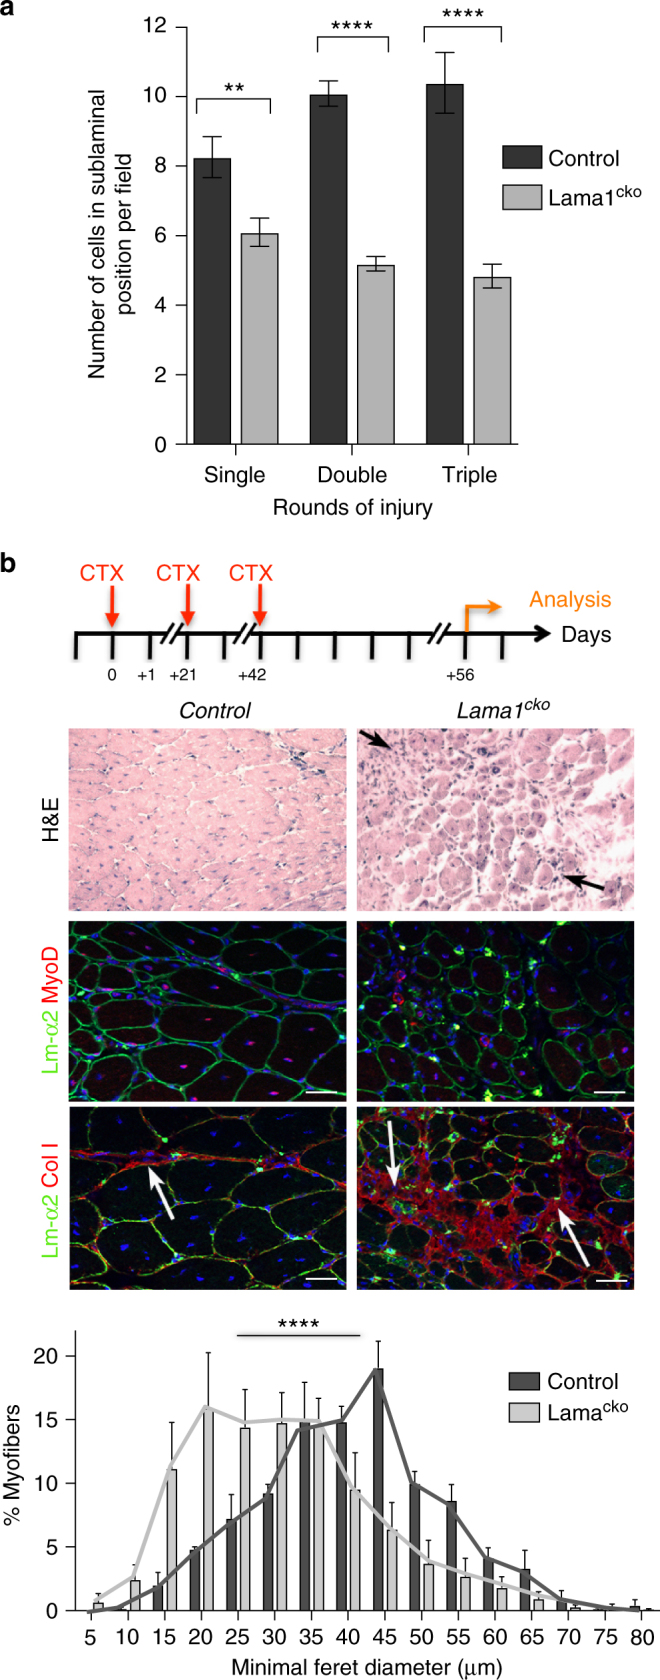
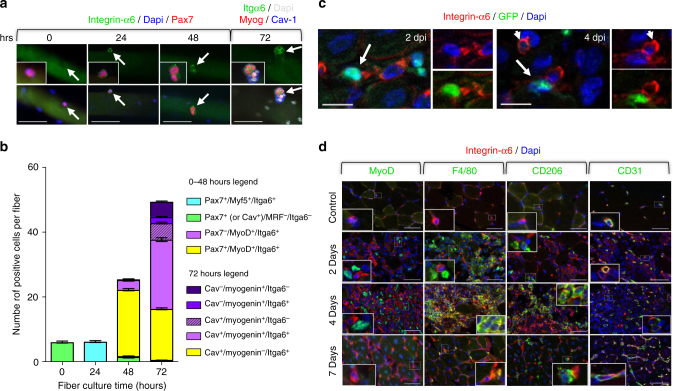
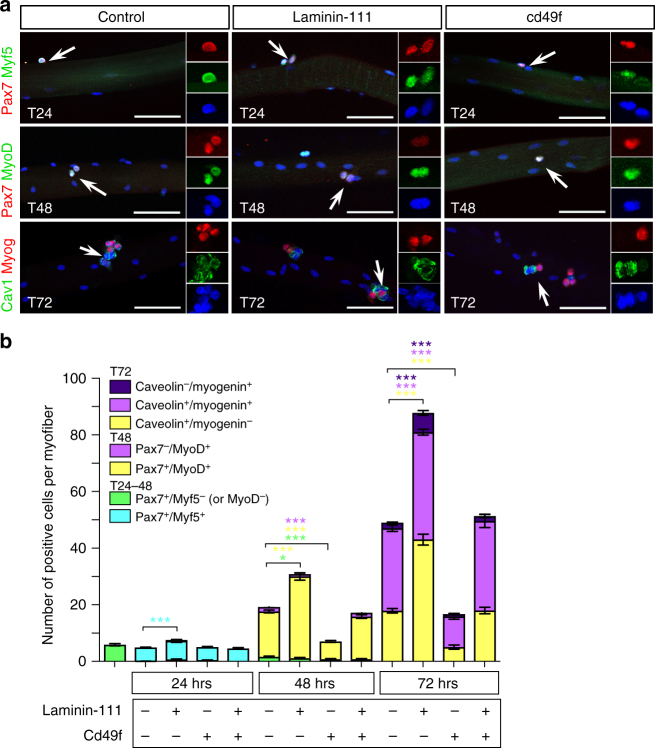
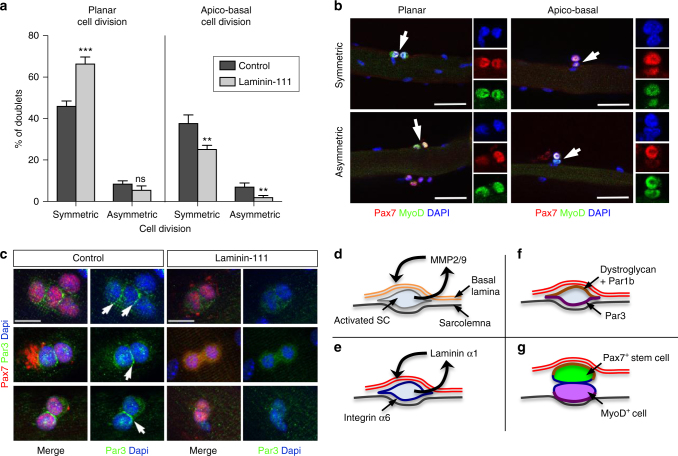
A central question in stem cell biology is the relationship between stem cells and their niche. Although previous reports have uncovered how signaling molecules released by niche cells support stem cell function, the role of the extra-cellular matrix (ECM) within the niche is unclear. Here, we show that upon activation, skeletal muscle stem cells (satellite cells) induce local remodeling of the ECM and the deposition of laminin-α1 and laminin-α5 into the basal lamina of the satellite cell niche. Genetic ablation of laminin-α1, disruption of integrin-α6 signaling or blocking matrix metalloproteinase activity impairs satellite cell expansion and self-renewal. Collectively, our findings establish that remodeling of the ECM is an integral process of stem cell activity to support propagation and self-renewal, and may explain the effect laminin-α1-containing supports have on embryonic and adult stem cells, as well as the regenerative activity of exogenous laminin-111 therapy.
Overview
The claims and statistics of this paper haven’t been checked yet.
Run the check — free, no account needed. It reads the open-access text and checks the sources it cites.
Integrity signals
Registry
Cites
Statistics
Figures
Verification
Claims the paper makes
The claims and statistics of this paper haven’t been checked yet.
Run the check — free, no account needed. It reads the open-access text and checks the sources it cites.
Claims other papers make about this one
Each is checked against this paper’s own text: does it say what the citing paper says it does?
In the citing paper
“Deletion of collagen VI or laminin-α1 (ECM components) or myofiber-specific deletion of O-fucosyltransferase 1 gene (Pofut1) impairs the self-renewal of SCs36–38, leading to the shrinkage of the SC pool after multiple muscle injuries.”
From In vivo partial reprogramming of myofibers promotes muscle regeneration by remodeling the stem cell niche (2021) · cites this paper as [36]
Self-check
Percentages, sums and reported differences re-computed from the paper’s own numbers.
The self-check needs the paper’s full text.
Citations
Cites
1 retracted
RETRACTED: Efficient gene modulation in mouse epiblast using a Sox2Cre transgenic mouse strain
Hayashi, S., Lewis, P. M., Pevny, L., & McMahon, A. P. (2002) · Gene Expression Patterns · doi:10.1016/s0925-4773(02)00292-7 · Cited by 113
RetractedAnalysis of Relative Gene Expression Data Using Real-Time Quantitative PCR and the 2−ΔΔCT Method
Livak, K. J., & Schmittgen, T. D. (2001) · Methods · doi:10.1006/meth.2001.1262 · Cited by 180,860
Mutation of the mouse klotho gene leads to a syndrome resembling ageing
Kuro-o, M., Matsumura, Y., Aizawa, H., Kawaguchi, H., Suga, T., Utsugi, T., Ohyama, Y., Kurabayashi, M., Kaname, T., Kume, E., et al. (1997) · Nature · doi:10.1038/36285 · Cited by 3,837
SATELLITE CELL OF SKELETAL MUSCLE FIBERS
Mauro, A. (1961) · The Journal of Cell Biology · doi:10.1083/jcb.9.2.493 · Cited by 3,683
Pax7 Is Required for the Specification of Myogenic Satellite Cells
Seale, P., Sabourin, L. A., Girgis-Gabardo, A., Mansouri, A., Gruß, P., & Rudnicki, M. A. (2000) · Cell · doi:10.1016/s0092-8674(00)00066-0 · Cited by 2,345
The relationship between the spleen colony-forming cell and the haemopoietic stem cell.
Schofield, R. (1978) · PubMed · Cited by 2,332
Spradling, A. C., Drummond‐Barbosa, D., & Kai, T. (2001) · Nature · doi:10.1038/35102160 · Cited by 1,465
Asymmetric self-renewal and commitment of satellite stem cells in muscle
Kuang, S., Kuroda, K., Le Grand, F., & Rudnicki, M. A. (2007) · Cell · doi:10.1016/j.cell.2007.03.044 · Cited by 1,449
Murphy, M. M., Lawson, J. A., Mathew, S. J., Hutcheson, D. A., & Kardon, G. (2011) · Development · doi:10.1242/dev.064162 · Cited by 1,249
Lepper, C., Partridge, T. A., & Fan, C.-M. (2011) · Development · doi:10.1242/dev.067595 · Cited by 1,105
Cited by
Sorted by citations
Items 101–200 of 218
Fujita, R., Mizuno, S., Sadahiro, T., Hayashi, T., Sugasawa, T., Sugiyama, F., Ono, Y., Takahashi, S., & Ieda, M. (2023) · iScience · doi:10.1016/j.isci.2023.106592 · Cited by 12
Muscle stem cell polarity requires QKI-mediated alternative splicing of Integrin Alpha-7 (Itga7)
Dominici, C., & Richard, S. (2022) · Life Science Alliance · doi:10.26508/lsa.202101192 · Cited by 12
Nasiri, R., Madadelahi, M., Nikmaneshi, M. R., Gökçe, B., Bijarchi, M. A., Shah, S., Tirpáková, Z., Gastel, D. V., Taebnia, N., de Barros, N. R., et al. (2025) · Biomaterials · doi:10.1016/j.biomaterials.2025.123739 · Cited by 14
CCN2 participates in overload-induced skeletal muscle hypertrophy
Petrosino, J. M., Longenecker, J. Z., Angell, C. D., Hinger, S. A., Martens, C. R., & Accornero, F. (2022) · Matrix Biology · doi:10.1016/j.matbio.2022.01.003 · Cited by 11
Tu, H., Zhang, D., Qian, J., Barksdale, A. N., Pipinos, I. I., Patel, K. P., Wadman, M. C., & Li, Y. (2021) · Injury · doi:10.1016/j.injury.2021.09.002 · Cited by 11
Nguyen, J., Wang, L., Lei, W., Hu, Y., Gulati, N., Chávez-Madero, C., Ahn, H., Ginsberg, H. J., Krawetz, R. J., Brandt, M., et al. (2024) · Journal of Cell Science · doi:10.1242/jcs.261666 · Cited by 10
The extracellular matrix niche of muscle stem cells
Chrysostomou, E., & Mourikis, P. (2024) · Current topics in developmental biology/Current Topics in Developmental Biology · doi:10.1016/bs.ctdb.2024.01.021 · Cited by 8
Claus, C., Slavin, M., Ansseau, E., Lancelot, C., Bah, K., Lassche, S., Fiévet, M., Greco, A., Tomaiuolo, S., Tassin, A., et al. (2023) · Skeletal Muscle · doi:10.1186/s13395-022-00310-y · Cited by 10
Cruz-Migoni, S. B., Imran, K. M., Wahid, A., Rahman, O., Briscoe, J., & Borycki, A. (2019) · bioRxiv (Cold Spring Harbor Laboratory) · doi:10.1101/2019.12.21.884601 · Cited by 10
Self-citationThen, A. H., Goenawan, H., Lesmana, R., Christoper, A., Sylviana, N., & Gunadi, J. W. (2024) · Biomedical Reports · doi:10.3892/br.2024.1917 · Cited by 9
Intrinsic dysfunction in muscle stem cells lacking dystrophin begins during secondary myogenesis
Esper, M. E., Lin, A. Y., Bennett, D., & Rudnicki, M. A. (2025) · Nature Communications · doi:10.1038/s41467-025-64999-3 · Cited by 9
Togninalli, M., Ho, A. T. V., Madl, C. M., Holbrook, C. A., Wang, Y. X., Magnusson, K. E. G., Kirillova, A., Chang, A. C. H., & Blau, H. M. (2023) · npj Regenerative Medicine · doi:10.1038/s41536-023-00277-4 · Cited by 12
Native collagen VI delays early muscle stem cell differentiation
Metti, S., Ros, F. D., Toniato, G., Cescon, M., & Bonaldo, P. (2024) · Journal of Cell Science · doi:10.1242/jcs.261419 · Cited by 9
Muller, Q., & Matsusaki, M. (2025) · Trends in Food Science & Technology · doi:10.1016/j.tifs.2025.105524 · Cited by 8
Girolamo, D. D., Benavente-Diaz, M., Murolo, M., Grimaldi, A., Lopes, P. T., Evano, B., Kuriki, M., Gioftsidi, S., Laville, V., Tinévez, J.-Y., et al. (2024) · Development · doi:10.1242/dev.202144 · Cited by 10
Duran, P., Yang, B. A., Plaster, E. M., Eiken, M. K., Loebel, C., & Aguilar, C. A. (2024) · Advanced Biology · doi:10.1002/adbi.202400091 · Cited by 9
Barraza‐Flores, P., Bukovec, K. E., Dagda, M., Conner, B., Oliveira‐Santos, A., Grange, R. W., & Burkin, D. J. (2020) · Human Molecular Genetics · doi:10.1093/hmg/ddaa104 · Cited by 8
Gutiérrez, J., González, D., Escalona‐Rivano, R., Takahashi, C., & Brandan, E. (2021) · The FASEB Journal · doi:10.1096/fj.202001646rr · Cited by 8
Identification of biomarkers indicative of functional skeletal stem cells
Qiryaqoz, Z., Timilsina, S., Czarnowski, D., Krebsbach, P. H., & Villa-Diaz, L. G. (2019) · Orthodontics and Craniofacial Research · doi:10.1111/ocr.12260 · Cited by 8
Effect of Notch1 signaling on muscle engraftment and maturation from pluripotent stem cells
Yamashita, A., Garay, B. I., Kim, H., Bosnakovski, D., Abrahante, J. E., Azzag, K., Abreu, P., Ahlquist, A., & Perlingeiro, R. C. R. (2025) · Stem Cell Reports · doi:10.1016/j.stemcr.2024.102396 · Cited by 7
Cell-Instructive Biomaterials with Native-Like Biochemical Complexity
Marjan, T., Lafuente‐Gómez, N., Rampal, A., Mooney, D. J., Peyton, S. R., & Qazi, T. H. (2025) · Annual Review of Biomedical Engineering · doi:10.1146/annurev-bioeng-120823-020209 · Cited by 8
Muscle Stem Cell Function Is Impaired in β2-Adrenoceptor Knockout Mice
Koike, T. E., Fuziwara, C. S., Brum, P. C., Kimura, E. T., Rando, T. A., & Miyabara, E. H. (2022) · Stem Cell Reviews and Reports · doi:10.1007/s12015-022-10334-y · Cited by 7
Olson, L. C., Nguyen, T., Sabalewski, E. L., Puetzer, J. L., Schwartz, Z., & McClure, M. J. (2024) · American Journal of Physiology-Cell Physiology · doi:10.1152/ajpcell.00502.2023 · Cited by 7
Wang, M., Hsu, C., Wu, C.-H., Chiou, L., Tsai, Y., Lee, M., & Lin, S. (2021) · Frontiers in Cell and Developmental Biology · doi:10.3389/fcell.2021.641987 · Cited by 7
3D Mechanical Confinement Directs Muscle Stem Cell Fate and Function
Park, G., Grey, J. A., Mourkioti, F., & Han, W. M. (2025) · Advanced Biology · doi:10.1002/adbi.202400717 · Cited by 7
Engineering of tissue in microphysiological systems demonstrated by modelling skeletal muscle
Gao, Y., Zhang, Z., Yao, Y., Zhang, J., Li, X., Yang, K., Si, N., Chen, Z., Gu, Z., & Yin, N. (2025) · Regenerative Biomaterials · doi:10.1093/rb/rbaf059 · Cited by 7
McGowan, T. J., Reinhard, J. R., Lewerenz, N., Białobrzeska, M., Lin, S., Stępniewski, J., Szade, K., Dulak, J., & Rüegg, M. A. (2025) · Nature Communications · doi:10.1038/s41467-025-65703-1 · Cited by 6
Impaired stem cell migration and divisions in Duchenne muscular dystrophy revealed by live imaging
Sarde, L., Letort, G., Varet, H., Laville, V., Fernandes, J., Tajbakhsh, S., & Evano, B. (2026) · Nature Communications · doi:10.1038/s41467-026-68474-5 · Cited by 9
Barhouse, P. S., Andrade, M. J., & Smith, Q. (2022) · Frontiers in Chemical Engineering · doi:10.3389/fceng.2022.832754 · Cited by 6
Zhang, H., Liu, Y., Li, C., & Zhang, W. (2022) · Life · doi:10.3390/life12070926 · Cited by 6
Reduced Expression of Septin7 Hinders Skeletal Muscle Regeneration
Szabó, L. Z., Telek, A., Fodor, J., Dobrosi, N., Dócs, K., Hegyi, Z., Gönczi, M., Csernoch, L. J., & Dienes, B. (2023) · International Journal of Molecular Sciences · doi:10.3390/ijms241713536 · Cited by 8
Musculoskeletal Diseases: Mechanisms and Therapeutic Advances
Ma, X., Yinwang, E., Chai, X., Wang, F., Chen, Z., Wang, S., Zhou, H., Xue, Y., Lei, J., Chen, F., et al. (2025) · MedComm · doi:10.1002/mco2.70519 · Cited by 7
Estrogen rescues muscle regeneration impaired by DUX4 in a humanized xenograft mouse model
Maiullari, S., Mele, G., Calandra, P., di Blasio, G., Valentini, S., Torcinaro, A., Manni, I., Teveroni, E., Mancino, F., Proietti, L., et al. (2025) · Cell Death and Disease · doi:10.1038/s41419-025-07827-2 · Cited by 5
Stem Cell-Based and Tissue Engineering Approaches for Skeletal Muscle Repair
Domenig, S. A., Palmer, A. S., & Bar‐Nur, O. (2021) · Reference series in biomedical engineering · doi:10.1007/978-3-030-44211-8_19 · Cited by 5
Cell-controlled dynamic surfaces for skeletal stem cell growth and differentiation
Anderson, H. J., Sahoo, J. K., Wells, J. A., Nuffel, S. V., Dhowre, H. S., Oreffo, R. O. C., Zelzer, M., Ulijn, R. V., & Dalby, M. J. (2022) · Scientific Reports · doi:10.1038/s41598-022-12057-z · Cited by 5
Loss of the matrix metalloproteinase-10 causes premature features of aging in satellite cells
Bobadilla, M., Orbe, J., Abizanda, G., Machado, F. J. D., Vilas‐Zornoza, A., Ullate‐Agote, A., Extramiana, L., Churio, A. B., Aranguren, X. L., Cantero, G., et al. (2023) · Frontiers in Cell and Developmental Biology · doi:10.3389/fcell.2023.1128534 · Cited by 5
Role of microenvironment on muscle stem cell function in health, adaptation, and disease
Helzer, D., Kannan, P., Reynolds, J. C., Gibbs, D. E., & Crosbie, R. H. (2024) · Current topics in developmental biology/Current Topics in Developmental Biology · doi:10.1016/bs.ctdb.2024.02.002 · Cited by 4
Zhang, W., Shen, J., Zhang, S., Liu, X., Pan, S., Li, Y., Zhang, L., He, L., & Niu, Y. (2021) · Oral Diseases · doi:10.1111/odi.13771 · Cited by 5
Ogawa, Y., Yamamoto, M., Sato, M., Odaka, K., Kasahara, M., Hinata, N., Sakiyama, K., & Abe, S. (2021) · Annals of Anatomy - Anatomischer Anzeiger · doi:10.1016/j.aanat.2021.151694 · Cited by 5
Liu, X., Wang, H., Xu, M., Wang, H., Wang, H., Fang, W., Li, M., Huang, J., Wang, H., Yu, Y., et al. (2026) · Cellular & Molecular Biology Letters · doi:10.1186/s11658-026-00908-w · Cited by 4
Li, C., Long, B., Deng, H., Sun, H., Liao, L., & Li, X. (2025) · Scientific Reports · doi:10.1038/s41598-025-16162-7 · Cited by 5
Louie, J. D., Barrios-Camacho, C. M., Bromberg, B. H., Hintschich, C. A., & Schwob, J. E. (2024) · iScience · doi:10.1016/j.isci.2024.109600 · Cited by 4
Localizations of Laminin Chains Suggest Their Multifaceted Functions in Mouse Tooth Development
Liang, T., Zhang, H., Hu, Y., Solanki, M., Zhang, C., Sasaki, T., Smith, C. E., Hu, J. C. ‐., & Simmer, J. P. (2025) · International Journal of Molecular Sciences · doi:10.3390/ijms26094134 · Cited by 4
Kino, J., Ichinohe, N., Ishii, M., Suzuki, H., Mizuguchi, T., Tanimizu, N., & Mitaka, T. (2019) · Hepatology Communications · doi:10.1002/hep4.1442 · Cited by 4
Overfeeding and Substrate Availability, But Not Age or BMI, Alter Human Satellite Cell Function
Fausnacht, D. W., McMillan, R. P., Boutagy, N. E., Lupi, R. A., Harvey, M. M., Davy, B. M., Davy, K. P., Rhoads, R. P., & Hulver, M. W. (2020) · Nutrients · doi:10.3390/nu12082215 · Cited by 4
Au, H., Peng, S.-W., Guo, C., Lin, C.-C., Wang, Y.-L., Kuo, Y., Law, T.-Y., Ho, H., Ling, T., & Huang, Y. (2021) · Frontiers in Cell and Developmental Biology · doi:10.3389/fcell.2021.646644 · Cited by 4
A digitally programmable 3D microenvironment directs satellite cell function
Zhao, S., Wu, L., Taiyari, S., Li, H., Sun, J., Chen, J., Song, W., & Cerletti, M. (2025) · Biomaterials · doi:10.1016/j.biomaterials.2025.123701 · Cited by 3
Mechanobiological landscape of muscle stem cells
Hirano, K., & Hara, Y. (2026) · Skeletal Muscle · doi:10.1186/s13395-026-00425-6 · Cited by 2
Decoding the forces that shape muscle stem cell function
Nguyen, J., & Gilbert, P. M. (2024) · Current topics in developmental biology/Current Topics in Developmental Biology · doi:10.1016/bs.ctdb.2024.02.009 · Cited by 3
Kristensen, M. A., Rich, K. K., Mogensen, T. C., Jensen, A. M. D., Svenningsen, Å. F., & Zhang, M. (2024) · Life · doi:10.3390/life14050543 · Cited by 3
Myotendinous Junction: Exercise Protocols Can Positively Influence Their Development in Rats
Neto, J. P., Rocha, L. C., Jacob, C. D. S., Tomiate, A. N., & Ciena, A. P. (2022) · Biomedicines · doi:10.3390/biomedicines10020480 · Cited by 3
Kindler, U., Mavrommatis, L., Käppler, F., Hiluf, D. G., Heilmann‐Heimbach, S., Marcus, K., Pomorski, T. G., Vorgerd, M., Brand‐Saberi, B., & Zaehres, H. (2025) · Cells · doi:10.3390/cells14131033 · Cited by 3
Stem Cell-Based and Tissue Engineering Approaches for Skeletal Muscle Repair
Domenig, S. A., Palmer, A. S., & Bar‐Nur, O. (2020) · Springer eBooks · doi:10.1007/978-3-030-18512-1_19-1 · Cited by 3
Considerations for enhanced mesenchymal stromal/stem cell myogenic commitment in vitro
Grobbelaar, S., Mercier, A. E., van den Bout, I., Durandt, C., & Pepper, M. S. (2023) · Clinical and Translational Science · doi:10.1111/cts.13703 · Cited by 3
Tian, Y., Zhang, Z., Wu, B., Liu, Z., Zhang, T., Fang, Y., & Xiong, Z. (2025) · Materials Today Communications · doi:10.1016/j.mtcomm.2025.113931 · Cited by 2
Liu, Y., Schüler, S. C., Dumontier, S., Balg, F., Bédard, S., Desgeorges, T., Feige, J. N., Boudreault, P., & Bentzinger, C. F. (2025) · Nature Communications · doi:10.1038/s41467-025-66582-2 · Cited by 2
TNAP expressing adventitial pericytes contribute to myogenesis during foetal development
Fancello, I., Willett, S., Castiglioni, C., Amer, S., Santoleri, S., Bragg, L., Galli, F., & Cossu, G. (2025) · Vascular Pharmacology · doi:10.1016/j.vph.2025.107489 · Cited by 2
Stem Cell-Based and Tissue Engineering Approaches for Skeletal Muscle Repair
Domenig, S. A., Palmer, A. S., & Bar‐Nur, O. (2020) · Repository for Publications and Research Data (ETH Zurich) · doi:10.3929/ethz-b-000430184 · Cited by 2
Zhu, H., Lin, X., & Diao, Y. (2021) · Journal of Bio-X Research · doi:10.1097/jbr.0000000000000105 · Cited by 2
Satellite Cells in Regeneration and DiseasePreprint
Esper, M. E., Saber, J., & Rudnicki, M. A. (2025) · Cold Spring Harbor Perspectives in Biology · doi:10.1101/cshperspect.a041474 · Cited by 2
Lou, P., Wang, Y., Zhang, Y., Zhou, X., Li, L., Liu, S., Wan, M., Lu, Y., & Liu, J. (2025) · Molecular Therapy · doi:10.1016/j.ymthe.2025.12.044 · Cited by 1
Dulos, J., Sun, R., Jovanovska, V., Kolb, F. A., & Stupka, N. (2026) · American Journal of Physiology-Cell Physiology · doi:10.1152/ajpcell.00443.2025 · Cited by 2
Quantification of Muscle Satellite Stem Cell Divisions by High-Content Analysis
Chen, W. C., Perkins, T. J., & Rudnicki, M. A. (2022) · Methods in molecular biology · doi:10.1007/978-1-0716-2772-3_29 · Cited by 1
Skeletal Muscle Stem Cell Niche from Birth to Old Age
Barbu, M. G., Boboc, A. E., Filip, L., Bugnar, O. L., Crețoiu, D., Suciu, N., Toader, O. D., Creţoiu, S. M., & Voinea, S.-C. (2020) · IntechOpen eBooks · doi:10.5772/intechopen.93502 · Cited by 1
Background and Management of Muscular Atrophy
Cseri, J. (2020) · IntechOpen eBooks · doi:10.5772/intechopen.90959 · Cited by 1
Maintaining the stemness of satellite cells during long-term culture
Ding (2019) · Research Publications (Maastricht University) · doi:10.26481/dis.20190327sd · Cited by 2
Togninalli, M., Ho, A. T. V., Madl, C. M., Holbrook, C. A., Wang, Y. X., Magnusson, K. E. G., Kirillova, A., Chang, A. C. H., & Blau, H. M. (2022) · bioRxiv (Cold Spring Harbor Laboratory) · doi:10.1101/2022.06.17.495556 · Cited by 1
Jacques, E., Garcia, P., Mercier, O., Hu, Y., Dégletagne, C., Ravent, J., Fall, S., Almeida, M. P., Wheeler, A. R., Angers, S., et al. (2024) · bioRxiv (Cold Spring Harbor Laboratory) · doi:10.1101/2024.07.22.604619 · Cited by 1
Muraine, L., Bensalah, M., Gargan, S., Dowling, P., Bigot, A., Allamand, V., Dhiab, J., Kondili, M., Périé, S., Guily, J. L. S., et al. (2025) · bioRxiv (Cold Spring Harbor Laboratory) · doi:10.1101/2025.10.17.683021 · Cited by 1
Estudi de funcionalitats tàctils amb Kinect en superfícies no instrumentades
Inglés, M. A. (2013)
Phillips, S. M. (2020) · Faculty Opinions – Post-Publication Peer Review of the Biomedical Literature · doi:10.3410/f.735320205.793571145
Long, A. M., Kwon, J. M., Lee, G., Reiser, N. L., Vaught, L. A., O’Brien, J. G., Page, P., Hadhazy, M., Reynolds, J. C., Crosbie, R. H., et al. (2022) · bioRxiv (Cold Spring Harbor Laboratory) · doi:10.1101/2022.10.31.514525
Influencia do adrenoceptor β2 na funcao das celulas satelite.
Koike, T. E. (2021) · Digital Library of Theses and Dissertations (Universidade de São Paulo) · doi:10.11606/t.42.2021.tde-15122022-112219
Duran, P., Yang, B. A., Plaster, E. M., Eiken, M. K., Loebel, C., & Aguilar, C. A. (2024) · bioRxiv (Cold Spring Harbor Laboratory) · doi:10.1101/2024.01.20.576326
Khan, H. A., Hateren, N. J. V., & Borycki, A. (2024) · Methods in molecular biology · doi:10.1007/7651_2024_552
Self-citationGuillon, E., Bacar, H., Sasaki, T., Mourikis, P., & Ruggiero, F. (2024) · bioRxiv (Cold Spring Harbor Laboratory) · doi:10.1101/2024.07.10.602878
Characterization of cytotrophoblast cell population dynamics throughout pregnancyPreprint
Schäffers, O. J. M., Verburgt, S., Harhangi, M. S., Broekhuizen, M., van Hengel, E. V. A., van der Meeren, L. E., Schoenmakers, S., Dekkers, D. H. W., Doff, W. A. S., Demmers, J., et al. (2025) · bioRxiv (Cold Spring Harbor Laboratory) · doi:10.1101/2025.01.22.634235
Yamaguchi, R., Ikeda, M., Takeuchi, S., Nakamura, K., Kurmangaliyeva, A., Teramoto, N., Sugihara, H., Kikawa, C., Matsuwaki, T., Nishihara, M., et al. (2025) · Animal Science Journal · doi:10.1111/asj.70097
Gu, L., Kim, K. H., Chen, X., Oprescu, S. N., Li, Y., Ren, J., Kuang, S., & Yue, F. (2026) · iScience · doi:10.1016/j.isci.2026.115703
Maghin, E., Benetollo, A., Scano, M., Caccin, P., Carraro, E., Piccoli, M., & Sandonà, D. (2025) · Skeletal Muscle · doi:10.1186/s13395-025-00408-z
Claus, C., Slavin, M., Ansseau, E., Lancelot, C., Bah, K., Lassche, S., Fiévet, M., Greco, A., Tomaiuolo, S., Tassin, A., et al. (2023) · Figshare · doi:10.6084/m9.figshare.22622005
Claus, C., Slavin, M., Ansseau, E., Lancelot, C., Bah, K., Lassche, S., Fiévet, M., Greco, A., Tomaiuolo, S., Tassin, A., et al. (2023) · Figshare · doi:10.6084/m9.figshare.22621975
Claus, C., Slavin, M., Ansseau, E., Lancelot, C., Bah, K., Lassche, S., Fiévet, M., Greco, A., Tomaiuolo, S., Tassin, A., et al. (2023) · Figshare · doi:10.6084/m9.figshare.22621990
Claus, C., Slavin, M., Ansseau, E., Lancelot, C., Bah, K., Lassche, S., Fiévet, M., Greco, A., Tomaiuolo, S., Tassin, A., et al. (2023) · Figshare · doi:10.6084/m9.figshare.22622026
Claus, C., Slavin, M., Ansseau, E., Lancelot, C., Bah, K., Lassche, S., Fiévet, M., Greco, A., Tomaiuolo, S., Tassin, A., et al. (2023) · Figshare · doi:10.6084/m9.figshare.22621996
Claus, C., Slavin, M., Ansseau, E., Lancelot, C., Bah, K., Lassche, S., Fiévet, M., Greco, A., Tomaiuolo, S., Tassin, A., et al. (2023) · Figshare · doi:10.6084/m9.figshare.22622029
Claus, C., Slavin, M., Ansseau, E., Lancelot, C., Bah, K., Lassche, S., Fiévet, M., Greco, A., Tomaiuolo, S., Tassin, A., et al. (2023) · Figshare · doi:10.6084/m9.figshare.22622023
Claus, C., Slavin, M., Ansseau, E., Lancelot, C., Bah, K., Lassche, S., Fiévet, M., Greco, A., Tomaiuolo, S., Tassin, A., et al. (2023) · Figshare · doi:10.6084/m9.figshare.22621987
Claus, C., Slavin, M., Ansseau, E., Lancelot, C., Bah, K., Lassche, S., Fiévet, M., Greco, A., Tomaiuolo, S., Tassin, A., et al. (2023) · Figshare · doi:10.6084/m9.figshare.22622032
Claus, C., Slavin, M., Ansseau, E., Lancelot, C., Bah, K., Lassche, S., Fiévet, M., Greco, A., Tomaiuolo, S., Tassin, A., et al. (2023) · Figshare · doi:10.6084/m9.figshare.22622011
Claus, C., Slavin, M., Ansseau, E., Lancelot, C., Bah, K., Lassche, S., Fiévet, M., Greco, A., Tomaiuolo, S., Tassin, A., et al. (2023) · Figshare · doi:10.6084/m9.figshare.22621993
Claus, C., Slavin, M., Ansseau, E., Lancelot, C., Bah, K., Lassche, S., Fiévet, M., Greco, A., Tomaiuolo, S., Tassin, A., et al. (2023) · Figshare · doi:10.6084/m9.figshare.22622002
Claus, C., Slavin, M., Ansseau, E., Lancelot, C., Bah, K., Lassche, S., Fiévet, M., Greco, A., Tomaiuolo, S., Tassin, A., et al. (2023) · Figshare · doi:10.6084/m9.figshare.22622008
Claus, C., Slavin, M., Ansseau, E., Lancelot, C., Bah, K., Lassche, S., Fiévet, M., Greco, A., Tomaiuolo, S., Tassin, A., et al. (2023) · Figshare · doi:10.6084/m9.figshare.22621978
Horita, S. I. M., Bensalah, M., Bigot, A., Mamchaoui, K., Butler-Browne, G. S., Beghini, D. G., Savino, W., Trollet, C., Mouly, V., Négroni, E., et al. (2025) · ACS Omega · doi:10.1021/acsomega.5c06289
Fibrose musculaire : acteurs cellulaires et stratégies thérapeutiques
Bensalah, M. (2019) · theses.fr (ABES) · doi:10.70675/26f11f97zd40az491cz93fcz9608314a2b03
Étude du rôle de RhoA dans la plasticité du muscle squelettique
Noviello, C. (2020) · theses.fr (ABES) · doi:10.70675/c46c1ebdzfce4z41acza3c0z0443139c7e5a
Metadata
- Authors
- Rayagiri, S. S., Ranaldi, D., Raven, A., Mohamad Azhar, N. I. F., Lefebvre, O., Zammit, P. S., & Borycki, A.-G.
- Affiliations
- University of Sheffield (GB)
- MRC Centre for Regenerative Medicine (GB)
- King's College London (GB)
- Corresponding author
- Borycki, Anne-Gaëlle
- Venue
- Nature Communications
- Published
- 2018-03-14
- Volume
- 9
- Issue
- 1
- Pages
- 1075-1075
- ISSN
- 2041-1723 (ISSN-L)
- PMC
- PMC5852002
- OpenAlex
- W2791349152
- Cited by
- 218
- References
- 62
- Citations by year
- 2026: 16 · 2025: 26 · 2024: 25 · 2023: 35 · 2022: 25 · 2021: 31 · 2020: 33 · 2019: 20 · 2018: 6
- FWCI
- 8.00
- Type
- journal article
- Language
- en
- Open access
- gold
- doi.org
- Locations
- Nature Communications (publishedVersion, cc-by)
- PubMed Central (publishedVersion, cc-by)
- PubMed (publishedVersion)
- White Rose Research Online (University of Leeds, The University of Sheffield, University of York) (acceptedVersion)
- RePEc: Research Papers in Economics (submittedVersion)
- DOAJ (DOAJ: Directory of Open Access Journals) (submittedVersion)
- DOAJ (DOAJ: Directory of Open Access Journals) (submittedVersion, cc-by-sa)
- Research Portal (King's College London) (submittedVersion, cc-by)
- Funders
- FSH Society
- Agence Nationale de la Recherche (ANR-10-LABX-0034)
- Majlis Amanah Rakyat
- Directorate for Biological Sciences
- Medical Research Council
- Biotechnology and Biological Sciences Research Council
- Topics
- Life Sciences › Biochemistry, Genetics and Molecular Biology › Molecular Biology › Muscle Physiology and Disorders
- Health Sciences › Medicine › Surgery › Tissue Engineering and Regenerative Medicine
- Health Sciences › Medicine › Immunology and Allergy › Cell Adhesion Molecules Research
- Keywords
- skeletal muscle stem cells, satellite cells, extracellular matrix, stem cell niche, stem cell self-renewal, laminin alpha1, laminin alpha5, matrix metalloproteinases, muscle regeneration
- MeSH terms
- Cell Self Renewal, Animals, Basement Membrane, Cell Differentiation, Extracellular Matrix, Humans, Mice, Inbred C57BL, Signal Transduction, Muscle, Skeletal, Muscle Fibers, Skeletal, Satellite Cells, Skeletal Muscle, Stem Cell Niche
About these checks
Registry, retraction, Cites and statistics results are computed, not judged, with one exception: a printed reference that no index lists is read once by a model before it counts as a citation error. Claims are extracted by a model and kept only when their quote appears verbatim in the text; each cited source is then checked, with a model’s help, for whether it says what the claim relies on. Those verdicts can be wrong — read the claim’s quote and the cited source before relying on one.
Statistics and arithmetic are recomputed, not judged.
Confidence bands are shown only for fields calibrated on our annotated test set. None is calibrated yet, so no band is shown.
What counts as a claim ›How we measure confidence ›How we check this ›
Are you an author, or do you see a problem with this page? Request a review
