

The DOI matches its Crossref record; 74 of the 75 references it cites were found in a registry or an index.
Longer and more frequent marine heatwaves over the past century.
Open accessAbstract
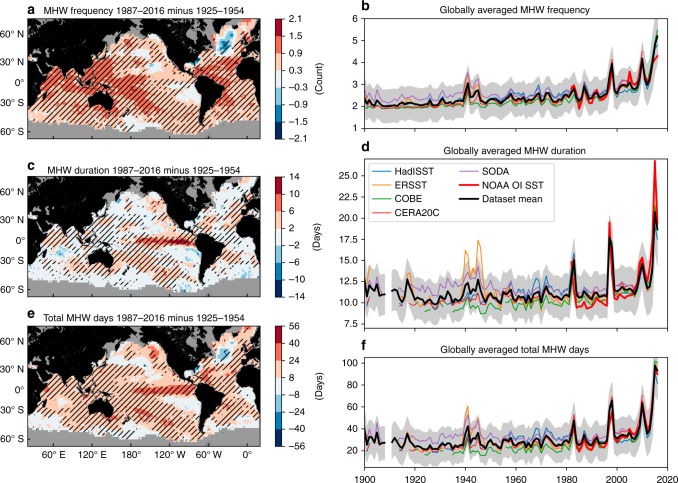
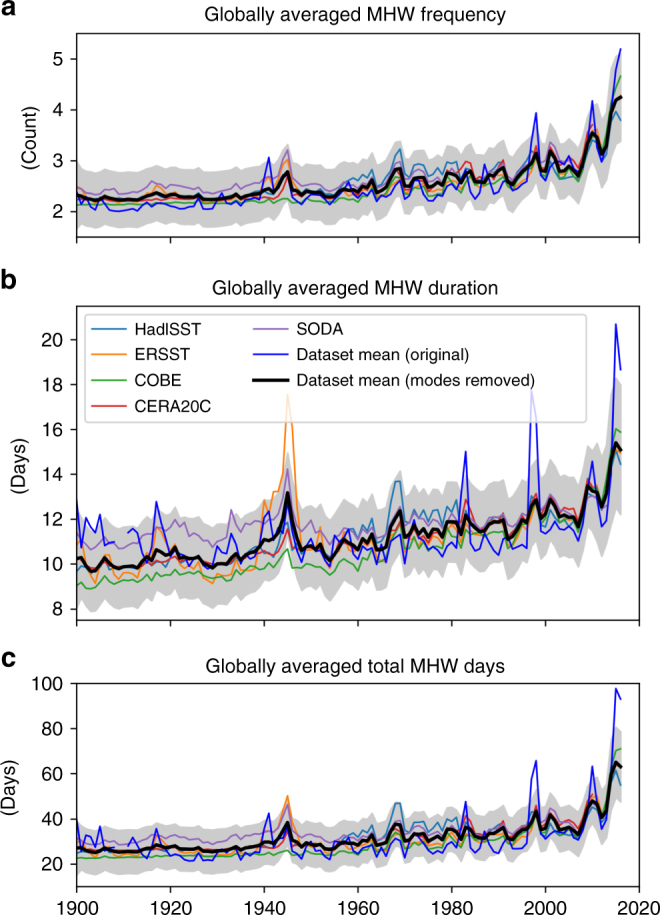
Heatwaves are important climatic extremes in atmospheric and oceanic systems that can have devastating and long-term impacts on ecosystems, with subsequent socioeconomic consequences. Recent prominent marine heatwaves have attracted considerable scientific and public interest. Despite this, a comprehensive assessment of how these ocean temperature extremes have been changing globally is missing. Using a range of ocean temperature data including global records of daily satellite observations, daily in situ measurements and gridded monthly in situ-based data sets, we identify significant increases in marine heatwaves over the past century. We find that from 1925 to 2016, global average marine heatwave frequency and duration increased by 34% and 17%, respectively, resulting in a 54% increase in annual marine heatwave days globally. Importantly, these trends can largely be explained by increases in mean ocean temperatures, suggesting that we can expect further increases in marine heatwave days under continued global warming.
Overview
The claims and statistics of this paper haven’t been checked yet.
Run the check — free, no account needed. It reads the open-access text and checks the sources it cites.
Integrity signals
Registry
Cites
Statistics
Figures
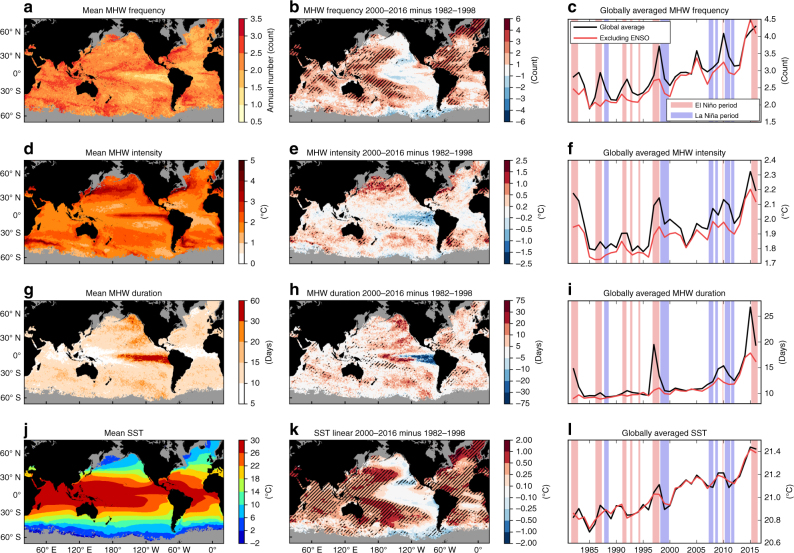
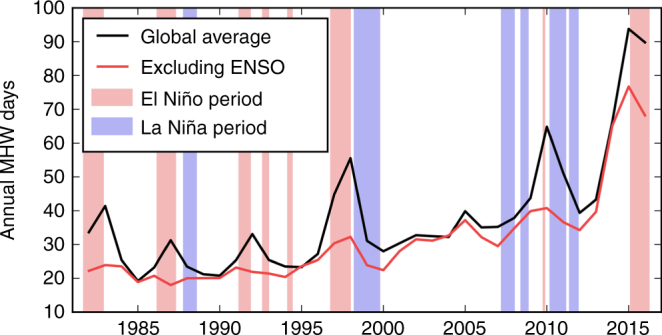
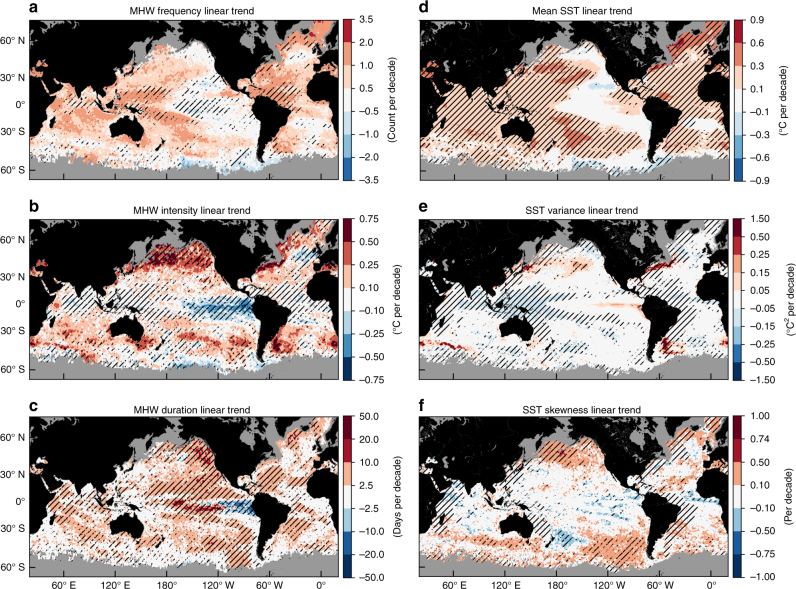
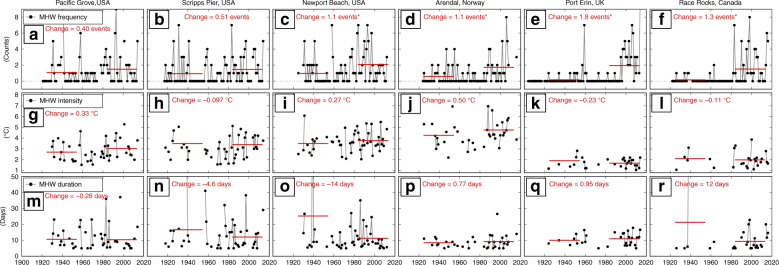
Verification
Claims the paper makes
The claims and statistics of this paper haven’t been checked yet.
Run the check — free, no account needed. It reads the open-access text and checks the sources it cites.
Claims other papers make about this one
Each is checked against this paper’s own text: does it say what the citing paper says it does?
The source backs part of the claim, not all of it — or backs it for a different population, condition or comparison.
In the citing paper
“The frequency of marine heatwaves has increased significantly in the tropical North Atlantic during the past 35 years and is expected to increase further in response to global warming (Oliver et al., 2018).”
From The tropical atlantic observing system (2019) · cites this paper as Oliver et al., 2018
Experimental — accuracy not yet measured
Self-check
Percentages, sums and reported differences re-computed from the paper’s own numbers.
The self-check needs the paper’s full text.
Citations
Cites
Climate Change 2007: The Physical Science Basis.
Schiavon, S., & Zecchin, R. (2007) · eScholarship (California Digital Library) · Cited by 16,994
Estimates of the Regression Coefficient Based on Kendall's Tau
Sen, P. K. (1968) · Journal of the American Statistical Association · doi:10.1080/01621459.1968.10480934 · Cited by 15,277
Rayner, N. A., Parker, D. E., Horton, E. B., Folland, C. K., Alexander, L. V., Rowell, D. P., Kent, E. C., & Kaplan, A. (2003) · Journal of Geophysical Research Atmospheres · doi:10.1029/2002jd002670 · Cited by 11,133
Self-citationNelder, J. A., & Wedderburn, R. W. M. (1972) · Journal of the Royal Statistical Society Series A (General) · doi:10.2307/2344614 · Cited by 7,703
A Pacific Interdecadal Climate Oscillation with Impacts on Salmon Production
Mantua, N. J., Hare, S. R., Zhang, Y., Wallace, J. M., & Francis, R. C. (1997) · Bulletin of the American Meteorological Society · doi:10.1175/1520-0477(1997)078 · Cited by 7,180
Spectral Analysis and Time Series
Preston, D. B., & Priestley, M. B. (1983) · Technometrics · doi:10.1080/00401706.1983.10487866 · Cited by 5,050
Daily High-Resolution-Blended Analyses for Sea Surface Temperature
Reynolds, R. W., Smith, T. M., Liu, C., Chelton, D. B., Casey, K. S., & Schlax, M. G. (2007) · Journal of Climate · doi:10.1175/2007jcli1824.1 · Cited by 4,435
More Intense, More Frequent, and Longer Lasting Heat Waves in the 21st Century
Meehl, G. A., & Tebaldi, C. (2004) · Science · doi:10.1126/science.1098704 · Cited by 4,322
Biodiversity redistribution under climate change: Impacts on ecosystems and human well-being
Pecl, G. T., Araújo, M. B., Bell, J. D., Blanchard, J., Bonebrake, T. C., Chen, I.-C., Clark, T. D., Colwell, R. K., Danielsen, F., Evengård, B., et al. (2017) · Science · doi:10.1126/science.aai9214 · Cited by 3,668
Self-citationGlobal warming and recurrent mass bleaching of corals
Hughes, T. P., Kerry, J. T., Álvarez‐Noriega, M., Álvarez-Romero, J. G., Anderson, K. D., Baird, A. H., Babcock, R. C., Beger, M., Bellwood, D. R., Berkelmans, R., et al. (2017) · Nature · doi:10.1038/nature21707 · Cited by 3,430
Research works printed but not linked: 5
- Olita, A., Sorgente, R., Ribotti, A., Natale, S. & Gaberšek, S. Effects of the 2003 European heatwave on the Central Mediterranean Sea surface layer: a numerical simulation. Ocean Sci. Discuss. 3, 85–125 (2006). · DOI
- Mills, K. E. et al. Lessons from the 2012 Ocean Heat Wave in the NorthwestAtlantic. Oceanography 26, 60–64 (2012).
- Bindoff, N. L. et al. Climate Change 2013: The Physical Science Basis. Contribution of Working Group 1 to the Fifth Asessment Report of the Intergovernmental Panel on Climate Change. Climate Change 2013: The Physical Science Basis. Contribution of Working Group 1 to the Fifth Asessment Report of the Intergovernmental Panel on Climate Change (Cambridge University Press, Cambridge, UK and New York, USA, 2013).
- Oliver, E. C. J., Perkins-Kirkpatrick, S. E., Holbrook, N. J. & Bindoff, N. L. Anthropogenic influences on record 2016 marine heatwaves. Bull. Am. Meteorol. Soc. 98, S44–S48 (2017).
- de Coëtlogon, G. & Frankignoul, C. The persistence of winter sea surface temperature in the North Atlantic. J. Clim. 16, 1364–1377 (2003). · DOI
Cited by
Sorted by citations
Items 101–200 of 1,000
Roberts, S. D., van Ruth, P. D., Wilkinson, C., Bastianello, S. S., & Bansemer, M. S. (2019) · Frontiers in Marine Science · doi:10.3389/fmars.2019.00610 · Cited by 127
Sanderson, C. E., & Alexander, K. A. (2020) · Global Change Biology · doi:10.1111/gcb.15163 · Cited by 130
Marin, M., Feng, M., Phillips, H. E., & Bindoff, N. L. (2021) · Journal of Geophysical Research Oceans · doi:10.1029/2020jc016708 · Cited by 124
Self-citationProjecting marine species range shifts from only temperature can mask climate vulnerability
McHenry, J., Welch, H., Lester, S. E., & Saba, V. S. (2019) · Global Change Biology · doi:10.1111/gcb.14828 · Cited by 121
Marine Heatwave of Sea Surface Temperature of the Oyashio Region in Summer in 2010–2016
Miyama, T., Minobe, S., & Goto, H. (2021) · Frontiers in Marine Science · doi:10.3389/fmars.2020.576240 · Cited by 118
Wu, Y., Miao, C., Sun, Y., AghaKouchak, A., Shen, C., & Fan, X. (2021) · GeoHealth · doi:10.1029/2021gh000390 · Cited by 121
An increase in marine heatwaves without significant changes in surface ocean temperature variability
Xu, T., Newman, M., Capotondi, A. M., Stevenson, S. L., Lorenzo, E. D., & Alexander, M. A. (2022) · Nature Communications · doi:10.1038/s41467-022-34934-x · Cited by 135
Seagrasses in an era of ocean warming: a review
Nguyen, H. M., Ralph, P. J., Marín‐Guirao, L., Pernice, M., & Procaccini, G. (2021) · Biological reviews/Biological reviews of the Cambridge Philosophical Society · doi:10.1111/brv.12736 · Cited by 120
Natural variability has dominated Atlantic Meridional Overturning Circulation since 1900
Latif, M., Sun, J., Visbeck, M. H., & Bordbar, M. H. (2022) · Nature Climate Change · doi:10.1038/s41558-022-01342-4 · Cited by 129
Vertical structures of marine heatwaves
Zhang, Y., Du, Y., Feng, M., & Hobday, A. J. (2023) · Nature Communications · doi:10.1038/s41467-023-42219-0 · Cited by 142
Self-citationIncrease in ocean acidity variability and extremes under increasing atmospheric CO 2
Burger, F. A., John, J. G., & Frölicher, T. L. (2020) · Biogeosciences · doi:10.5194/bg-17-4633-2020 · Cited by 127
Verdura, J., Linares, C., Ballesteros, E., Coma, R., Uriz, M. J., Bensoussan, N., & Cebrián, E. (2019) · Scientific Reports · doi:10.1038/s41598-019-41929-0 · Cited by 117
Observed strong subsurface marine heatwaves in the tropical western Pacific Ocean
Hu, S., Li, S., Zhang, Y., Guan, C., Du, Y., Feng, M., Ando, K., Wang, F., Schiller, A. U., & Hu, D. (2021) · Environmental Research Letters · doi:10.1088/1748-9326/ac26f2 · Cited by 124
Self-citationCamp, E. F., Edmondson, J., Doheny, A., Rumney, J., Grima, A., HUETE, A. R., & Suggett, D. (2019) · Marine Ecology Progress Series · doi:10.3354/meps13073 · Cited by 117
A Road Map to IndOOS-2: Better Observations of the Rapidly Warming Indian Ocean
Beal, L. M., Vialard, J., Roxy, M. K., Li, J., Andres, M., Annamalai, H., Feng, M., Han, W., Hood, R. R., Lee, T., et al. (2020) · Bulletin of the American Meteorological Society · doi:10.1175/bams-d-19-0209.1 · Cited by 110
Self-citationSchoepf, V., Carrion, S. A., Gillmann, S. M., Naugle, M. S., Dugal, L., Bruyn, J., & McCulloch, M. T. (2019) · Nature Communications · doi:10.1038/s41467-019-12065-0 · Cited by 108
Habitat loss and range shifts contribute to ecological generalization among reef fishes
Stuart‐Smith, R. D., Mellin, C., Bates, A. E., & Edgar, G. J. (2021) · Nature Ecology & Evolution · doi:10.1038/s41559-020-01342-7 · Cited by 108
2018 Continues Record Global Ocean Warming
Cheng, L., Zhu, J., Abraham, J., Trenberth, K. E., Fasullo, J., Zhang, B., Yu, F., Wan, L., Chen, X., & Song, X. (2019) · Advances in Atmospheric Sciences · doi:10.1007/s00376-019-8276-x · Cited by 114
Predicting cetacean abundance and distribution in a changing climate
Becker, E. A., Forney, K. A., Redfern, J. V., Barlow, J. P., Jacox, M. G., Roberts, J. J., & Palacios, D. M. (2018) · Diversity and Distributions · doi:10.1111/ddi.12867 · Cited by 113
A monitoring and prediction system for compound dry and hot events
Hao, Z., Hao, F., Xia, Y., Singh, V. P., & Zhang, X. (2019) · Environmental Research Letters · doi:10.1088/1748-9326/ab4df5 · Cited by 109
Ocean acidification promotes broad transcriptomic responses in marine metazoans: a literature survey
Strader, M. E., Wong, J. M., & Hofmann, G. E. (2020) · Frontiers in Zoology · doi:10.1186/s12983-020-0350-9 · Cited by 109
Gao, G., Beardall, J., Jin, P., Gao, L., Xie, S., & Gao, K. (2022) · Journal of Applied Ecology · doi:10.1111/1365-2664.14173 · Cited by 112
Rising Trends in Heatwave Metrics Across Southern California
Hulley, G., Dousset, B., & Kahn, B. H. (2020) · Earth s Future · doi:10.1029/2020ef001480 · Cited by 105
Marine heat waves: Characterizing a major climate impact in the Mediterranean
Pastor, F., & Khodayar, S. (2022) · The Science of The Total Environment · doi:10.1016/j.scitotenv.2022.160621 · Cited by 110
Hidden heatwaves and severe coral bleaching linked to mesoscale eddies and thermocline dynamics
Wyatt, A. S. J., Leichter, J. J., Washburn, L., Kui, L., Edmunds, P. J., & Burgess, S. C. (2023) · Nature Communications · doi:10.1038/s41467-022-35550-5 · Cited by 104
Siegert, M. J., Bentley, M. J., Atkinson, A., Bracegirdle, T. J., Convey, P., Davies, B. J., Downie, R., Hogg, A. E., Holmes, C., Hughes, K. A., et al. (2023) · Frontiers in Environmental Science · doi:10.3389/fenvs.2023.1229283 · Cited by 104
Plecha, S. M., & Soares, P. M. M. (2020) · Environmental Research Letters · doi:10.1088/1748-9326/abc847 · Cited by 111
Nguyen, H. M., Kim, M., Ralph, P. J., Marín‐Guirao, L., Pernice, M., & Procaccini, G. (2020) · Frontiers in Plant Science · doi:10.3389/fpls.2020.00494 · Cited by 102
Marine Heatwave Drives Collapse of Kelp Forests in Western Australia
Wernberg, T. (2021) · Ecological studies · doi:10.1007/978-3-030-71330-0_12 · Cited by 105
Self-citationMarine heatwaves disrupt ecosystem structure and function via altered food webs and energy flux
Gomes, D. G. E., Ruzicka, J. J., Crozier, L. G., Huff, D. D., Brodeur, R. D., & Stewart, J. D. (2024) · Nature Communications · doi:10.1038/s41467-024-46263-2 · Cited by 110
Metabolic fitness landscapes predict the evolution of antibiotic resistance
Pinheiro, F., Warsi, O., Andersson, D. I., & Lässig, M. (2021) · Nature Ecology & Evolution · doi:10.1038/s41559-021-01397-0 · Cited by 101
The New Max Planck Institute Grand Ensemble With CMIP6 Forcing and High‐Frequency Model Output
Olonscheck, D., Suarez‐Gutierrez, L., Milinski, S., Beobide‐Arsuaga, G., Baehr, J., Fröb, F., Ilyina, T., Kadow, C., Krieger, D., Li, H., et al. (2023) · Journal of Advances in Modeling Earth Systems · doi:10.1029/2023ms003790 · Cited by 105
Marine heatwaves in a changing climate
Jacox, M. G. (2019) · Nature · doi:10.1038/d41586-019-02196-1 · Cited by 106
Detecting Marine Heatwaves With Sub-Optimal Data
Schlegel, R. W., Oliver, E. C. J., Hobday, A. J., & Smit, A. J. (2019) · Frontiers in Marine Science · doi:10.3389/fmars.2019.00737 · Cited by 100
Self-citationSpecies-specific molecular responses of wild coral reef fishes during a marine heatwave
Bernal, M. A., Schunter, C., Lehmann, R., Lightfoot, D. J., Allan, B. J. M., Veilleux, H. D., Rummer, J. L., Munday, P. L., & Ravasi, T. (2020) · Science Advances · doi:10.1126/sciadv.aay3423 · Cited by 96
Local‐scale climatic refugia offer sanctuary for a habitat‐forming species during a marine heatwave
Verdura, J., Santamaría, J., Ballesteros, E., Smale, D. A., Cefalì, M. E., Golo, R., de Caralt, S., Vergés, A., & Cebrián, E. (2021) · Journal of Ecology · doi:10.1111/1365-2745.13599 · Cited by 101
Self-citationOnset and Decline Rates of Marine Heatwaves: Global Trends, Seasonal Forecasts and Marine Management
Spillman, C. M., Smith, G., Hobday, A. J., & Hartog, J. R. (2021) · Frontiers in Climate · doi:10.3389/fclim.2021.801217 · Cited by 96
Self-citationThreat by marine heatwaves to adaptive large marine ecosystems in an eddy-resolving model
Guo, X., Gao, Y., Zhang, S., Wu, L., Chang, P., Cai, W., Jakob Zscheischler, A., Leung, L.-Y. R., Small, J., Danabasoglu, G., et al. (2022) · Nature Climate Change · doi:10.1038/s41558-021-01266-5 · Cited by 104
Extremes, Abrupt Changes and Managing Risks
(IPCC), I. P. O. C. C. (2022) · Cambridge University Press eBooks · doi:10.1017/9781009157964.008 · Cited by 115
Oceanic mesoscale eddies as crucial drivers of global marine heatwaves
Bian, C., Jing, Z., Wang, H., Wu, L., Chen, Z., Gan, B., & Yang, H. (2023) · Nature Communications · doi:10.1038/s41467-023-38811-z · Cited by 125
Local Drivers of Marine Heatwaves: A Global Analysis With an Earth System Model
Vogt, L., Burger, F. A., Griffies, S. M., & Frölicher, T. L. (2022) · Frontiers in Climate · doi:10.3389/fclim.2022.847995 · Cited by 101
Orgeret, F., Thiebault, A., Kovacs, K. M., Lydersen, C., Hindell, M. A., Thompson, S. A., Sydeman, W. J., & Pistorius, P. A. (2021) · Ecology Letters · doi:10.1111/ele.13920 · Cited by 92
Cumulative risk of future bleaching for the world’s coral reefs
Mellin, C., Brown, S. C., Cantin, N. E., Klein-Salas, E., Mouillot, D., Heron, S. F., & Fordham, D. A. (2024) · Science Advances · doi:10.1126/sciadv.adn9660 · Cited by 97
Genetic tropicalisation following a marine heatwave
Coleman, M. A., Minne, A. J. P., Vranken, S., & Wernberg, T. (2020) · Scientific Reports · doi:10.1038/s41598-020-69665-w · Cited by 101
Self-citationSun, Q., Wang, S., Ma, Y., Zhou, Y., Song, D., Zhang, H., Shi, X., Li, C., & Zhang, L. (2021) · Energy storage materials · doi:10.1016/j.ensm.2021.10.042 · Cited by 91
Starko, S., Neufeld, C. J., Gendall, L., Timmer, B., Campbell, L., Yakimishyn, J., Druehl, L. D., & Baum, J. K. (2022) · Ecological Applications · doi:10.1002/eap.2673 · Cited by 91
Dayan, H., McAdam, R., Juza, M., Masina, S., & Speich, S. (2023) · Frontiers in Marine Science · doi:10.3389/fmars.2023.1045138 · Cited by 95
Severe and widespread coral reef damage during the 2014-2017 Global Coral Bleaching Event
Eakin, C. M., Heron, S. F., Connolly, S. R., Devotta, D. A., Liu, G., Geiger, E. F., Cour, J. L. D. L., Gomez, A. M., Skirving, W., Baird, A. H., et al. (2026) · Nature Communications · doi:10.1038/s41467-025-67506-w · Cited by 101
Marine heatwaves as hot spots of climate change and impacts on biodiversity and ecosystem services
Wernberg, T., Thomsen, M. S., Burrows, M. T., Filbee‐Dexter, K., Hobday, A. J., Holbrook, N. J., Montie, S., Moore, P. J., Oliver, E. C. J., Gupta, A. S., et al. (2025) · Nature Reviews Biodiversity · doi:10.1038/s44358-025-00058-5 · Cited by 108
Self-citationGao, G., Zhao, X., Jiang, M., & Gao, L. (2021) · Frontiers in Marine Science · doi:10.3389/fmars.2021.758651 · Cited by 95
Free, C. M., Anderson, S. C., Hellmers, E. A., Muhling, B. A., Navarro, M. O., Richerson, K., Rogers, L. A., Satterthwaite, W. H., Thompson, A. R., Burt, J. M., et al. (2023) · Fish and Fisheries · doi:10.1111/faf.12753 · Cited by 98
Global chlorophyll responses to marine heatwaves in satellite ocean color
Noh, K. M., Lim, H., & Kug, J. (2022) · Environmental Research Letters · doi:10.1088/1748-9326/ac70ec · Cited by 100
The 2017 Record Marine Heatwave in the Southwestern Atlantic Shelf
Manta, G., de Mello, S., Trinchin, R., Badagian, J., & Barreiro, M. (2018) · Geophysical Research Letters · doi:10.1029/2018gl081070 · Cited by 89
Climate change impacts on China’s marine ecosystems
Kang, B., Pecl, G. T., Lin, L., Sun, P., Zhang, P., Li, Y., Zhao, L., Peng, X., Yan, Y., Shen, C., et al. (2021) · Reviews in Fish Biology and Fisheries · doi:10.1007/s11160-021-09668-6 · Cited by 88
Indirect legacy effects of an extreme climatic event on a marine megafaunal community
Nowicki, R. J., Heithaus, M. R., Thomson, J. A., Burkholder, D. A., Gastrich, K., & Wirsing, A. J. (2019) · Ecological Monographs · doi:10.1002/ecm.1365 · Cited by 86
Antón, A., Randle, J. L., García, F. C., Rossbach, S., Ellis, J. I., Weinzierl, M. S., & Duarte, C. M. (2020) · Global Change Biology · doi:10.1111/gcb.15141 · Cited by 87
Global Marine Heatwaves and Cold‐Spells in Present Climate to Future Projections
Yao, Y., Wang, C., & Fu, Y. (2022) · Earth s Future · doi:10.1029/2022ef002787 · Cited by 87
Baseline matters: Challenges and implications of different marine heatwave baselines
Smith, K. E., Gupta, A. S., Amaya, D. J., Benthuysen, J. A., Burrows, M. T., Capotondi, A. M., Filbee‐Dexter, K., Frölicher, T. L., Hobday, A. J., Holbrook, N. J., et al. (2024) · Progress In Oceanography · doi:10.1016/j.pocean.2024.103404 · Cited by 94
Self-citationBricknell, I. R., Birkel, S. D., Brawley, S. H., Kirk, T. V., Hamlin, H. J., Capistrant‐Fossa, K., Huguenard, K. D., van Walsum, G. P., Liu, Z., Zhu, L., et al. (2020) · Reviews in Aquaculture · doi:10.1111/raq.12483 · Cited by 91
Diversity of Marine Heatwaves in the South China Sea Regulated by ENSO Phase
Liu, K., Xu, K., Zhu, C., & Liu, B. (2021) · Journal of Climate · doi:10.1175/jcli-d-21-0309.1 · Cited by 91
Summer marine heatwaves in the South China Sea: Trend, variability and possible causes
Tan, H., Cai, R., & Wu, R. (2022) · Advances in Climate Change Research · doi:10.1016/j.accre.2022.04.003 · Cited by 84
Frequent marine heatwaves hidden below the surface of the global ocean
Sun, D., Li, F., Jing, Z., Hu, S., & Zhang, B. (2023) · Nature Geoscience · doi:10.1038/s41561-023-01325-w · Cited by 98
More extreme marine heatwaves in the China Seas during the global warming hiatus
Li, Y., Ren, G., Wang, Q., & You, Q. (2019) · Environmental Research Letters · doi:10.1088/1748-9326/ab28bc · Cited by 83
Spatial Variability and Trends of Marine Heat Waves in the Eastern Mediterranean Sea over 39 Years
Ibrahim, O., Mohamed, B., & Nagy, H. (2021) · Journal of Marine Science and Engineering · doi:10.3390/jmse9060643 · Cited by 82
Effects of climate‐change‐driven gradual and acute temperature changes on shark and ray species
Osgood, G. J., White, E. R., & Baum, J. K. (2021) · Journal of Animal Ecology · doi:10.1111/1365-2656.13560 · Cited by 91
Predicting responses to marine heatwaves using functional traits
Harvey, B. P., Marshall, K. E., Harley, C. D. G., & Russell, B. D. (2021) · Trends in Ecology & Evolution · doi:10.1016/j.tree.2021.09.003 · Cited by 95
Time-series weather prediction in the Red sea using ensemble transformers
Hittawe, M. M., Harrou, F., Togou, M. A., Sun, Y., & Knio, O. (2024) · Applied Soft Computing · doi:10.1016/j.asoc.2024.111926 · Cited by 83
What are social-ecological systems and social-ecological systems research?
Biggs, R., Clements, H. S., Vos, A. D., Folke, C., Manyani, A., Maciejewski, K., Martín‐López, B., Preiser, R., Selomane, O., & Schlüter, M. (2021) · Routledge eBooks · doi:10.4324/9781003021339-2 · Cited by 84
Characteristics of an Advective Marine Heatwave in the Middle Atlantic Bight in Early 2017
Gawarkiewicz, G. G., Chen, K., Forsyth, J., Bahr, F. B., Mercer, A. J. M., Ellertson, A., Fratantoni, P., Seim, H. E., Haines, S. M., & Han, L. (2019) · Frontiers in Marine Science · doi:10.3389/fmars.2019.00712 · Cited by 82
Camp, E. F., Suggett, D. J., Pogoreutz, C., Nitschke, M. R., Houlbrèque, F., Hume, B. C. C., Gardner, S. G., Zampighi, M., Rodolfo‐Metalpa, R., & Voolstra, C. R. (2020) · Coral Reefs · doi:10.1007/s00338-019-01889-3 · Cited by 88
Beemelmanns, A., Ribas, L., Anastasiadi, D., Moraleda-Prados, J., Zanuzzo, F. S., Rise, M. L., & Gamperl, A. K. (2021) · Frontiers in Marine Science · doi:10.3389/fmars.2020.604878 · Cited by 86
Impacts of marine heatwaves on top predator distributions are variable but predictable
Welch, H., Savoca, M. S., Brodie, S. J., Jacox, M. G., Muhling, B. A., Clay, T. A., Cimino, M. A., Benson, S. R., Block, B. A., Conners, M. G., et al. (2023) · Nature Communications · doi:10.1038/s41467-023-40849-y · Cited by 89
Behrens, E., Fernández, D., & Sutton, P. J. H. (2019) · Frontiers in Marine Science · doi:10.3389/fmars.2019.00228 · Cited by 79
Sensitivity of Marine Heatwave Metrics to Ocean Model Resolution
Pilo, G. S., Holbrook, N. J., Kiss, A. E., & Hogg, A. M. (2019) · Geophysical Research Letters · doi:10.1029/2019gl084928 · Cited by 83
Self-citationVisch, W., Nylund, G. M., & Pavia, H. (2020) · Journal of Applied Phycology · doi:10.1007/s10811-020-02201-5 · Cited by 81
Weitzman, B. P., Konar, B. H., Iken, K. B., Coletti, H. A., Monson, D. H., Suryan, R. M., Dean, T. A., Hondolero, D., & Lindeberg, M. R. (2021) · Frontiers in Marine Science · doi:10.3389/fmars.2021.556820 · Cited by 86
Extensive Marine Heatwaves at the Sea Surface in the Northwestern Pacific Ocean in Summer 2021
Kuroda, H., & Setou, T. (2021) · Remote Sensing · doi:10.3390/rs13193989 · Cited by 78
Does Warming Enhance the Effects of Eutrophication in the Seagrass Posidonia oceanica?
Pazzaglia, J., Santillán‐Sarmiento, A., Helber, S. B., Ruocco, M., Terlizzi, A., Marín‐Guirao, L., & Procaccini, G. (2020) · Frontiers in Marine Science · doi:10.3389/fmars.2020.564805 · Cited by 77
Zhang, Y., Du, Y., Feng, M., & Hu, S. (2021) · Geophysical Research Letters · doi:10.1029/2021gl095350 · Cited by 78
Self-citationAinsworth, T. D., Hurd, C. L., Gates, R. D., & Boyd, P. W. (2019) · Global Change Biology · doi:10.1111/gcb.14901 · Cited by 81
Compounding impact of severe weather events fuels marine heatwave in the coastal ocean
Dzwonkowski, B., Coogan, J., Fournier, S., Lockridge, G., Park, K., & Lee, T. (2020) · Nature Communications · doi:10.1038/s41467-020-18339-2 · Cited by 80
A partially self-regenerating synthetic cell
Lavickova, B., Laohakunakorn, N., & Maerkl, S. J. (2020) · Nature Communications · doi:10.1038/s41467-020-20180-6 · Cited by 76
Estrada‐Saldívar, N., Quiroga-García, B. A., Pérez‐Cervantes, E., Rivera-Garibay, O., & Álvarez‐Filip, L. (2021) · Frontiers in Marine Science · doi:10.3389/fmars.2021.632777 · Cited by 78
Future changes to the upper ocean Western Boundary Currents across two generations of climate models
Gupta, A. S., Stellema, A., Pontes, G. M., Taschetto, A. S., Vergés, A., & Rossi, V. (2021) · Scientific Reports · doi:10.1038/s41598-021-88934-w · Cited by 76
Evolution of marine heatwaves in warming seas: the Mediterranean Sea case study
Martínez, J., Leonelli, F. E., García-Ladona, E., Garrabou, J., Kersting, D. K., Bensoussan, N., & Pisano, A. (2023) · Frontiers in Marine Science · doi:10.3389/fmars.2023.1193164 · Cited by 81
Marine biodiversity exposed to prolonged and intense subsurface heatwaves
Fragkopoulou, E., Gupta, A. S., Costello, M. J., Wernberg, T., Araújo, M. B., Serrão, E. Á., Clerck, O. D., & Assis, J. F. (2023) · Nature Climate Change · doi:10.1038/s41558-023-01790-6 · Cited by 88
Self-citationEditorial: Advances in Understanding Marine Heatwaves and Their Impacts
Benthuysen, J. A., Oliver, E. C. J., Chen, K., & Wernberg, T. (2020) · Frontiers in Marine Science · doi:10.3389/fmars.2020.00147 · Cited by 78
Self-citationGiraldo‐Ospina, A., Kendrick, G. A., & Hovey, R. K. (2020) · Proceedings of the Royal Society B Biological Sciences · doi:10.1098/rspb.2020.0709 · Cited by 79
Anthropogenic stressors impact fish sensory development and survival via thyroid disruption
Besson, M., Feeney, W. E., Moniz, I., François, L., Brooker, R. M., Holzer, G., Métian, M., Roux, N., Laudet, V., & Lecchini, D. (2020) · Nature Communications · doi:10.1038/s41467-020-17450-8 · Cited by 79
Summer Is Coming! Tackling Ocean Warming in Atlantic Salmon Cage Farming
Calado, R., Mota, V. C., Madeira, D., & Leal, M. C. (2021) · Animals · doi:10.3390/ani11061800 · Cited by 78
Mueter, F. J., Planque, B., Hunt, G. L., Alabia, I. D., Hirawake, T., Eisner, L. B., Dalpadado, P., Chierici, M., Drinkwater, K. F., Harada, N., et al. (2021) · ICES Journal of Marine Science · doi:10.1093/icesjms/fsab122 · Cited by 79
Dalton, S. J., Carroll, A. G., Sampayo, E. M., Roff, G., Harrison, P. L., Entwistle, K., Huang, Z. X., Salih, A., & Diamond, S. L. (2020) · The Science of The Total Environment · doi:10.1016/j.scitotenv.2020.136951 · Cited by 73
Back-to-back coral bleaching events on isolated atolls in the Coral Sea
Harrison, H. B., Álvarez‐Noriega, M., Baird, A. H., Heron, S. F., MacDonald, C., & Hughes, T. P. (2018) · Coral Reefs · doi:10.1007/s00338-018-01749-6 · Cited by 77
Summer and Winter Marine Heatwaves Favor an Invasive Over Native Seaweeds
Atkinson, J., King, N. G., Wilmes, S. B., & Moore, P. J. (2020) · Journal of Phycology · doi:10.1111/jpy.13051 · Cited by 74
Self-citationSeagrass Recovery Following Marine Heat Wave Influences Sediment Carbon Stocks
Aoki, L. R., McGlathery, K. J., Wiberg, P. L., Oreska, M. P. J., Berger, A. C., Berg, P., & Orth, R. J. (2021) · Frontiers in Marine Science · doi:10.3389/fmars.2020.576784 · Cited by 72
Resilience and Social Adaptation to Climate Change Impacts in Small-Scale Fisheries
Villasante, S., Macho, G., Silva, M. R. O., Lopes, P. F. M., Pita, P., Simón, A., Balsa, J. C. M., Olabarría, C., Vázquez, E., & Calvo, N. (2022) · Frontiers in Marine Science · doi:10.3389/fmars.2022.802762 · Cited by 72
Climate change impacts on fisheries
Plagányi, É. E. (2019) · Science · doi:10.1126/science.aaw5824 · Cited by 72
Severe Lake Heatwaves Attributable to Human‐Induced Global Warming
Woolway, R. I., Albergel, C., Frölicher, T. L., & Perroud, M. (2022) · Geophysical Research Letters · doi:10.1029/2021gl097031 · Cited by 74
Copernicus Ocean State Report, issue 6
Aaboe, S., Akpınar, A., Fanjul, E. Á., Aucan, J. P., Aydoğdu, A., Azevedo, D., Lecocq, R. A., Baker, J., Balmaseda, M., Banerjee, D. S., et al. (2022) · Journal of Operational Oceanography · doi:10.1080/1755876x.2022.2095169 · Cited by 71
Intensification of heatwaves in China in recent decades: Roles of climate modes
Wei, J., Han, W., Wang, W., Zhang, L., & Rajagopalan, B. (2023) · npj Climate and Atmospheric Science · doi:10.1038/s41612-023-00428-w · Cited by 71
Metadata
- Authors
- Oliver, E. C. J., Donat, M. G., Burrows, M. T., Moore, P. J., Smale, D. A., Alexander, L. V., Benthuysen, J. A., Feng, M., Sen Gupta, A., Hobday, A. J., Holbrook, N. J., Perkins-Kirkpatrick, S. E., Scannell, H. A., Straub, S. C., & Wernberg, T.
- Affiliations
- University of Tasmania (AU)
- Australian Research Council (AU)
- Scottish Association For Marine Science (GB)
- Aberystwyth University (GB)
- Marine Biological Association of the United Kingdom (GB)
- Australian Institute of Marine Science (AU)
- CSIRO Oceans and Atmosphere (AU)
- University of Washington (US)
- The University of Western Australia (AU)
- Corresponding author
- Oliver, Eric C. J.
- ORCID
- Venue
- Nature Communications
- Published
- 2018-04-10
- Volume
- 9
- Issue
- 1
- Pages
- 1324-1324
- ISSN
- 2041-1723 (ISSN-L)
- PMC
- PMC5893591
- OpenAlex
- W2797541543
- Cited by
- 2,133
- References
- 75
- Citations by year
- 2026: 260 · 2025: 355 · 2024: 383 · 2023: 281 · 2022: 277 · 2021: 262 · 2020: 162 · 2019: 134 · 2018: 16
- FWCI
- 92.21
- Type
- journal article
- Language
- en
- Open access
- gold
- doi.org
- Locations
- Nature Communications (publishedVersion, cc-by)
- Europe PMC (PubMed Central) (publishedVersion, other-oa)
- PubMed Central (publishedVersion, cc-by)
- PubMed (publishedVersion)
- UTAS Research Repository (acceptedVersion)
- Marine Biological Association (acceptedVersion)
- UNSWorks (University of New South Wales, Sydney, Australia) (submittedVersion, cc-by-nc-nd)
- eCite Digital Repository (University of Tasmania) (submittedVersion, cc-by)
- UWA Profiles and Research Repository (UWA) (submittedVersion, cc-by)
- RePEc: Research Papers in Economics (submittedVersion)
- DOAJ (DOAJ: Directory of Open Access Journals) (submittedVersion, cc-by-sa)
- DOAJ (DOAJ: Directory of Open Access Journals) (submittedVersion)
- Figshare (submittedVersion, cc-by)
- NOAA Institutional Repository (submittedVersion, cc-by)
- ANU Open Research (Australian National University) (submittedVersion)
- Newcastle University ePrints (Newcastle Univesity) (cc-by)
- Funders
- Australian Government (CE170100023)
- European Commission (303685)
- Commonwealth Scientific and Industrial Research Organisation
- Climate Extremes (CE170100023)
- Natural Environment Research Council (NE/K008439/, NE/J015148/1, NE/N00678X/1, NE/J022446/1, NE/J021938/1, NE/K008439/1, NE/J024082/1, NE/J015644/1)
- Australian Research Council (DP170100023, FS110200029, FT110100174, DE150100456, DE140100952)
- Topics
- Physical Sciences › Earth and Planetary Sciences › Oceanography › Oceanographic and Atmospheric Processes
- Physical Sciences › Environmental Science › Global and Planetary Change › Climate variability and models
- Life Sciences › Agricultural and Biological Sciences › Aquatic Science › Marine and fisheries research
- Keywords
- marine heatwaves, heatwave frequency, heatwave duration, global warming, ocean warming, climate extremes, ocean heat content
About these checks
Registry, retraction, Cites and statistics results are computed, not judged, with one exception: a printed reference that no index lists is read once by a model before it counts as a citation error. Claims are extracted by a model and kept only when their quote appears verbatim in the text; each cited source is then checked, with a model’s help, for whether it says what the claim relies on. Those verdicts can be wrong — read the claim’s quote and the cited source before relying on one.
Statistics and arithmetic are recomputed, not judged.
Confidence bands are shown only for fields calibrated on our annotated test set. None is calibrated yet, so no band is shown.
What counts as a claim ›How we measure confidence ›How we check this ›
Are you an author, or do you see a problem with this page? Request a review
