

The DOI matches its Crossref record; 28 of the 28 references it cites were found in a registry or an index.
Highly stretchable and transparent ionic conducting elastomers
Open accessAbstract
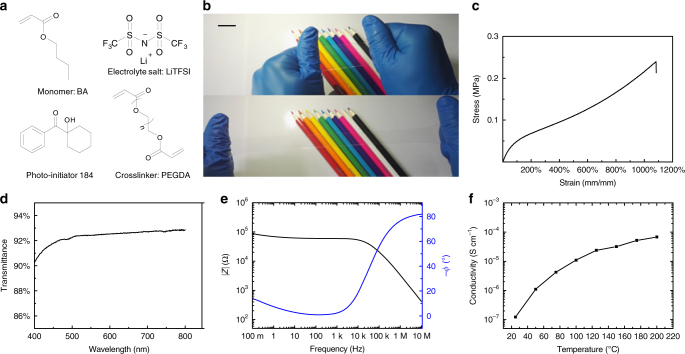
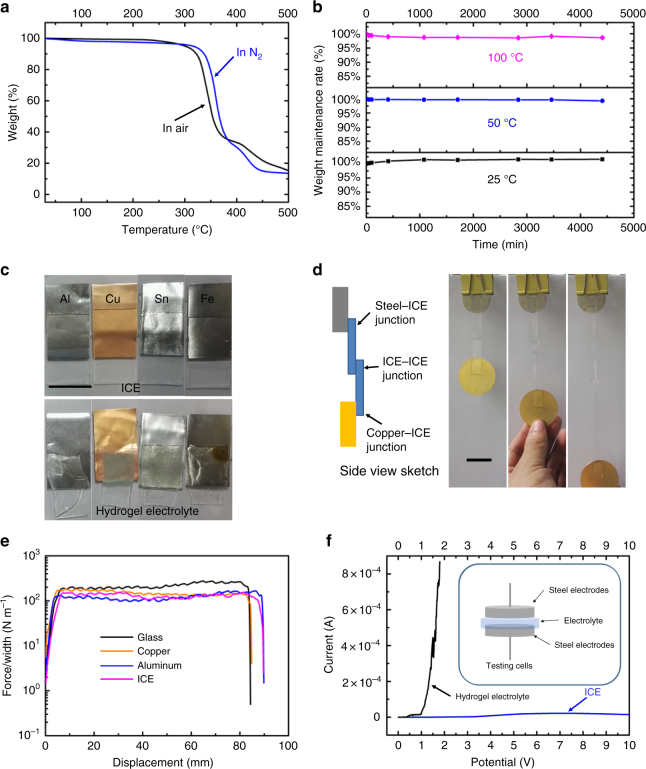
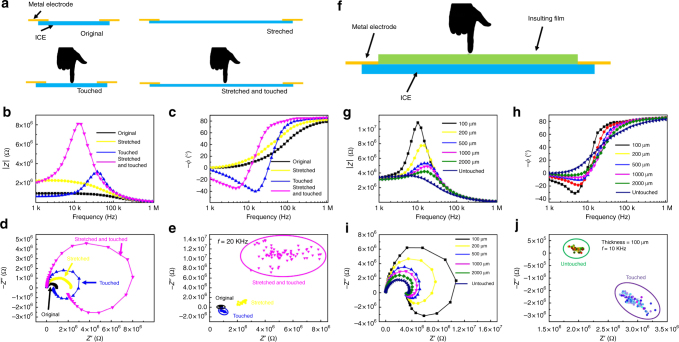
Traditional elastomers are mostly dielectrics; existing conductive elastomers are conductive composites with electric conductors. Herein, we introduce a series of ionic conducting elastomers (ICE) by salt in polymer strategy. The ICEs possess good stretchability, transparency and ionic conductivity. Moreover, the ICEs exhibit very high stability in air, under high temperature and voltage, with excellent adhesion properties and no corrosive effects to metal electrodes. Touch sensors are fabricated using these ICEs—impedance spectra and impedance complex plane are tested and analyzed to clarify different stimulus of the touch sensors. These ICEs provide possibilities for flexible electronics and soft machines.
Overview
The claims and statistics of this paper haven’t been checked yet.
Free: it reads the open-access text and checks the first 5 claims that cite a source we can check. Create a free account to check every claim.
Integrity signals
Registry
Cites
Statistics
Figures
Verification
Claims the paper makes
The claims and statistics of this paper haven’t been checked yet.
Free: it reads the open-access text and checks the first 5 claims that cite a source we can check. Create a free account to check every claim.
Claims other papers make about this one
Each is checked against this paper’s own text: does it say what the citing paper says it does?
The source backs part of the claim, not all of it — or backs it for a different population, condition or comparison.
In the citing paper
“Furthermore, the transparency based on polymers, or nanomesh materials, also contributes to greater aesthetic properties of flexible devices.[77,78]”
From Flexible Electronics and Devices as Human–Machine Interfaces for Medical Robotics (2022) · cites this paper as [78]
Experimental — accuracy not yet measured
Self-check
Percentages, sums and reported differences re-computed from the paper’s own numbers.
The self-check needs the paper’s full text.
Citations
Cites
Large-scale pattern growth of graphene films for stretchable transparent electrodes
Kim, K. S., Zhao, Y., Jang, H., Lee, S. Y., Kim, J. M., Kim, K. S., Ahn, J.-H., Kim, P., Choi, J.-Y., & Hong, B. H. (2009) · Nature · doi:10.1038/nature07719 · Cited by 10,452
Materials and Mechanics for Stretchable Electronics
Rogers, J. A., Someya, T., & Huang, Y. (2010) · Science · doi:10.1126/science.1182383 · Cited by 5,042
“Water-in-salt” electrolyte enables high-voltage aqueous lithium-ion chemistries
Suo, L., Borodin, O., Gao, T., Olguin, M., Ho, J., Fan, X., Luo, C., Wang, C., & Xu, K. (2015) · Science · doi:10.1126/science.aab1595 · Cited by 3,821
Highly sensitive flexible pressure sensors with microstructured rubber dielectric layers
Mannsfeld, S. C. B., Tee, B. C.-K., Stoltenberg, R. M., Chen, C. V. H.-H., Barman, S., Muir, B. V. O., Sokolov, A. N., Reese, C., & Bao, Z. (2010) · Nature Materials · doi:10.1038/nmat2834 · Cited by 3,291
High-Speed Electrically Actuated Elastomers with Strain Greater Than 100%
Pelrine, R., Kornbluh, R., Pei, Q., & Joseph, J. (2000) · Science · doi:10.1126/science.287.5454.836 · Cited by 3,283
Self-healing and thermoreversible rubber from supramolecular assembly
Cordier, P., Tournilhac, F., Soulié-Ziakovic, C., & Leibler, L. (2008) · Nature · doi:10.1038/nature06669 · Cited by 2,984
Stretchable and Soft Electronics using Liquid Metals
Dickey, M. D. (2017) · Advanced Materials · doi:10.1002/adma.201606425 · Cited by 1,776
Stretchable, Transparent, Ionic Conductors
Keplinger, C., Sun, J.-Y., Foo, C. C., Rothemund, P., Whitesides, G. M., & Suo, Z. (2013) · Science · doi:10.1126/science.1240228 · Cited by 1,754
Embedded 3D Printing of Strain Sensors within Highly Stretchable Elastomers
Muth, J. T., Vogt, D. M., Truby, R. L., Mengüç, Y., Kolesky, D. B., Wood, R. J., & Lewis, J. A. (2014) · Advanced Materials · doi:10.1002/adma.201400334 · Cited by 1,611
Advances in Dielectric Elastomers for Actuators and Artificial Muscles
Brochu, P., & Pei, Q. (2010) · Macromolecular Rapid Communications · doi:10.1002/marc.200900425 · Cited by 1,387
Cited by
Lim, H., Kim, H. S., Qazi, R., Kwon, Y., Jeong, J., & Yeo, W. (2020) · Advanced Materials · doi:10.1002/adma.201901924 · Cited by 1,002
Tough and stretchable ionogels by in situ phase separation
Wang, M., Zhang, P., Shamsi, M., Thelen, J. L., Qian, W., Truong, V. K., Ma, J., Hu, J., & Dickey, M. D. (2022) · Nature Materials · doi:10.1038/s41563-022-01195-4 · Cited by 776
Flexible Electronics and Devices as Human–Machine Interfaces for Medical Robotics
Heng, W., Solomon, S., & Gao, W. (2022) · Advanced Materials · doi:10.1002/adma.202107902 · Cited by 609
Skin-like mechanoresponsive self-healing ionic elastomer from supramolecular zwitterionic network
Zhang, W., Wu, B., Sun, S., & Wu, P. (2021) · Nature Communications · doi:10.1038/s41467-021-24382-4 · Cited by 535
Lei, Z., & Wu, P. (2019) · Nature Communications · doi:10.1038/s41467-019-11364-w · Cited by 432
Metadata
- Authors
- Shi, L., Zhu, T., Gao, G., Zhang, X., Wei, W., Liu, W., & Ding, S.
- Affiliations
- State Key Laboratory of Electrical Insulation and Power Equipment (CN)
- Auburn University (US)
- Corresponding author
- Ding, Shujiang
- Venue
- Nature Communications
- Published
- 2018-07-06
- Volume
- 9
- Issue
- 1
- Pages
- 2630-2630
- ISSN
- 2041-1723 (ISSN-L)
- PMC
- PMC6035269
- OpenAlex
- W2810453571
- Cited by
- 337
- References
- 28
- Citations by year
- 2026: 16 · 2025: 54 · 2024: 51 · 2023: 55 · 2022: 61 · 2021: 45 · 2020: 34 · 2019: 19 · 2018: 2
- FWCI
- 9.99
- Type
- journal article
- Language
- en
- Open access
- gold
- doi.org
- Licence
- cc-by
- creativecommons.org/licenses/by/4.0 (tdm)
- creativecommons.org/licenses/by/4.0 (vor)
- Locations
- Nature Communications (publishedVersion, cc-by)
- Europe PMC (PubMed Central) (publishedVersion, other-oa)
- PubMed Central (publishedVersion, cc-by)
- PubMed (publishedVersion)
- RePEc: Research Papers in Economics (submittedVersion)
- DOAJ (DOAJ: Directory of Open Access Journals) (submittedVersion)
- DOAJ (DOAJ: Directory of Open Access Journals) (submittedVersion, cc-by-sa)
- Funders
- The Fundamental Research Funds for the Central Universitie
- Topics
- Physical Sciences › Engineering › Biomedical Engineering › Advanced Sensor and Energy Harvesting Materials
- Physical Sciences › Materials Science › Polymers and Plastics › Conducting polymers and applications
- Physical Sciences › Engineering › Electrical and Electronic Engineering › Nanomaterials and Printing Technologies
- Keywords
- transparent elastomers, ionic conductivity, tactile sensors, impedance spectra, flexible electronics, soft machines, electrode adhesion, high-temperature stability
About these checks
Registry, retraction, Cites and statistics results are computed, not judged, with one exception: a printed reference that no index lists is read once by a model before it counts as a citation error. Claims are extracted by a model and kept only when their quote appears verbatim in the text; each cited source is then checked, with a model’s help, for whether it says what the claim relies on. Those verdicts can be wrong — read the claim’s quote and the cited source before relying on one.
Statistics and arithmetic are recomputed, not judged.
Confidence bands are shown only for fields calibrated on our annotated test set. None is calibrated yet, so no band is shown.
What counts as a claim ›How we measure confidence ›How we check this ›
Are you an author, or do you see a problem with this page? Request a review
How to cite
Cite CoChat for the checks on this page, and the paper for its own findings.
- This page
- CoChat. (2026). Citation check: Highly stretchable and transparent ionic conducting elastomers. https://app.cochat.ai/papers/10.1038/s41467-018-05165-w
- The paper
- Shi, L., Zhu, T., Gao, G., Zhang, X., Wei, W., Liu, W., & Ding, S. (2018). Highly stretchable and transparent ionic conducting elastomers. Nature Communications. https://doi.org/10.1038/s41467-018-05165-w
Data sources
Bibliographic data: Semantic Scholar, OpenAlex, Crossref.
Contains information from the Semantic Scholar Academic Graph Datasets, made available under the ODC Attribution License (ODC-BY 1.0).
Semantic Scholar’s data is described in: Kinney, R., et al. (2023). The Semantic Scholar Open Data Platform. arXiv:2301.10140.
