

The DOI matches its Crossref record; 38 of the 38 references it cites were found in a registry or an index.
Brain-controlled modulation of spinal circuits improves recovery from spinal cord injury
Open accessAbstract
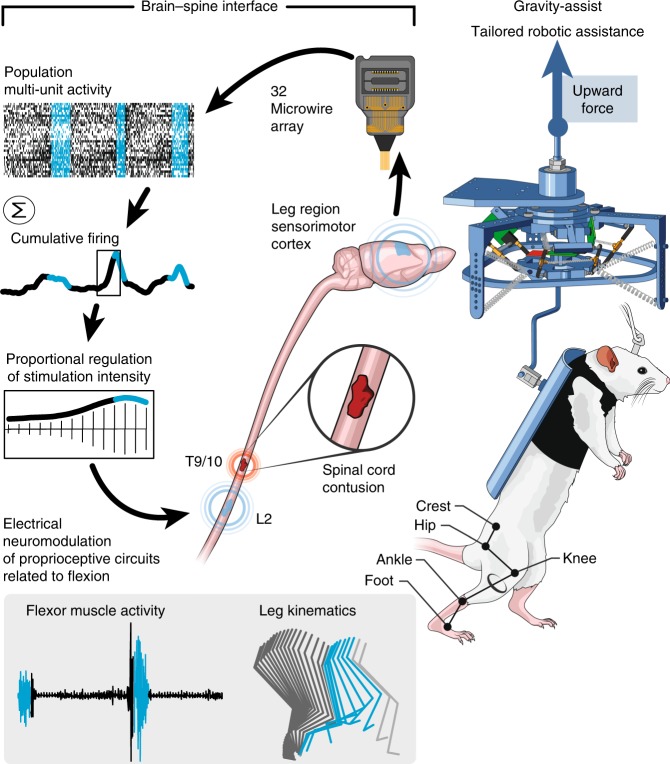
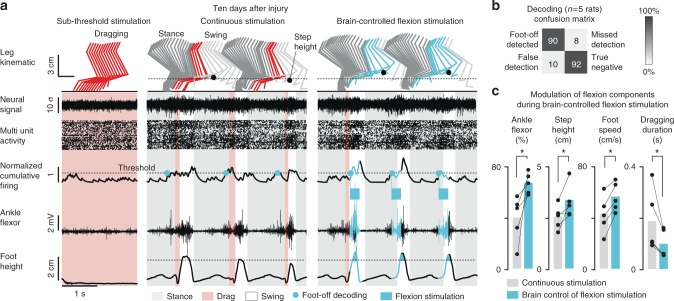
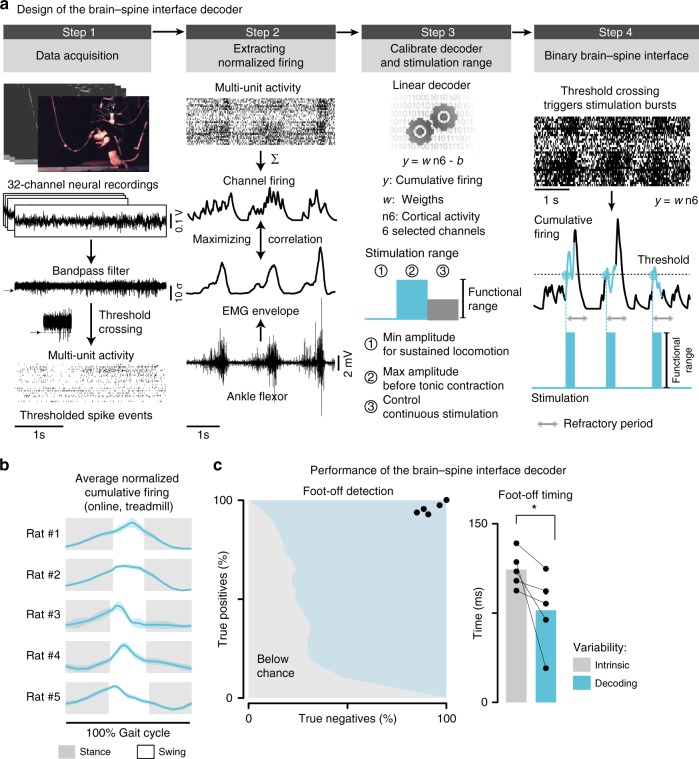
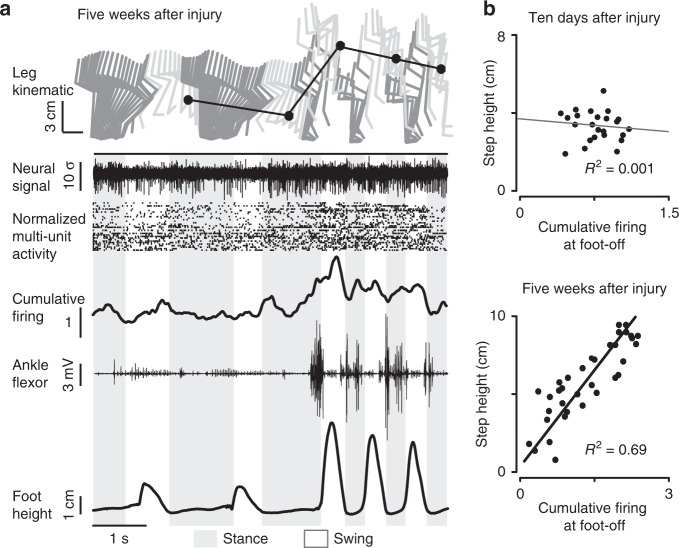
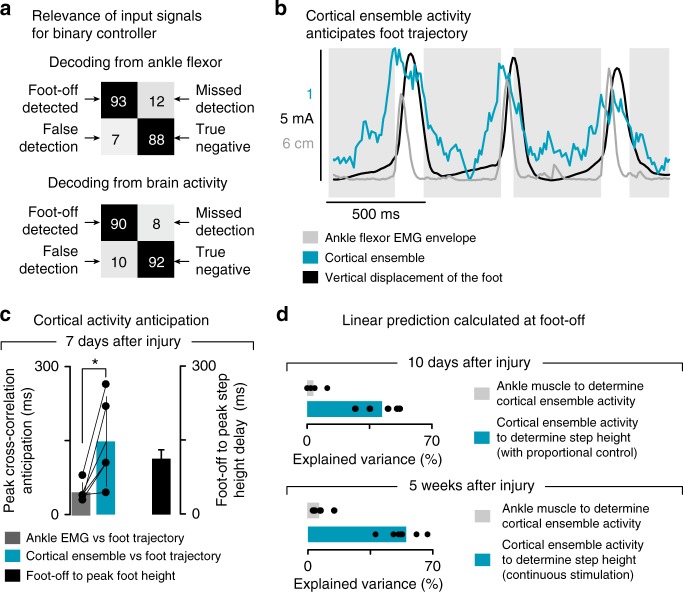
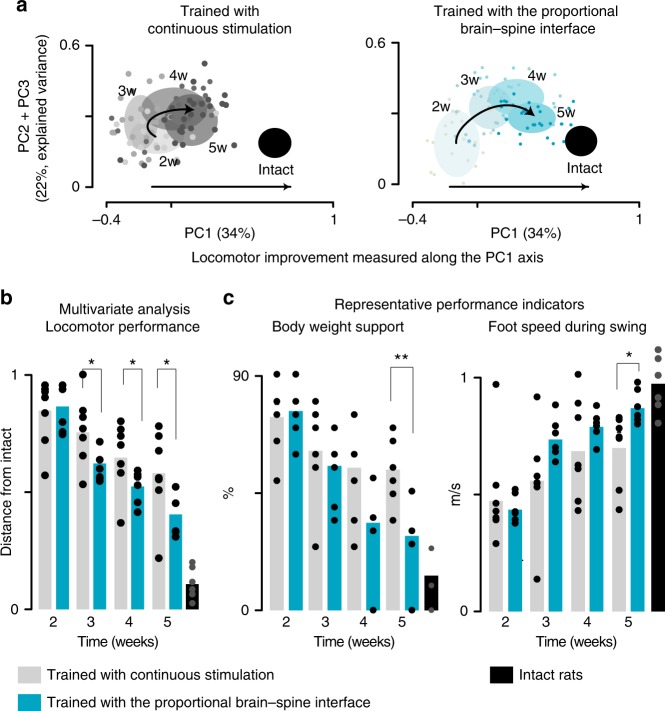
The delivery of brain-controlled neuromodulation therapies during motor rehabilitation may augment recovery from neurological disorders. To test this hypothesis, we conceived a brain-controlled neuromodulation therapy that combines the technical and practical features necessary to be deployed daily during gait rehabilitation. Rats received a severe spinal cord contusion that led to leg paralysis. We engineered a proportional brain–spine interface whereby cortical ensemble activity constantly determines the amplitude of spinal cord stimulation protocols promoting leg flexion during swing. After minimal calibration time and without prior training, this neural bypass enables paralyzed rats to walk overground and adjust foot clearance in order to climb a staircase. Compared to continuous spinal cord stimulation, brain-controlled stimulation accelerates and enhances the long-term recovery of locomotion. These results demonstrate the relevance of brain-controlled neuromodulation therapies to augment recovery from motor disorders, establishing important proofs-of-concept that warrant clinical studies.
Overview
The claims and statistics of this paper haven’t been checked yet.
Run the check — free, no account needed. It reads the open-access text and checks the sources it cites.
Integrity signals
Registry
Cites
Statistics
Figures
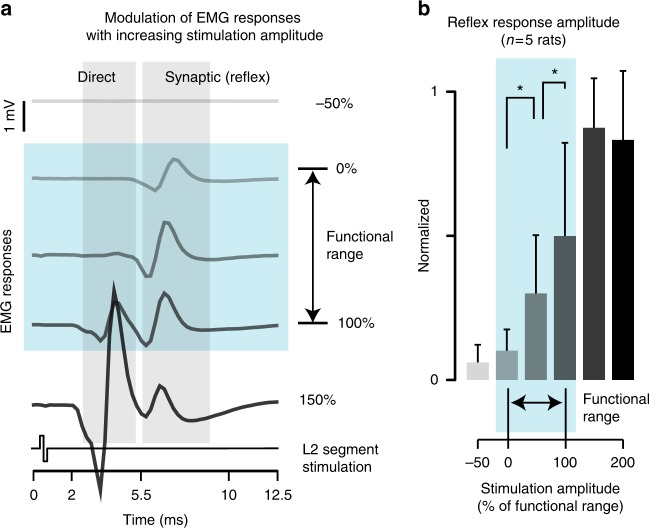
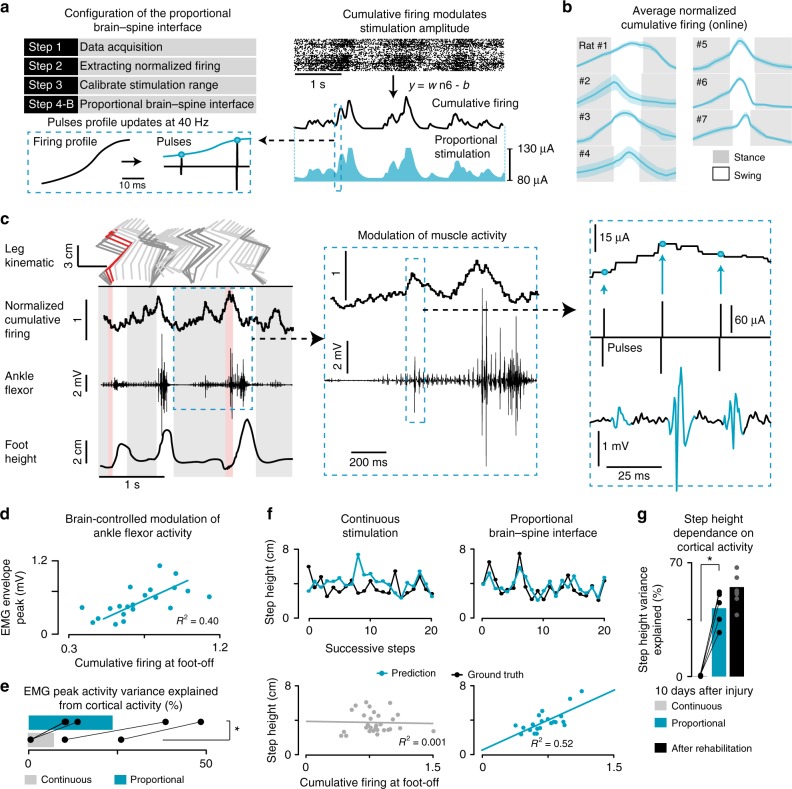
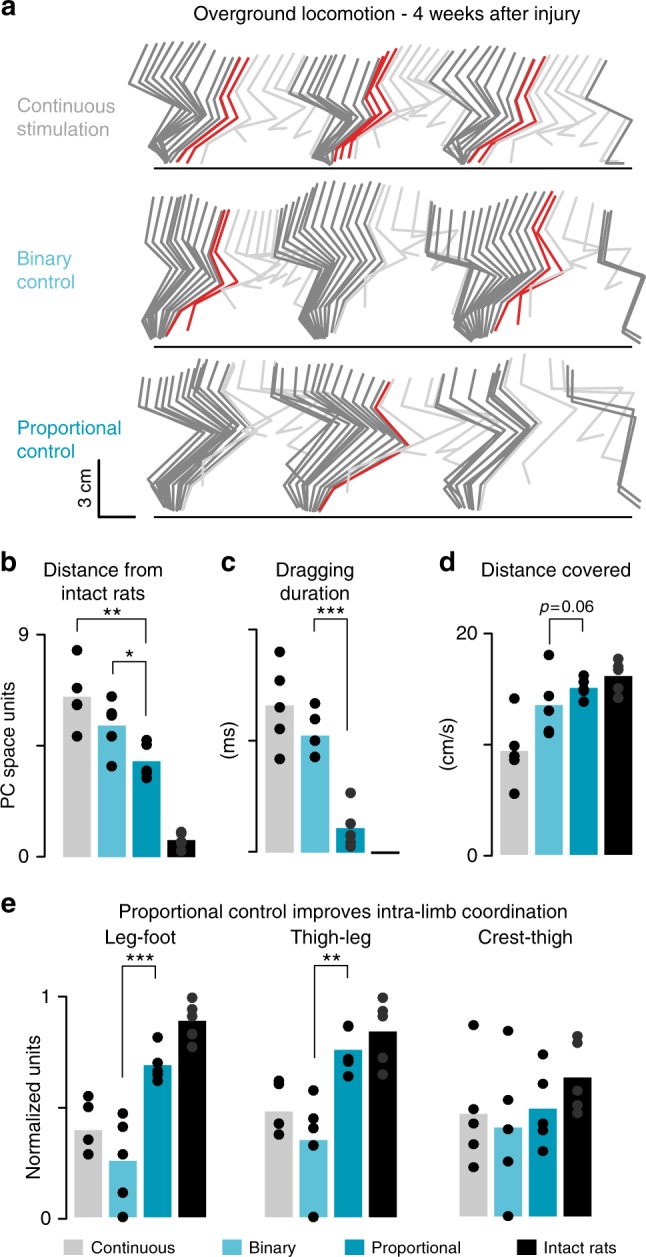
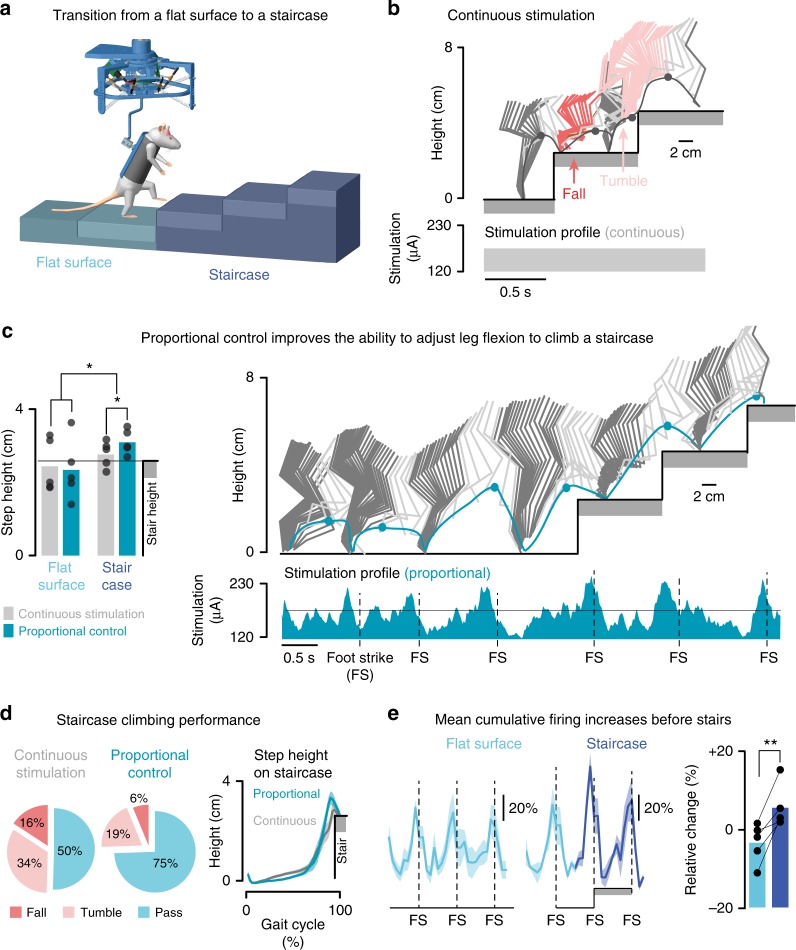
Verification
Claims the paper makes
The claims and statistics of this paper haven’t been checked yet.
Run the check — free, no account needed. It reads the open-access text and checks the sources it cites.
Claims other papers make about this one
Each is checked against this paper’s own text: does it say what the citing paper says it does?
The cited source says what the claim attributes to it.
In the citing paper
“In preclinical models, neurorehabilitation supported by a digital bridge triggered superior recovery compared to epidural electrical stimulation alone15.”
From Walking naturally after spinal cord injury using a brain–spine interface (2023) · cites this paper as [15]
Self-check
Percentages, sums and reported differences re-computed from the paper’s own numbers.
The self-check needs the paper’s full text.
Citations
Cites
Reach and grasp by people with tetraplegia using a neurally controlled robotic arm
Hochberg, L. R., Bacher, D., Jarosiewicz, B., Masse, N. Y., Simeral, J. D., Vogel, J., Haddadin, S., Liu, J., Cash, S. S., van der Smagt, P., et al. (2012) · Nature · doi:10.1038/nature11076 · Cited by 2,719
van den Berg, R. A., Hoefsloot, H. C., Westerhuis, J. A., Smilde, A. K., & van der Werf, M. J. (2006) · BMC Genomics · doi:10.1186/1471-2164-7-142 · Cited by 2,450
Experience-dependent structural synaptic plasticity in the mammalian brain
Holtmaat, A., & Svoboda, K. (2009) · Nature Reviews Neuroscience · doi:10.1038/nrn2699 · Cited by 1,934
High-performance neuroprosthetic control by an individual with tetraplegia
Collinger, J. L., Wodlinger, B., Downey, J. E., Wang, W., Tyler-Kabara, E. C., Weber, D. J., McMorland, A. J., Velliste, M., Boninger, M. L., & Schwartz, A. B. (2013) · The Lancet · doi:10.1016/s0140-6736(12)61816-9 · Cited by 1,848
Restoring cortical control of functional movement in a human with quadriplegia
Bouton, C. E., Shaikhouni, A., Annetta, N. V., Bockbrader, M. A., Friedenberg, D. A., Nielson, D. M., Sharma, G., Sederberg, P. B., Glenn, B. C., Mysiw, W. J., et al. (2016) · Nature · doi:10.1038/nature17435 · Cited by 924
Ajiboye, A. B., Willett, F. R., Young, D. R., Memberg, W. D., Murphy, B. A., Miller, J. P., Walter, B. L., Sweet, J. A., Hoyen, H. A., Keith, M. W., et al. (2017) · The Lancet · doi:10.1016/s0140-6736(17)30601-3 · Cited by 862
Restoring Voluntary Control of Locomotion after Paralyzing Spinal Cord Injury
van den Brand, R., Heutschi, J., Barraud, Q., DiGiovanna, J., Bartholdi, K., Huerlimann, M., Friedli, L., Vollenweider, I., Moraud, E. M., Duis, S., et al. (2012) · Science · doi:10.1126/science.1217416 · Cited by 767
Self-citationA brain–spine interface alleviating gait deficits after spinal cord injury in primates
Capogrosso, M., Milekovic, T., Borton, D., Wagner, F., Moraud, E. M., Mignardot, J.-B., Buse, N., Gandar, J., Barraud, Q., Xing, D., et al. (2016) · Nature · doi:10.1038/nature20118 · Cited by 635
Self-citationMotor Cortex Is Required for Learning but Not for Executing a Motor Skill
Kawai, R., Markman, T. M., Poddar, R., Ko, R., Fantana, A. L., Dhawale, A. K., Kampff, A. R., & Ölveczky, B. P. (2015) · Neuron · doi:10.1016/j.neuron.2015.03.024 · Cited by 583
Restoration of grasp following paralysis through brain-controlled stimulation of muscles
Ethier, C., Oby, E. R., Bauman, M. J., & Miller, L. E. (2012) · Nature · doi:10.1038/nature10987 · Cited by 485
Cited by
Sorted by citations
Items 101–149 of 149
Technologies in clinical neurophysiology for brain-body interfacing: IFCN handbook chapter
Cimolato, A., Sparapani, A., & Raspopović, S. (2026) · Clinical Neurophysiology · doi:10.1016/j.clinph.2026.2111913 · Cited by 3
Hu, D., Wang, S., Li, B., Liu, H., & He, J. (2021) · Brain Sciences · doi:10.3390/brainsci11091193 · Cited by 3
Spinal interneurons, motor synergies, and modularity
Giszter, S. F., Smith, T., & Borisyuk, A. P. (2022) · Elsevier eBooks · doi:10.1016/b978-0-12-819260-3.00016-0 · Cited by 2
Massai, E., Bonizzato, M., de Jesus, I., Drainville, R., & Martinez, M. (2024) · eLife · doi:10.7554/elife.92940.3 · Cited by 3
Self-citationDeng, J., Xie, H.-M., Chen, Y., Peng, Z., Zhao, J., Zhou, Y., Chen, C., & Zhang, K. (2021) · Neuroreport · doi:10.1097/wnr.0000000000001694 · Cited by 3
Validation of manifold-based direct control for a brain-to-body neural bypassPreprint
Losanno, E., Badi, M., Roussinova, E., Bogaard, A. R., Delacombaz, M., Shokur, S., & Micera, S. (2022) · bioRxiv (Cold Spring Harbor Laboratory) · doi:10.1101/2022.07.25.501351 · Cited by 3
Self-citationBrain-Controlled Epidural Spinal Stimulation for Upper-Limb Motor Function after TetraplegiaPreprint
Sasaki, A., Fadli, R. A., Yuasa, A., Boogaart, Z., Saito, H., Musikic, N., de Freitas, R., Macellari, N., Davis, K., Datta, N., et al. (2025) · medRxiv · doi:10.1101/2025.07.02.25330433 · Cited by 4
Lv, X., Liu, H., Chen, L., Dai, C., Wei, P., Hao, J., & Zhao, G. (2023) · Journal of Neural Engineering · doi:10.1088/1741-2552/acd603 · Cited by 2
Neural Interfaces: Applications, Innovative Approaches, Biocompatibility, Biomimetics
Zemlyanskov, M. S., Arsentiev, K. A., Shtol, V. S., Konovalova, S. P., Grinevich, V. P., & Евгеньевич, М. П. (2025) · Journal of Evolutionary Biochemistry and Physiology · doi:10.1134/s0022093025040118 · Cited by 2
Ricciardi, L., Lofrese, G., Perna, A., & Trungu, S. (2022) · IntechOpen eBooks · doi:10.5772/intechopen.98082 · Cited by 3
Translational research in spinal cord injury – What is in the future?
Hejrati, N., McIntyre, W. B., Pieczonka, K., Ostmeier, S., Ahuja, C. S., Kwon, B. K., Vaccaro, A. R., Öner, F. C., & Fehlings, M. G. (2022) · Elsevier eBooks · doi:10.1016/b978-0-12-819835-3.00013-7 · Cited by 2
Adaptation Strategies for Personalized Gait Neuroprosthetics
Koelewijn, A. D., Audu, M. L., del‐Ama, A. J., Colucci, A., Font-Llagunes, J. M., Gogeascoechea, A., Hnat, S. K., Makowski, N. S., Moreno, J. C., Nandor, M. J., et al. (2021) · Frontiers in Neurorobotics · doi:10.3389/fnbot.2021.750519 · Cited by 4
Talifu, Z., Xu, X. P., Du, H., Li, Z., Wang, X., Zhang, C., Pan, Y., Ke, H., Liu, W., Gao, F., et al. (2025) · Animal Models and Experimental Medicine · doi:10.1002/ame2.12545 · Cited by 1
New Applications of Neurotechnologies for Neurological Disorders
Orsborn, A. L., Pirondini, E., Capogrosso, M., Gaunt, R. A., & Stavisky, S. D. (2025) · Springer eBooks · doi:10.1007/978-3-031-89307-0_25 · Cited by 1
Eyvazpour, R., Farrokhi, B., & Erfanian, A. (2025) · iScience · doi:10.1016/j.isci.2025.114521 · Cited by 2
Yousak, A., Jose, K. A., & Gorgey, A. S. (2026) · Journal of Clinical Medicine · doi:10.3390/jcm15020879 · Cited by 1
Neuromodulation for gait disorders
Balachandar, A., Sorrento, G. U., Moraud, E. M., Bonizzato, M., & Fasano, A. A. (2026) · Nature Reviews Bioengineering · doi:10.1038/s44222-026-00431-9 · Cited by 1
Self-citationMelo, M. C., Pinheiro, D. J. L. L., Dantas, R. L. M., Athanazio, N. M. A., Morozini, C. F., dos Santos, G. C., Fernandes, G. L., Lemos, N. L. B. M., & Faber, J. (2024) · World Congress on Medical Physics and Biomedical Engineering, September 7 - 12, 2009, Munich, Germany · doi:10.1007/978-3-031-49407-9_8 · Cited by 1
Towards Brain-Machine Interface-Based Rehabilitation for Patients with Chronic Complete Paraplegia
Shokur, S. (2021) · Springer briefs in electrical and computer engineering · doi:10.1007/978-3-030-60460-8_14 · Cited by 1
Miyai, I. (2020) · リハビリテーション医学 : 日本リハビリテーション医学会誌 · doi:10.2490/jjrmc.57.965
Modern approaches of signal processing for bidirectional neural interfaces
Cimolato, A., Katic, N., & Raspopović, S. (2021) · Elsevier eBooks · doi:10.1016/b978-0-12-822828-9.00016-2
Optimizing Neuroprosthetic Therapies via Autonomous Learning AgentsPreprint
Bonizzato, M., Côté, S. L., Massai, E., Hottin, R. G., Laferrière, S., Quessy, S., Lajoie, G., Martinez, M., & Dancause, N. (2021) · SSRN Electronic Journal · doi:10.2139/ssrn.3925256
Self-citationHybrid Robotics and Neuroprosthetics for Associative Neurorehabilitation
Barroso, F. O., Moreno, J. C., Torricelli, D., & Pons, J. L. (2022) · Handbook of Neuroengineering · doi:10.1007/978-981-15-2848-4_54-1
Disc Prolapses In The Spine on Magnetic Resonance Imaging
Fatima, S. T., John, A., Ali, A. S., Bakhtawar, K., & Ahmed, A. A. (2022) · Pakistan Journal of Health Sciences · doi:10.54393/pjhs.v3i01.48
Hybrid Robotics and Neuroprosthetics for Associative Neurorehabilitation
Barroso, F. O., Moreno, J. C., Torricelli, D., & Pons, J. L. (2023) · Handbook of Neuroengineering · doi:10.1007/978-981-16-5540-1_54
Analysis of Cerebral and Muscle Activity during Control of a Corticospinal Neural Interface
Bobrova, E. V., Решетникова, В. В., Гришин, А. А., Vershinina, E. A., Isaev, M. R., Plyachenko, D., Дмитриевич, Б. П., & Gerasimenko, Y. P. (2023) · Neuroscience and Behavioral Physiology · doi:10.1007/s11055-023-01552-z
Brain-Body Interfaces to Assist and Restore Motor Functions in People with Paralysis
Losanno, E., Badi, M., Roussinova, E., Bogaard, A. R., Delacombaz, M., Shokur, S., & Micera, S. (2023) · Springer briefs in electrical and computer engineering · doi:10.1007/978-3-031-49457-4_7
Self-citationToro, C. A., Gasperi, R. D., Aslan, A., Johnson, N. P., Siddiq, M. M., Chow, C., Zhao, W., Harlow, L., Graham, Z., Liu, X., et al. (2024) · Neurotrauma Reports · doi:10.1089/neur.2023.0089
ANALYSIS OF BRAIN AND MUSCLE ACTIVITY DURING CONTROL OF BRAIN-SPINE NEUROINTERFACE
Bobrova, E. V., Решетникова, В. В., Гришин, А. А., Vershinina, E. A., Isaev, M. R., Plyachenko, D., Дмитриевич, Б. П., & Gerasimenko, Y. P. (2023) · Журнал высшей нервной деятельности им И П Павлова · doi:10.31857/s0044467723040032
Unveiling Current Advances in Bioelectronic Medicine: A Comprehensive Review
Deshkar, S. S., Ovhal, K. G., Kothapalli, L., Shirolkar, S. V., & Pagar, R. R. (2024) · Drug Delivery Letters · doi:10.2174/0122103031288230240424043423
Massai, E., Bonizzato, M., de Jesus, I., Drainville, R., & Martinez, M. (2024) · eLife · doi:10.7554/elife.92940.2
Self-citationSénépart, O., Legay, C., & Hamraoui, A. (2025) · Biophysics Reviews · doi:10.1063/5.0237085
Synchronous Integrated Detection System for Animal Gait and Cortical Functional Network Connectivity
Wan, S., Wang, Q., Ws, H., Huang, D., Yan, J., Ji, H., Ning, Y., & Yuan, Y. (2026) · IEEE Transactions on Neural Systems and Rehabilitation Engineering · doi:10.1109/tnsre.2026.3664296
Bilodeau, G., Miao, A., Gagnon-Turcotte, G., Éthier, C., & Gosselin, B. J. (2026) · bioRxiv (Cold Spring Harbor Laboratory) · doi:10.64898/2026.03.25.714179
Ermolaeva, M. E., Mohammadshirazi, A., Sayenko, D. G., & Taccola, G. (2026) · Neural Plasticity · doi:10.1155/np/7460038
O’Connor, C., Mullally, R. E., Chávez, J. C. P., Dobricic, M., McCoy, E., Maughan, J., Stewart, R., Saha, C., O'Sullivan, J., McCarthy, H. O., et al. (2026) · bioRxiv (Cold Spring Harbor Laboratory) · doi:10.64898/2026.04.22.719922
A temporally biosynchronized and physically transient peripheral nerve interface
Yang, C., Hou, H., Sun, P., Dong, Y., Gao, X., Chen, L., Tan, J., Lu, Y., Yang, Z., Liu, S., et al. (2026) · Soft Science · doi:10.20517/ss.2026.11
Zhang, X., & Sheng, J. (2026) · Frontiers in Neurology · doi:10.3389/fneur.2026.1838329
Rosado, E., Shon, A., & Wu, W. (2026) · Sensors · doi:10.3390/s26144480
Bypass neural interfaces for paralysis: clinical translation, challenges and future directions
Lee, M. J. R., Tan, A. K. S., Lo, Y. T., Liu, C., & Jiang, L. (2026) · Journal of NeuroEngineering and Rehabilitation · doi:10.1186/s12984-026-02082-8
Decoding hindlimb movement states before and after spinal cord injury using local field potentials
Zhao, Z., Chen, D., Mao, H., Li, X., Li, W., Li, Q., & Zhang, P. (2026) · Brain Horizons · doi:10.1016/j.bhoriz.2026.07.001
Yan, W., Luo, Q., Du, C., Li, H., Chen, S., Yuan, Z., Hou, X., & Wang, H. (2026) · npj Biomedical Innovations. · doi:10.1038/s44385-026-00098-2
Brain-spine interface: an exploration of a potential future treatment for spinal cord injury
Sivan, V., Alam, Z., Polavarapu, H., Manivel, S., Kumar, R. P., O’Malley, G. R., Ruzicka, F., & Patel, N. V. (2026) · Neurosurgical Review · doi:10.1007/s10143-026-04456-x
Gene editing technologies in poultry: advances, applications, and future prospects
Shuaib, M., Warsito, S. H., Lai, W., Ullah, O., MUKHTIAR, M., Sufyan, A., Mustofa, I., Abass, K. S., Uzair, M. S., Iqbal, M., et al. (2026) · World s Poultry Science Journal · doi:10.1080/00439339.2026.2734924
Li, C., Xu, S., Li, W., Jin, D., Zhao, Y., Zhang, C., Li, W., Sun, Z., & Zhou, S. (2026) · Micromachines · doi:10.3390/mi17101210
Metadata
- Authors
- Bonizzato, M., Pidpruzhnykova, G., DiGiovanna, J., Shkorbatova, P., Pavlova, N., Micera, S., & Courtine, G.
- Affiliations
- École Polytechnique Fédérale de Lausanne (CH)
- Pavlov Institute of Physiology of the Russian Academy of Sciences (RU)
- Scuola Superiore Sant'Anna (IT)
- Board of the Swiss Federal Institutes of Technology (CH)
- Corresponding author
- Courtine, Grégoire
- ORCID
- Venue
- Nature Communications
- Published
- 2018-08-01
- Volume
- 9
- Issue
- 1
- Pages
- 3015-3015
- ISSN
- 2041-1723 (ISSN-L)
- PMC
- PMC6070513
- OpenAlex
- W2882976771
- Cited by
- 149
- References
- 38
- Citations by year
- 2026: 17 · 2025: 11 · 2024: 13 · 2023: 27 · 2022: 24 · 2021: 28 · 2020: 12 · 2019: 13 · 2018: 4
- FWCI
- 10.84
- Type
- journal article
- Language
- en
- Open access
- gold
- doi.org
- Locations
- Nature Communications (publishedVersion, cc-by)
- Europe PMC (PubMed Central) (publishedVersion, cc-by)
- PubMed Central (publishedVersion, cc-by)
- PubMed (publishedVersion)
- SERVAL (Université de Lausanne) (publishedVersion, cc-by)
- IRIS (submittedVersion, cc-by)
- RePEc: Research Papers in Economics (submittedVersion)
- DOAJ (DOAJ: Directory of Open Access Journals) (submittedVersion, cc-by-sa)
- DOAJ (DOAJ: Directory of Open Access Journals) (submittedVersion)
- Infoscience (Ecole Polytechnique Fédérale de Lausanne) (submittedVersion, cc-by-nc-nd)
- PolyPublie (École Polytechnique de Montréal) (submittedVersion)
- CINECA IRIS Institutional Research Information System (Sant'Anna School of Advanced Studies) (submittedVersion)
- Funders
- National Science Foundation
- Wyss Center for Bio and Neuroengineering
- Schweizerischer Nationalfonds zur Förderung der Wissenschaftlichen Forschung (160696)
- H2020 European Research Council (682999)
- Topics
- Health Sciences › Medicine › Clinical Neurology › Spinal Cord Injury Research
- Health Sciences › Medicine › Rehabilitation › Stroke Rehabilitation and Recovery
- Life Sciences › Neuroscience › Cellular and Molecular Neuroscience › Neuroscience and Neural Engineering
- Keywords
- spinal cord injury, spinal cord stimulation, locomotor recovery, gait rehabilitation, leg paralysis, overground walking, foot clearance, stair climbing
- MeSH terms
- Animals, Brain, Electromyography, Electric Stimulation Therapy, Extremities, Female, Gait, Locomotion, Muscles, Nerve Net, Rats, Inbred Lew, Spinal Cord, Spinal Cord Injuries, Reproducibility of Results, Walking, Recovery of Function
About these checks
Registry, retraction, Cites and statistics results are computed, not judged, with one exception: a printed reference that no index lists is read once by a model before it counts as a citation error. Claims are extracted by a model and kept only when their quote appears verbatim in the text; each cited source is then checked, with a model’s help, for whether it says what the claim relies on. Those verdicts can be wrong — read the claim’s quote and the cited source before relying on one.
Statistics and arithmetic are recomputed, not judged.
Confidence bands are shown only for fields calibrated on our annotated test set. None is calibrated yet, so no band is shown.
What counts as a claim ›How we measure confidence ›How we check this ›
Are you an author, or do you see a problem with this page? Request a review
