

The DOI matches its Crossref record; 79 of the 80 references it cites were found in a registry or an index.
Post-drought decline of the Amazon carbon sink.
Open accessAbstract
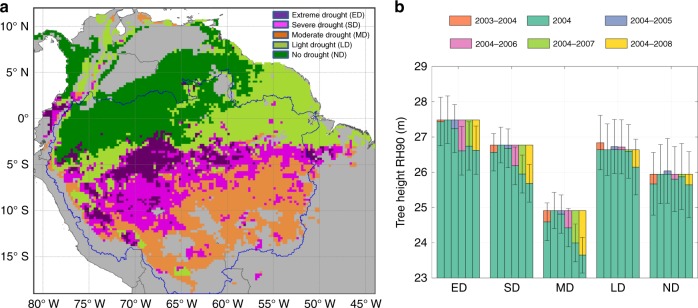
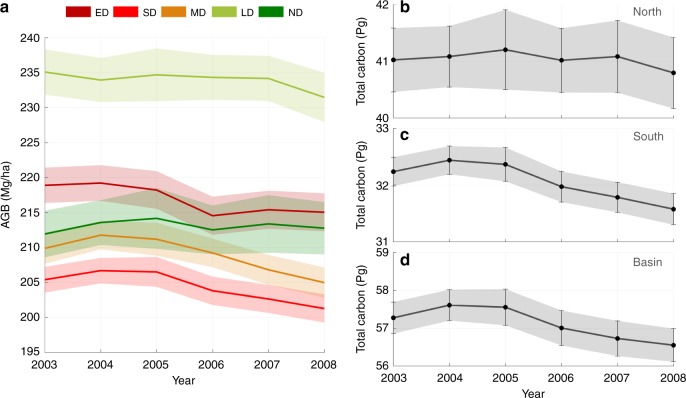
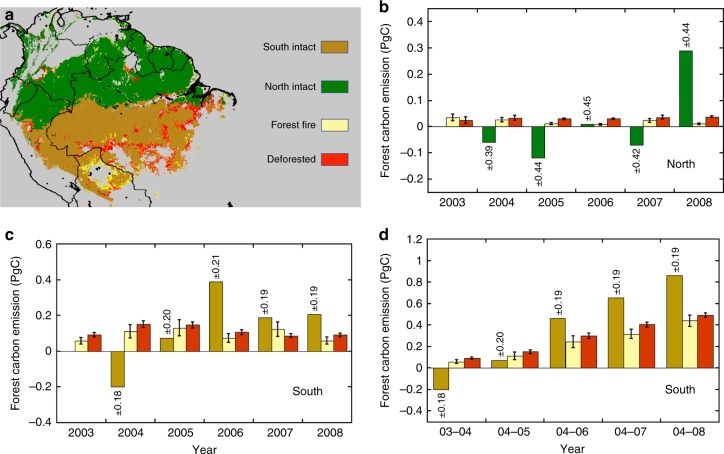
Abstract Amazon forests have experienced frequent and severe droughts in the past two decades. However, little is known about the large-scale legacy of droughts on carbon stocks and dynamics of forests. Using systematic sampling of forest structure measured by LiDAR waveforms from 2003 to 2008, here we show a significant loss of carbon over the entire Amazon basin at a rate of 0.3 ± 0.2 (95% CI) PgC yr−1 after the 2005 mega-drought, which continued persistently over the next 3 years (2005–2008). The changes in forest structure, captured by average LiDAR forest height and converted to above ground biomass carbon density, show an average loss of 2.35 ± 1.80 MgC ha−1 a year after (2006) in the epicenter of the drought. With more frequent droughts expected in future, forests of Amazon may lose their role as a robust sink of carbon, leading to a significant positive climate feedback and exacerbating warming trends.
Overview
The claims and statistics of this paper haven’t been checked yet.
Run the check — free, no account needed. It reads the open-access text and checks the sources it cites.
Integrity signals
Registry
Cites
Statistics
Figures
Verification
Claims the paper makes
The claims and statistics of this paper haven’t been checked yet.
Run the check — free, no account needed. It reads the open-access text and checks the sources it cites.
Claims other papers make about this one
Each is checked against this paper’s own text: does it say what the citing paper says it does?
The source backs part of the claim, not all of it — or backs it for a different population, condition or comparison.
In the citing paper
“However, during 2005-2008 the Amazon was a net carbon source due to drought-stressed and dying trees, combined with increased occurrence of fires (Zeng et al., 2008;Yang et al., 2018).”
From The tropical atlantic observing system (2019) · cites this paper as Yang et al., 2018
Experimental — accuracy not yet measured
Self-check
Percentages, sums and reported differences re-computed from the paper’s own numbers.
The self-check needs the paper’s full text.
Citations
Cites
Breiman, L. (2001) · Machine Learning · doi:10.1023/a:1010933404324 · Cited by 133,538
High-Resolution Global Maps of 21st-Century Forest Cover Change
Hansen, M. C., Potapov, P. V., Moore, R., Hancher, M., Turubanova, S. A., Tyukavina, A., Thau, D., Stehman, S. V., Goetz, S. J., Loveland, T. R., et al. (2013) · Science · doi:10.1126/science.1244693 · Cited by 11,704
A large and persistent carbon sink in the world’s forests
Pan, Y., Birdsey, R. A., Fang, J., Houghton, R., Kauppi, P. E., Kurz, W. A., Phillips, O. L., Shvidenko, A., Lewis, S. L., Canadell, J. G., et al. (2011) · Science · doi:10.1126/science.1201609 · Cited by 8,458
Huffman, G. J., Bolvin, D. T., Nelkin, E. J., Wolff, D. B., Adler, R. F., Gu, G., Hong, Y. E., Bowman, K. P., & Stocker, E. F. (2007) · Journal of Hydrometeorology · doi:10.1175/jhm560.1 · Cited by 6,773
Distance to Nearest Neighbor as a Measure of Spatial Relationships in Populations
Clark, P. J., & Evans, F. C. (1954) · Ecology · doi:10.2307/1931034 · Cited by 3,921
MODIS Collection 5 global land cover: Algorithm refinements and characterization of new datasets
Friedl, M. A., Sulla‐Menashe, D., Tan, B., Schneider, A., Ramankutty, N., Sibley, A. M., & Huang, X. (2009) · Remote Sensing of Environment · doi:10.1016/j.rse.2009.08.016 · Cited by 3,501
Allen, C. D., Breshears, D. D., & McDowell, N. G. (2015) · Ecosphere · doi:10.1890/es15-00203.1 · Cited by 2,679
Benchmark map of forest carbon stocks in tropical regions across three continents
Saatchi, S. S., Harris, N. L., Brown, S., Lefsky, M. A., Mitchard, E. T. A., Salas, W., Zutta, B. R., Buermann, W., Lewis, S. L., Hagen, S. C., et al. (2011) · Proceedings of the National Academy of Sciences · doi:10.1073/pnas.1019576108 · Cited by 2,504
Self-citationDrought Sensitivity of the Amazon Rainforest
Phillips, O. L., Aragão, L. E. O. C., Lewis, S. L., Fisher, J. B., Lloyd, J., López‐González, G., Malhi, Y. S., Monteagudo, A. L., Peacock, J., Quesada, C. A., et al. (2009) · Science · doi:10.1126/science.1164033 · Cited by 1,854
Meinshausen, N. (2006) · Cited by 1,522
Research works printed but not linked: 2
- Cochran, W. G. Sampling Techniques 3rd edn (John Wiley & Sons, New York, 1977).
- Hastie, T., Tibshirani, R. & Friedman, J. The Elements of Statistical Learning: Data Mining, Inference, and Prediction (Springer Science & Business Media, Berlin, 2013).
Cited by
Sorted by citations
Items 101–189 of 189
Wey, H., Pongratz, J., Nabel, J. E. M. S., & Naudts, K. (2022) · Journal of Geophysical Research Biogeosciences · doi:10.1029/2021jg006525 · Cited by 14
Fan, L., Cui, T., Wigneron, J., Ciais, P., Sitch, S. A., Brandt, M., Li, X., Niu, S., Xiao, X., Chave, J., et al. (2024) · Global Change Biology · doi:10.1111/gcb.17423 · Cited by 13
Northward expansion of fire-adaptative vegetation in future warming
Liu, M., & Yang, L. (2022) · Environmental Research Letters · doi:10.1088/1748-9326/ac417d · Cited by 13
Water Stress Dominates 21st‐Century Tropical Land Carbon Uptake
Levine, P. A., Bloom, A. A., Bowman, K. W., Reager, J. T., Worden, J. R., Liu, J., Parazoo, N. C., Meyer, V., Konings, A. G., & Longo, M. (2023) · Global Biogeochemical Cycles · doi:10.1029/2023gb007702 · Cited by 12
Liu, L., Gong, F., Chen, X., Su, Y., Fan, L., Wu, S., Yang, X., Zhang, J., Yuan, W., Ciais, P., et al. (2021) · Remote Sensing in Ecology and Conservation · doi:10.1002/rse2.229 · Cited by 12
Huang, X., Zhen, Z., Zhao, W., & Wang, X. (2024) · GIScience & Remote Sensing · doi:10.1080/15481603.2024.2383040 · Cited by 11
Чэн, Б., Xu, X., Wang, S., Yang, T., Liu, Z., & Falk, S. (2024) · The Science of The Total Environment · doi:10.1016/j.scitotenv.2024.176903 · Cited by 11
Mathbout, S., Boustras, G., Papazoglou, P., Vide, J. M., & Raai, F. (2025) · Environmental and Sustainability Indicators · doi:10.1016/j.indic.2025.100631 · Cited by 12
Xiong, Q., Sun, Z., Wei, C., Lei, J., Fu, X., & Wu, L. (2022) · Water · doi:10.3390/w14020157 · Cited by 12
Klarenberg, G., Muñoz‐Carpena, R., Perz, S. G., Baraloto, C., Marsik, M., Jane Southworth, B., & Zhu, L. (2019) · Scientific Data · doi:10.1038/s41597-019-0093-7 · Cited by 10
Sun, X., Xiao, Y., Wang, J., Zhou, M., Song, Z., Ma, M., & Han, X. (2024) · Remote Sensing · doi:10.3390/rs16081316 · Cited by 10
Liu, J., Bowman, K. W., Palmer, P. I., Joiner, J., Levine, P. A., Bloom, A. A., Feng, L., Saatchi, S. S., Keller, M., Longo, M., et al. (2024) · AGU Advances · doi:10.1029/2024av001187 · Cited by 11
Self-citationDorheim, K., Gough, C. M., Haber, L. T., Mathes, K. C., Shiklomanov, A., & Bond‐Lamberty, B. (2021) · Journal of Geophysical Research Biogeosciences · doi:10.1029/2021jg006587 · Cited by 10
Multi-fold increase in rainforest tipping risk beyond 1.5–2 °C warming
Singh, C., van der Ent, R., Fetzer, I., & Wang‐Erlandsson, L. (2024) · Earth System Dynamics · doi:10.5194/esd-15-1543-2024 · Cited by 12
Dispersion of Smoke Plumes over South America
Jury, M. R., & Pabón, A. R. G. (2021) · Earth Interactions · doi:10.1175/ei-d-20-0004.1 · Cited by 9
Future Drought‐Induced Tree Mortality Risk in Amazon Rainforest
Yao, Y., Ciais, P., Joetzjer, É., Hong, S., Li, W., Zhu, L., & Viovy, N. (2024) · Earth s Future · doi:10.1029/2023ef003740 · Cited by 10
The Indigenous Territories and Local Sustainable Development in the Amazon Region
Becerra, M. J., Rangel, J. A. F., Gonçalves, C. U., & Tovar, G. I. (2021) · Springer eBooks · doi:10.1007/978-981-16-2221-2_4 · Cited by 9
Wang, H., & Huang, C. (2023) · Global Change Biology · doi:10.1111/gcb.17000 · Cited by 8
Ribeiro, A. T., Teodoro, G. S., da Silva, K. C., Pereira‐Matos, Y. C., Batista, B. L., & Lobato, A. K. D. S. (2023) · Plant Biology · doi:10.1111/plb.13563 · Cited by 8
Schwab, M., Haghipour, N., & Eglinton, T. I. (2024) · Geochimica et Cosmochimica Acta · doi:10.1016/j.gca.2024.12.009 · Cited by 7
Chamberlin, A. J., Liu, Z. Y.-C., Cross, C. G. L., Pourtois, J. D., Siregar, I. Z., Nurrochmat, D. R., Setiawan, Y. A., Webb, K., Hopkins, S. R., Sokolow, S. H., et al. (2025) · Remote Sensing · doi:10.3390/rs17213592 · Cited by 8
Tian, S., Wu, W., Chen, S., Song, D., Li, L., & Li, Z. (2024) · Resources Conservation and Recycling · doi:10.1016/j.resconrec.2024.107704 · Cited by 8
Xie, M., Zhu, Y., Liu, S., Deng, D., Zhu, L., Zhao, M., & Wang, Z. (2022) · Forests · doi:10.3390/f13122147 · Cited by 6
Xu, R., Zhang, J., Wang, J., Yao, F., & Zhang, S. (2023) · Remote Sensing · doi:10.3390/rs15245677 · Cited by 7
Droughts Amplify Soil Moisture Losses in Burned Forests of Southeastern Amazonia
da Silva, A. C. S., Silvério, D. V., Macedo, M. N., Coe, M. T., Maracahipes, L., Uribe, M. D. R., Maracahipes‐Santos, L., de Oliveira, P. T. S., Rattis, L., & Brando, P. M. (2024) · Journal of Geophysical Research Biogeosciences · doi:10.1029/2024jg008011 · Cited by 5
Excessive Wetness Suppresses Carbon Sink of Amazon Forest Under Seasonal Water Surplus
Ren, S., Xu, X., Jia, G., Artaxo, P., Machado, L. A. T., Montes, J. A. G., Nobre, C. A., Rizzo, L. V., & Xiao, X. (2025) · Global Change Biology · doi:10.1111/gcb.70422 · Cited by 5
Li, M.-Y., Wang, M., Li, N., Ge, J.-N., & Hao, G. (2024) · Forest Ecology and Management · doi:10.1016/j.foreco.2024.122414 · Cited by 5
Legacy Effects of the Siberian Heatwave of 2020 on Above‐ and Belowground Processes
Kwon, M. J., Ciais, P., Bastos, A., & Beer, C. (2025) · Global Biogeochemical Cycles · doi:10.1029/2025gb008607 · Cited by 6
GHG emissions in Brazilian Agriculture and livestock sectors and the risk to Amazonia conservation
Pereira, É. J. D. A. L., Diele‐Viegas, L. M., & Ribeiro, L. C. D. S. (2024) · The European Physical Journal B · doi:10.1140/epjb/s10051-024-00720-5 · Cited by 5
Serra‐Maluquer, X., Astigarraga, J., Morales‐Molino, C., & Ruiz‐Benito, P. (2025) · Ecography · doi:10.1002/ecog.07740 · Cited by 5
Climate change and human health: Primary, secondary, and tertiary effects
Butler, C. D. (2024) · Elsevier eBooks · doi:10.1016/b978-0-443-18515-1.00007-1 · Cited by 6
Positive feedback to regional climate enhances African wildfires
Zhang, A., Wang, Y., & Zou, Y. (2023) · iScience · doi:10.1016/j.isci.2023.108533 · Cited by 4
Unprecedented Amazonian rainforests damage during the 2023–2024 droughts
Bai, H., Liu, X., Yang, H., Chave, J., Ciais, P., Wigneron, J., Saatchi, S. S., Xiao, J., Toan, T. L., Hu, X., et al. (2026) · Proceedings of the National Academy of Sciences · doi:10.1073/pnas.2514066123 · Cited by 7
Self-citationPalácios, R. D. S., de Paulo, S. R., de Paulo, I. J. C., Lobo, F. D. A., Maionchi, D., da Silva, H. J. A., da Silva, I. M. C. B., Marques, J. B., Bíudes, M. S., Dalmagro, H. J., et al. (2023) · Forests · doi:10.3390/f14081543 · Cited by 5
de Oliveira, G. L., & de Oliveira, A. C. M. (2023) · Springer eBooks · doi:10.1007/978-3-031-43071-8_17 · Cited by 4
Gallerani, E. M., Fortini, L. B., Warren, C. C., & Paxton, E. H. (2024) · Remote Sensing · doi:10.3390/rs16040680 · Cited by 4
Rigatti, E., McDermid, S., Cook, B. I., & Kauwe, M. G. D. (2024) · Journal of Geophysical Research Biogeosciences · doi:10.1029/2024jg008143 · Cited by 4
Xu, R., Qiu, Q., Nong, J., Fan, S., & Liu, G. (2023) · Forests · doi:10.3390/f14030522 · Cited by 3
Analysis and prediction of carbon storage changes on the Qinghai-Tibet Plateau
Wang, L., Zhang, Y., & Chen, X. (2025) · PLoS ONE · doi:10.1371/journal.pone.0320090 · Cited by 2
Pantanal wetland wildfires are associated with drought in interconnected biomes
de Sousa, B. R., Fonseca, H. P., Arévalo, S. M. M., Lorenzon, A. S., Torres, F. T. P., & do Amaral, C. H. (2025) · Natural Hazards · doi:10.1007/s11069-025-07446-2 · Cited by 2
Zhang, Y., Jiang, F., Zhou, Y., Dong, G., Wu, D., He, W., Wang, J., Wu, M., Wang, H., Zhang, L., et al. (2026) · Agricultural and Forest Meteorology · doi:10.1016/j.agrformet.2026.111060 · Cited by 2
Wu, Y., Rademacher, T., Liu, H., Manzanedo, R. D., Liang, B., Yu, S., Guo, Z., Du, M., & Zhang, X. (2026) · Journal of Forestry Research · doi:10.1007/s11676-026-02020-3 · Cited by 2
Ancient fires enhance Amazon forest drought resistance
Vedovato, L. B., Carvalho, L. C. D. S., Aragão, L. E. O. C., Bird, M. I., Phillips, O. L., Alvarez, P., Barlow, J., Bartholomew, D. C., Berenguer, É., Castro, W., et al. (2023) · Frontiers in Forests and Global Change · doi:10.3389/ffgc.2023.1024101 · Cited by 2
Improving Inferences about Exoplanet Habitability
Perera, R. D., & Knuth, K. H. (2023) · International Workshop on Bayesian Inference and Maximum Entropy Methods in Science and Engineering (MaxEnt) · doi:10.3390/psf2023009007 · Cited by 3
Moorthy, S. M. K., Meunier, F., Calders, K., Aguilar, A. G., Pausenberger, N., Schnitzer, S. A., Visser, M. D., Muller‐Landau, H. C., & Verbeeck, H. (2022) · Research Square · doi:10.21203/rs.3.rs-2094059/v1 · Cited by 4
Amazon deforestation, already rising, may spike under Bolsonaro
Walker, R. T. (2019) · doi:10.64628/aai.wvpcvnmaq · Cited by 2
Short-term recovery of fine root carbon stock is inhibited by skid trails in a humid tropical forest
DeArmond, D., de Freitas, S. F., Lima, A., & Higuchi, N. (2025) · iForest - Biogeosciences and Forestry · doi:10.3832/ifor4756-018 · Cited by 1
Suárez, J. C., López, C. J., & Rodríguez, W. (2026) · Agroforestry Systems · doi:10.1007/s10457-025-01397-0 · Cited by 1
Hauck, M., Leuschner, C., & Homeier, J. (2019) · Springer eBooks · doi:10.1007/978-3-662-59791-0_10 · Cited by 1
Vieira, L. C. D. S., Queiroz, G. R., & Shiguemori, E. H. (2022) · The international archives of the photogrammetry, remote sensing and spatial information sciences/International archives of the photogrammetry, remote sensing and spatial information sciences · doi:10.5194/isprs-archives-xliii-b3-2022-721-2022 · Cited by 1
Tropical ecosystem greenhouse gas accounting
Ometto, J. P., Pacheco, F. S., Almeida, M., Basso, L. S., Bezerra, F. G., Cardoso, M., Miranda, M. A. C. N., Neto, E. S., von Randow, C., Rezende, L. F. C., et al. (2022) · Elsevier eBooks · doi:10.1016/b978-0-12-814952-2.00013-7 · Cited by 1
(2021) · Biogeosciences · doi:10.5194/bg-2021-37-rc1
Authors' Response to Referee 1
Winkler, A. J. (2021) · Biogeosciences · doi:10.5194/bg-2021-37-ac1
Brum, M., SALESKA, S. R., Alves, L. F., Penha, D., Ivanov, V. Y., Restrepo‐Coupé, N., Albert, L. P., de Oliveira, R. C., de Moura, J. M. S., Mião, S., et al. (2021) · doi:10.22541/au.161662321.19984685/v1
(2021) · Biogeosciences · doi:10.5194/bg-2021-37-rc2
Authors’ Response to Community Comment 1
Winkler, A. J. (2021) · Biogeosciences · doi:10.5194/bg-2021-37-ac3
Authors' Response to Referee 2
Winkler, A. J. (2021) · Biogeosciences · doi:10.5194/bg-2021-37-ac2
COVID-19 y exploración económica de la Amazonía brasileña
Menezes, D. F. N. (2021) · Mundo Amazónico · doi:10.15446/ma.v12n2.88473
(2021) · Biogeosciences · doi:10.5194/bg-2021-37-cc1
Smallman, T. L. (2021) · Earth System Dynamics · doi:10.5194/esd-2021-17-ac2
Smallman, T. L. (2021) · Earth System Dynamics · doi:10.5194/esd-2021-17-ac1
(2022) · Geoscientific model development · doi:10.5194/gmd-2021-362-rc1
(2022) · Geoscientific model development · doi:10.5194/gmd-2021-362-rc2
Yao, Y. (2022) · Geoscientific model development · doi:10.5194/gmd-2021-362-ac2
Yao, Y. (2022) · Geoscientific model development · doi:10.5194/gmd-2021-362-ac1
Multi-fold increase in rainforests tipping risk beyond 1.5-2⁰C warmingPreprint
Singh, C., van der Ent, R., Fetzer, I., & Wang‐Erlandsson, L. (2022) · doi:10.31223/x5nh1v
Sun, X., Xiao, Y., Wang, Y., Zhou, M., Ma, M., & Han, X. (2023) · Research Square · doi:10.21203/rs.3.rs-2824753/v1
Joshi, J., Hofhansl, F., Singh, S., Stocker, B. D., Brännström, Å., Franklin, O., Blanco, C. C., Aleixo, I. F., Lapola, D. M., Prentice, I. C., et al. (2023) · bioRxiv (Cold Spring Harbor Laboratory) · doi:10.1101/2023.07.03.547575
Terrestrial carbon cycle processes
Rackley, S. (2023) · Elsevier eBooks · doi:10.1016/b978-0-12-819663-2.00013-7 · Cited by 1
Martin, P. A., Fisher, L., Pérez‐Izquierdo, L., Biryol, C., Guenet, B., Luyssaert, S., Manzoni, S., Ménival, C., Santonja, M., Spake, R., et al. (2024) · doi:10.32942/x2xs5t
Singh, C. (2024) · doi:10.5194/egusphere-2023-1486-ac2
Rising Temperature Prolongs the Response Time of Lai and Gpp to Meteorological DroughtPreprint
Wang, Y., Sun, P., Yao, R., & Ge, C. (2024) · SSRN Electronic Journal · doi:10.2139/ssrn.4823080
Abiotic Stress Reduction with Molecular and Physiological Approaches in Trees
Sobhanan, A., Kavya, Meena, R. K., & MISHRA, G. P. (2025) · Springer eBooks · doi:10.1007/978-981-96-0002-1_17
Li, A., Kato, T., Li, H., Nguyen, L. D., Hayashi, M., Avtar, R., & Nakaji, T. (2025) · SSRN Electronic Journal · doi:10.2139/ssrn.5399964
Gong, E., Zhang, J., Wang, Z., Bai, H., & Wang, J. (2025) · Journal of Hydrology Regional Studies · doi:10.1016/j.ejrh.2025.102869
Patil, R. J., Wei, Y., & Shulmeister, J. (2025) · Environmental Research Letters · doi:10.1088/1748-9326/ae1e16
Predicting the fate of tropical forests under intensifying heat
Anderson‐Teixeira, K. J., & Anujan, K. (2026) · Nature · doi:10.1038/d41586-025-04093-2
Guo, K., Zhang, T., Yu, S., Tian, L., Guo, D., & Liu, K. (2026) · Trees · doi:10.1007/s00468-026-02752-z
Relationship and feedback between LULC changes and hydroclimatic variability in Amazonia
Gutierrez‐Cori, O. (2024) · theses.fr (ABES) · doi:10.70675/c0b27205zdad9z4c2azaf24z18aabd10eb56
Xu, B., Dang, T., & Wu, X. (2026) · GIScience & Remote Sensing · doi:10.1080/15481603.2026.2658313
Shi, H., Gao, R., Huang, Y., Zhao, W., Hu, Z. W., Maeyer, P. D., de Voorde, T. V., & Luo, G. (2026) · Research Square · doi:10.21203/rs.3.rs-9953692/v1
Sublethal tree health conditions suppress tree growth across eastern US forests
Rocha, K. D., Magee, L. J., Cayetano, D. T., Bowers, D. A., Anderson‐Teixeira, K. J., McMahon, S. M., Shue, J., Orwig, D. A., Bohlman, S., Vogel, J. G., et al. (2026) · Forest Ecology and Management · doi:10.1016/j.foreco.2026.124157
Gao, F., 何冰, Liu, K., Waheed, A., & Gao, F. (2026) · Regional Environmental Change · doi:10.1007/s10113-026-02637-4
Drought stress on the global vegetation carbon sink: Capacity decline in nearly 70% of regions
Wen-Li, L. I. U., XIANG, L.-G., Le, M. A., ZHANG, X., & Shu-zhe, H. (2026) · Advances in Climate Change Research · doi:10.1016/j.accre.2026.07.020
Howell, S. R., Doley, D., McDonald, W. J. F., Radford‐Smith, J., & Dwyer, J. M. (2026) · Forest Ecology and Management · doi:10.1016/j.foreco.2026.124248
Metadata
- Authors
- Yang, Y., Saatchi, S. S., Xu, L., Yu, Y., Choi, S., Phillips, N., Kennedy, R., Keller, M., Knyazikhin, Y., & Myneni, R. B.
- Affiliations
- Boston University (US)
- Jet Propulsion Laboratory (US)
- Oregon State University (US)
- US Forest Service (US)
- Corresponding author
- Yang, Yan
- ORCID
- Venue
- Nature Communications
- Published
- 2018-08-09
- Volume
- 9
- Issue
- 1
- Pages
- 3172-3172
- ISSN
- 2041-1723 (ISSN-L)
- PMC
- PMC6085357
- OpenAlex
- W2887158854
- Cited by
- 189
- References
- 80
- Citations by year
- 2026: 12 · 2025: 15 · 2024: 29 · 2023: 25 · 2022: 29 · 2021: 39 · 2020: 23 · 2019: 16 · 2018: 1
- FWCI
- 9.92
- Type
- journal article
- Language
- en
- Open access
- gold
- doi.org
- Locations
- Nature Communications (publishedVersion, cc-by)
- Europe PMC (PubMed Central) (publishedVersion, other-oa)
- PubMed Central (publishedVersion, cc-by)
- PubMed (publishedVersion)
- OpenBU (Boston University) (publishedVersion, cc-by)
- RePEc: Research Papers in Economics (submittedVersion)
- DOAJ (DOAJ: Directory of Open Access Journals) (submittedVersion, cc-by-sa)
- DOAJ (DOAJ: Directory of Open Access Journals) (submittedVersion)
- Funders
- National Science Foundation
- National Aeronautics and Space Administration
- California Institute of Technology
- U.S. Geological Survey
- Jet Propulsion Laboratory
- Topics
- Life Sciences › Agricultural and Biological Sciences › Forestry › Remote Sensing and LiDAR Applications
- Physical Sciences › Environmental Science › Global and Planetary Change › Plant Water Relations and Carbon Dynamics
- Life Sciences › Agricultural and Biological Sciences › Forestry › Forest ecology and management
- Keywords
- Amazon drought, forest carbon loss, aboveground biomass, forest structure, climate feedbacks, forest carbon dynamics, Amazon basin
About these checks
Registry, retraction, Cites and statistics results are computed, not judged, with one exception: a printed reference that no index lists is read once by a model before it counts as a citation error. Claims are extracted by a model and kept only when their quote appears verbatim in the text; each cited source is then checked, with a model’s help, for whether it says what the claim relies on. Those verdicts can be wrong — read the claim’s quote and the cited source before relying on one.
Statistics and arithmetic are recomputed, not judged.
Confidence bands are shown only for fields calibrated on our annotated test set. None is calibrated yet, so no band is shown.
What counts as a claim ›How we measure confidence ›How we check this ›
Are you an author, or do you see a problem with this page? Request a review
