Cited by 180Cancer Cells and MetastasisBreast Cancer Treatment StudiesPI3K/AKT/mTOR signaling in cancer

The DOI matches its Crossref record; 75 of the 75 references it cites were found in a registry or an index.

Differentiation-state plasticity is a targetable resistance mechanism in basal-like breast cancer

Open access

Abstract

Intratumoral heterogeneity in cancers arises from genomic instability and epigenomic plasticity and is associated with resistance to cytotoxic and targeted therapies. We show here that cell-state heterogeneity, defined by differentiation-state marker expression, is high in triple-negative and basal-like breast cancer subtypes, and that drug tolerant persister (DTP) cell populations with altered marker expression emerge during treatment with a wide range of pathway-targeted therapeutic compounds. We show that MEK and PI3K/mTOR inhibitor-driven DTP states arise through distinct cell-state transitions rather than by Darwinian selection of preexisting subpopulations, and that these transitions involve dynamic remodeling of open chromatin architecture. Increased activity of many chromatin modifier enzymes, including BRD4, is observed in DTP cells. Co-treatment with the PI3K/mTOR inhibitor BEZ235 and the BET inhibitor JQ1 prevents changes to the open chromatin architecture, inhibits the acquisition of a DTP state, and results in robust cell death in vitro and xenograft regression in vivo.

Overview

The claims and statistics of this paper haven’t been checked yet.

Run the check — free, no account needed. It reads the open-access text and checks the sources it cites.

A few free checks a day · papers already verified open instantly · results are public

Integrity signals

Registry

Crossref · 10.1038/s41467-018-05729-w

Cites

75 of 75 references verified0 citation errors · 0 not checkable

Statistics

Figures

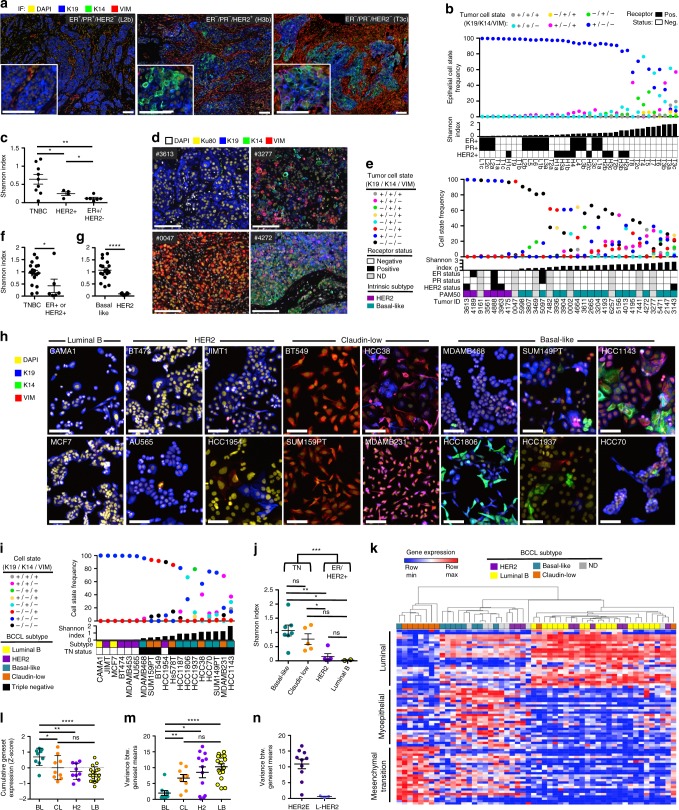
Fig. 1 Differentiation-state heterogeneity is enriched in the triple negative and basal-like subtypes. a Representative IF images of treatment-naïve primary breast cancers: “luminal” (ER+/PR+/HER2−), HER2+ (ER+/−/PR−/HER2+), and triple negative (ER−/PR−/HER2−), scale bars = 100 μm. b The frequency of six epithelial cell states is shown for each tumor region in a vertical scatterplot with accompanying Shannon diversity index and ER, PR, and HER2 status. Luminal (L), HER2+ (H), and TN (T) tumor regions are arranged left to right by increasing Shannon index, regions of the same tumor denoted by “a, b, c” e.g., L2a, L2b, L2c. c Graph comparing Shannon index between tumors of different hormone receptor subtype (multiple regions of individual tumors are averaged if available), asterisks denote significance *P < 0.05, **P < 0.01. SEM shown. d IF images of PDX tumors with low (left panels) and high (right panels) Shannon indices stained for DAPI (white), Ku80 (yellow), K19 (blue), K14 (green) and VIM (red), scale bars = 100 μm. e The frequency of eight tumor cell states based on K19, K14, and VIM expression is shown for 31 PDX tumors in a vertical scatterplot with accompanying Shannon index. Patient ER, PR, and HER2-receptor status and intrinsic molecular subtype is shown. Tumors arranged left to right by increasing Shannon index. f, g Graphs of Shannon index, comparing tumors with differing receptor-positivity status and molecular subtype. *P < 0.05, ****P < 0.0001. SEM shown. h IF images of BCCLs with differing molecular subtypes, scale bars = 100 μm. i The frequency of eight cell states based on K19, K14, and VIM expression is shown for each BCCL in a vertical scatterplot with accompanying Shannon index, molecular subtype and Triple negative (TN) status is indicated (denoted by color, marked by black squares). Cell lines are arranged left to right by increasing Shannon index. j Graph of Shannon index, comparing TN and non-TN BCCLs, as well as different molecular subtypes. *P < 0.05, **P < 0.01, ***P < 0.001, ns = not significant, SEM shown. k Heatmap of BCCL gene expression of 25 luminal, 25 myoepithelial, and 25 EMT-correlated genes. BCCLs are arranged by unsupervised clustering. Cell line molecular subtype is denoted by color. l Graph of the cumulative Z-score of the luminal, myoepithelial, and EMT genesets in BCCLs of different molecular subtype, basal-like (BL), claudin-low (CL), HER2+ (H2), and Luminal B (LB), *P < 0.05, **P < 0.01, ****P < 0.0001, ns = not significant, SEM shown. m Graph of the variance between the mean geneset expression of the luminal, myoepithelial, and EMT genesets in BCCLs of different molecular subtype, asterisks denote significant difference in geneset variance, SEM shown. n Graph of the variance between HER2+ cell lines that are either of the L-HER2 or HER2E molecular subtypes
Fig. 1 Differentiation-state heterogeneity is enriched in the triple negative and basal-like subtypes. a Representative IF images of treatment-naïve primary breast cancers: “luminal” (ER+/PR+/HER2−), HER2+ (ER+/−/PR−/HER2+), and triple negative (ER−/PR−/HER2−), scale bars = 100 μm. b The frequency of six epithelial cell states is shown for each tumor region in a vertical scatterplot with accompanying Shannon diversity index and ER, PR, and HER2 status. Luminal (L), HER2+ (H), and TN (T) tumor regions are arranged left to right by increasing Shannon index, regions of the same tumor denoted by “a, b, c” e.g., L2a, L2b, L2c. c Graph comparing Shannon index between tumors of different hormone receptor subtype (multiple regions of individual tumors are averaged if available), asterisks denote significance *P < 0.05, **P < 0.01. SEM shown. d IF images of PDX tumors with low (left panels) and high (right panels) Shannon indices stained for DAPI (white), Ku80 (yellow), K19 (blue), K14 (green) and VIM (red), scale bars = 100 μm. e The frequency of eight tumor cell states based on K19, K14, and VIM expression is shown for 31 PDX tumors in a vertical scatterplot with accompanying Shannon index. Patient ER, PR, and HER2-receptor status and intrinsic molecular subtype is shown. Tumors arranged left to right by increasing Shannon index. f, g Graphs of Shannon index, comparing tumors with differing receptor-positivity status and molecular subtype. *P < 0.05, ****P < 0.0001. SEM shown. h IF images of BCCLs with differing molecular subtypes, scale bars = 100 μm. i The frequency of eight cell states based on K19, K14, and VIM expression is shown for each BCCL in a vertical scatterplot with accompanying Shannon index, molecular subtype and Triple negative (TN) status is indicated (denoted by color, marked by black squares). Cell lines are arranged left to right by increasing Shannon index. j Graph of Shannon index, comparing TN and non-TN BCCLs, as well as different molecular subtypes. *P < 0.05, **P < 0.01, ***P < 0.001, ns = not significant, SEM shown. k Heatmap of BCCL gene expression of 25 luminal, 25 myoepithelial, and 25 EMT-correlated genes. BCCLs are arranged by unsupervised clustering. Cell line molecular subtype is denoted by color. l Graph of the cumulative Z-score of the luminal, myoepithelial, and EMT genesets in BCCLs of different molecular subtype, basal-like (BL), claudin-low (CL), HER2+ (H2), and Luminal B (LB), *P < 0.05, **P < 0.01, ****P < 0.0001, ns = not significant, SEM shown. m Graph of the variance between the mean geneset expression of the luminal, myoepithelial, and EMT genesets in BCCLs of different molecular subtype, asterisks denote significant difference in geneset variance, SEM shown. n Graph of the variance between HER2+ cell lines that are either of the L-HER2 or HER2E molecular subtypesCC BY · PubMed Central
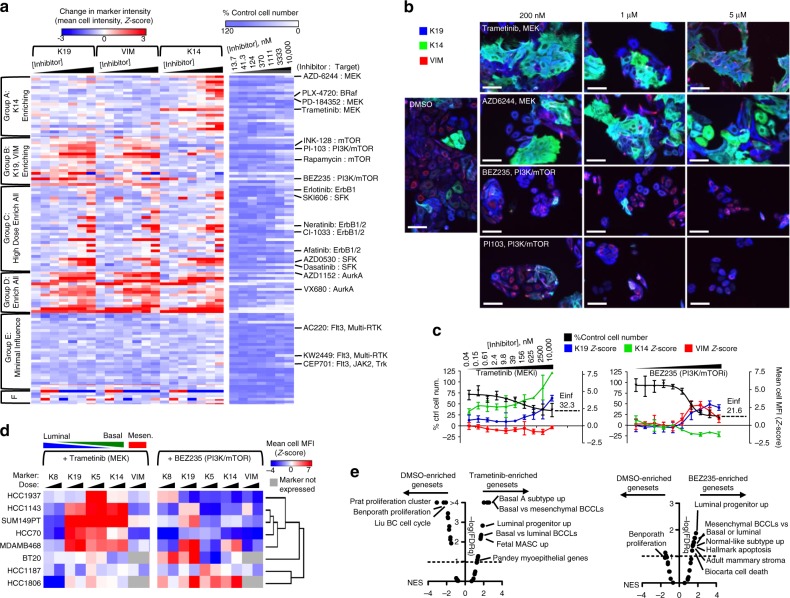
Fig. 2 Targeted therapies enrich distinct drug-persisting differentiation states. a Heatmaps show the change in K19, VIM, and K14 expression compared to DMSO control wells as a Z-score (left), and change in proliferation (right, percent of control) of HCC1143 cells following 72 h exposure to seven doses of 119 targeted therapeutics. K-means clustering on differentiation marker expression shows six distinct clusters. Select drugs from each cluster and their primary therapeutics target(s) are labeled to the right. A full list of drugs and responses is in Supplementary Dataset 2. b IF images of HCC1143 cells following 72 h treatment with increasing doses of MEK inhibitors Trametinib and AZD6244 and the PI3K/mTOR inhibitors BEZ235 and PI103, or a DMSO control, showing K19 (blue), K14 (green), and VIM (red), scale bars = 100 μm. c Graphs of therapy-induced changes in cell number (black, left axis) and mean-cell MFI (right axis, as Z-score) of K19 (blue), VIM (red), and K14 (green), in HCC1143 cells following 72 h incubation with increasing doses of Trametinib or BEZ235. The projected maximum level of inhibition, or Einf, is shown for each drug. d Heatmaps of the change in mean-cell MFI (Z-Score) for K8, K19, K5, K14, and VIM is shown for eight basal-like BCCLs following 72 h incubation with 250 or 2500 nM Trametinib (left) or BEZ235 (right). Unsupervised clustering, using data from both agents, was used to group cell lines based on phenotypic response. Markers for luminal, basal, and mesenchymal phenotype are indicated. e GSEA results as a volcano plot of Normalized Enrichment Score (NES, x-axis) vs. FDRq (−log, y-axis) examining 32 genesets related to mammary cell states and breast cancer subtypes, enrichment compared between DMSO and 1 μM Trametinib (left), or DMSO and 1 μM BEZ235 (right) in HCC1143 cells treated for 6 days. Select top-enriched genesets are labeled
Fig. 2 Targeted therapies enrich distinct drug-persisting differentiation states. a Heatmaps show the change in K19, VIM, and K14 expression compared to DMSO control wells as a Z-score (left), and change in proliferation (right, percent of control) of HCC1143 cells following 72 h exposure to seven doses of 119 targeted therapeutics. K-means clustering on differentiation marker expression shows six distinct clusters. Select drugs from each cluster and their primary therapeutics target(s) are labeled to the right. A full list of drugs and responses is in Supplementary Dataset 2. b IF images of HCC1143 cells following 72 h treatment with increasing doses of MEK inhibitors Trametinib and AZD6244 and the PI3K/mTOR inhibitors BEZ235 and PI103, or a DMSO control, showing K19 (blue), K14 (green), and VIM (red), scale bars = 100 μm. c Graphs of therapy-induced changes in cell number (black, left axis) and mean-cell MFI (right axis, as Z-score) of K19 (blue), VIM (red), and K14 (green), in HCC1143 cells following 72 h incubation with increasing doses of Trametinib or BEZ235. The projected maximum level of inhibition, or Einf, is shown for each drug. d Heatmaps of the change in mean-cell MFI (Z-Score) for K8, K19, K5, K14, and VIM is shown for eight basal-like BCCLs following 72 h incubation with 250 or 2500 nM Trametinib (left) or BEZ235 (right). Unsupervised clustering, using data from both agents, was used to group cell lines based on phenotypic response. Markers for luminal, basal, and mesenchymal phenotype are indicated. e GSEA results as a volcano plot of Normalized Enrichment Score (NES, x-axis) vs. FDRq (−log, y-axis) examining 32 genesets related to mammary cell states and breast cancer subtypes, enrichment compared between DMSO and 1 μM Trametinib (left), or DMSO and 1 μM BEZ235 (right) in HCC1143 cells treated for 6 days. Select top-enriched genesets are labeledCC BY · PubMed Central
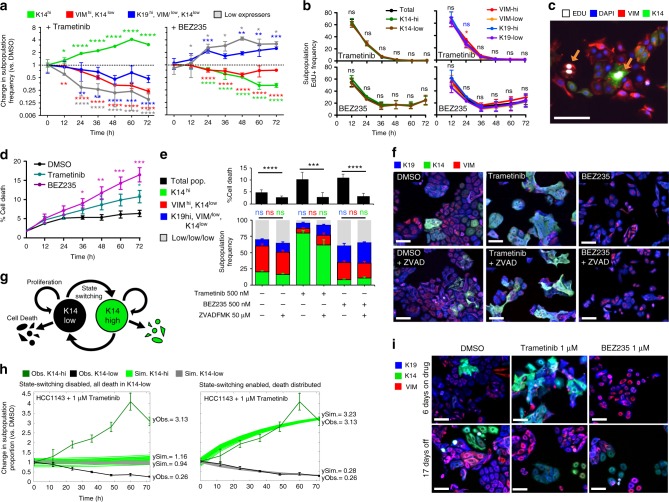
Fig. 3 Cell state transitions underlie DTP-state enrichment. a Graphs showing change in frequency (vs. DMSO) of four differentiation states defined as K14hi (green), VIMhi/K14low (red), K19hi/VIMlow/K14low (blue), and K19low/VIMlow/K14low (gray) following exposure to 1 μM Trametinib or BEZ235. Asterisks depict significant gains or losses in state frequency vs. 0 h, *P < 0.05, **P < 0.01, ***P < 0.001, ****P < 0.001, n = 15 with SD. b Graphs showing percent of EdU+ cells expressing high or low levels of K14, K19, or VIM following treatment with 1 μM Trametinib or BEZ235, ns = not significant, SEM shown. c IF image showing both K14hi and K14low cells positive for EdU-incorporation following 36 h of Trametinib treatment, scale bar = 100 μm. d Graph showing percent of YO-PRO-1+ dying cells following treatment with 1 μM Trametinib or BEZ235, n = 8 with SEM. e Graphs showing the percent of dying cells (top) and the frequency of cells in four differentiation states (bottom, defined and colored as in (a)) following 72 h exposure to Trametinib, BEZ235, or DMSO +/− the pan-caspase inhibitor Z-VAD-FMK. No significant (ns) differences observed in differentiation-state frequency +/− Z-VAD-FMK, n = 12 with SD. f IF images of remaining HCC1143 cells in (e) following 72 h exposure to Trametinib, BEZ235 or DMSO +/− Z-VAD-FMK. Scale bars = 100 μm. g Schematic of cell-state behavior where cells can transition between K14hi and K14low cell states and undergo death or proliferate in either state. h Simulated fold change of K14hi (bright green) and K14low (gray) cell-state proportions over 72 h following treatment with 1 μM Trametinib (vs. DMSO) are overlaid with experimentally observed average fold change (vs. DMSO) of K14hi (dark green) and K14low (black) cell-state proportions. ySim denotes simulated endpoint values; yObs denotes observed endpoint values. Two simulations with different cell-switching and cell death parameters shown: K14hi Darwinian selection (left, Trametinib kills only K14low cells, and cell-state transition is inhibited) and Transition-mediated (right, Trametinib kills K14low and K14hi cells in equal proportions, cell-state transition is allowed). i IF images of HCC1143 cells following 6 days of 1 μM Trametinib or 1 μM BEZ235, then following 17 days of culture without drug. scale bars = 100 μm
Fig. 3 Cell state transitions underlie DTP-state enrichment. a Graphs showing change in frequency (vs. DMSO) of four differentiation states defined as K14hi (green), VIMhi/K14low (red), K19hi/VIMlow/K14low (blue), and K19low/VIMlow/K14low (gray) following exposure to 1 μM Trametinib or BEZ235. Asterisks depict significant gains or losses in state frequency vs. 0 h, *P < 0.05, **P < 0.01, ***P < 0.001, ****P < 0.001, n = 15 with SD. b Graphs showing percent of EdU+ cells expressing high or low levels of K14, K19, or VIM following treatment with 1 μM Trametinib or BEZ235, ns = not significant, SEM shown. c IF image showing both K14hi and K14low cells positive for EdU-incorporation following 36 h of Trametinib treatment, scale bar = 100 μm. d Graph showing percent of YO-PRO-1+ dying cells following treatment with 1 μM Trametinib or BEZ235, n = 8 with SEM. e Graphs showing the percent of dying cells (top) and the frequency of cells in four differentiation states (bottom, defined and colored as in (a)) following 72 h exposure to Trametinib, BEZ235, or DMSO +/− the pan-caspase inhibitor Z-VAD-FMK. No significant (ns) differences observed in differentiation-state frequency +/− Z-VAD-FMK, n = 12 with SD. f IF images of remaining HCC1143 cells in (e) following 72 h exposure to Trametinib, BEZ235 or DMSO +/− Z-VAD-FMK. Scale bars = 100 μm. g Schematic of cell-state behavior where cells can transition between K14hi and K14low cell states and undergo death or proliferate in either state. h Simulated fold change of K14hi (bright green) and K14low (gray) cell-state proportions over 72 h following treatment with 1 μM Trametinib (vs. DMSO) are overlaid with experimentally observed average fold change (vs. DMSO) of K14hi (dark green) and K14low (black) cell-state proportions. ySim denotes simulated endpoint values; yObs denotes observed endpoint values. Two simulations with different cell-switching and cell death parameters shown: K14hi Darwinian selection (left, Trametinib kills only K14low cells, and cell-state transition is inhibited) and Transition-mediated (right, Trametinib kills K14low and K14hi cells in equal proportions, cell-state transition is allowed). i IF images of HCC1143 cells following 6 days of 1 μM Trametinib or 1 μM BEZ235, then following 17 days of culture without drug. scale bars = 100 μmCC BY · PubMed Central
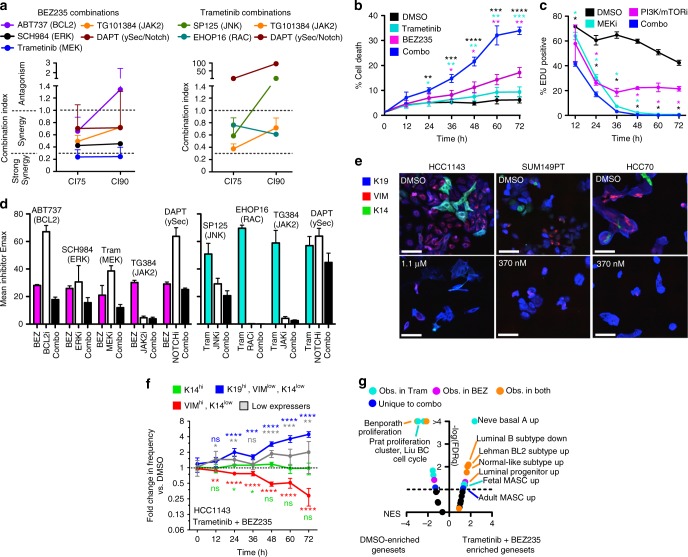
Fig. 4 Drug combinations targeting DTP-enriched pathways still leave persisting cells of distinct identity. a Graphs of combination indices (CI) from drug combinations including BEZ235 (left) or Trametinib (right) and agents targeting upregulated pathway regulators in DTP states identified by VIPER analysis. CIs were calculated at 75% (CI75), and 90% (CI90) dose inhibitory values from replicate colorimetric proliferation assays, n = 3 with SEM. b Graph showing the percent of YO-PRO-1+ dying cells in HCC1143 cells following the addition of 1 μM BEZ235, 1 μM Trametinib, the combination of the two drugs, or a DMSO control. Asterisks denote significant gains in percent cell death in combination-treated cells, *P < 0.05, **P < 0.01, ***P < 0.001, ****P < 0.001, n = 4 with SEM. c Graphs show the percent of EDU+ HCC1143 cells following treatment with 1 μM Trametinib, 1 μM BEZ235, a combination of agents, or DMSO control. Asterisks denote significant reduction in %EdU+ in combination-treated cells, n = 4 with SD. d Graphs compare the maximal inhibition (Emax, as % control proliferation) for single agent BEZ235, Trametinib, the agents from (a), or combinations thereof. n = 3 with SEM. e IF images of three basal-like cell lines before and after 72 h exposure to the indicated doses of BEZ235 + Trametinib, DAPI not shown, scale bars = 100 μm. f Graphs show the fold change in frequency (vs. DMSO) of four differentiation states in HCC1143, as in Fig. 3a, b, following addition of 1 μM BEZ235 + 1 μM Trametinib. Asterisks depict significant gains or losses in state frequency vs. 0 h, n = 15 with SD. g GSEA results as a volcano plot of Normalized Enrichment Score (NES, x-axis) vs. FDRq (−log, y-axis) examining 32 genesets related to mammary cell states and breast cancer subtypes, enrichment compared between DMSO and 1 μM Trametinib/BEZ235 combination in HCC1143 cells treated for 6 days. Select top-enriched genesets are labeled
Fig. 4 Drug combinations targeting DTP-enriched pathways still leave persisting cells of distinct identity. a Graphs of combination indices (CI) from drug combinations including BEZ235 (left) or Trametinib (right) and agents targeting upregulated pathway regulators in DTP states identified by VIPER analysis. CIs were calculated at 75% (CI75), and 90% (CI90) dose inhibitory values from replicate colorimetric proliferation assays, n = 3 with SEM. b Graph showing the percent of YO-PRO-1+ dying cells in HCC1143 cells following the addition of 1 μM BEZ235, 1 μM Trametinib, the combination of the two drugs, or a DMSO control. Asterisks denote significant gains in percent cell death in combination-treated cells, *P < 0.05, **P < 0.01, ***P < 0.001, ****P < 0.001, n = 4 with SEM. c Graphs show the percent of EDU+ HCC1143 cells following treatment with 1 μM Trametinib, 1 μM BEZ235, a combination of agents, or DMSO control. Asterisks denote significant reduction in %EdU+ in combination-treated cells, n = 4 with SD. d Graphs compare the maximal inhibition (Emax, as % control proliferation) for single agent BEZ235, Trametinib, the agents from (a), or combinations thereof. n = 3 with SEM. e IF images of three basal-like cell lines before and after 72 h exposure to the indicated doses of BEZ235 + Trametinib, DAPI not shown, scale bars = 100 μm. f Graphs show the fold change in frequency (vs. DMSO) of four differentiation states in HCC1143, as in Fig. 3a, b, following addition of 1 μM BEZ235 + 1 μM Trametinib. Asterisks depict significant gains or losses in state frequency vs. 0 h, n = 15 with SD. g GSEA results as a volcano plot of Normalized Enrichment Score (NES, x-axis) vs. FDRq (−log, y-axis) examining 32 genesets related to mammary cell states and breast cancer subtypes, enrichment compared between DMSO and 1 μM Trametinib/BEZ235 combination in HCC1143 cells treated for 6 days. Select top-enriched genesets are labeledCC BY · PubMed Central
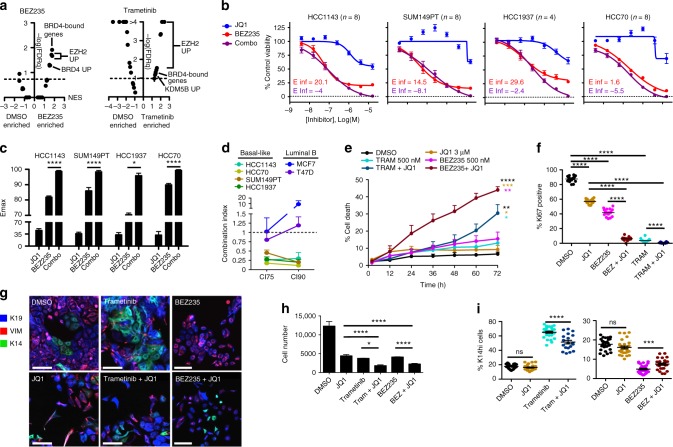
Fig. 5 BET inhibitor combinations improve cell kill and suppress DTP transition. a GSEA results as a volcano plot of Normalized Enrichment Score (NES, x-axis) vs. FDRq (−log, y-axis) examining 25 chromatin modifier enzyme activity-related genesets, enrichment compared between DMSO and 1 μM BEZ235 (left), or DMSO and 1 μM Trametinib (right) in HCC1143 cells treated for 6 days. Select top-enriched genesets are labeled. b Dose–response curves show the efficacy of BEZ235 alone (red), JQ1 alone (blue), or a combination of the two agents (purple, equimolar ratio) in four basal-like cell lines using a colorimetric proliferation assay. E-infinity (Einf) values of single agent BEZ235 (red) and BEZ235 + JQ1 (purple) are displayed. n = 4–8 with SEM. c Maximal inhibition (Emax) by the agents shown in (b) is displayed for each basal-like cell line, asterisks depict significant gains in Emax with JQ1 + BEZ235 compared to BEZ235 alone, *P < 0.05, **P < 0.01, ***P < 0.001, ****P < 0.0001. d Graph showing combination indices for the BEZ235 + JQ1 drug combination at 75% (CI75), and 90% (CI90) inhibitory doses for four basal-like and two luminal B BCCLs, n = 5 with SEM. e Graph showing the percent of dying cells (YO-PRO-1+) in HCC1143 following the addition of 1 μM BEZ235, 1 μM Trametinib, 2 μM JQ1, the combinations of these agents, or a DMSO control. Asterisks denote significant gains in percent cell death in combination-treated cells vs. single agent BEZ235 or Trametinib, n = 3 with SEM. f Graph showing the percent of Ki67 positive HCC1143 cells following 72 h of DMSO, 2 μM JQ1, 1 μM Trametinib, 1 μM BEZ235, or combinations with JQ1. Asterisks denote significant difference in Ki67+ frequency, n = 16 with SD. g IF images of HCC1143 cells following 72 h exposure to DMSO, 400 nM BEZ235, 400 nM Trametinib, 8 μM JQ1, or the combination of these agents, scale bars = 100 μm. h, i Graphs show total cell number and the frequency of K14hi cells following the treatments outlined in (e). Asterisks denote significant change in the frequency of K14hi cells, or cell number, n = 27 with SD
Fig. 5 BET inhibitor combinations improve cell kill and suppress DTP transition. a GSEA results as a volcano plot of Normalized Enrichment Score (NES, x-axis) vs. FDRq (−log, y-axis) examining 25 chromatin modifier enzyme activity-related genesets, enrichment compared between DMSO and 1 μM BEZ235 (left), or DMSO and 1 μM Trametinib (right) in HCC1143 cells treated for 6 days. Select top-enriched genesets are labeled. b Dose–response curves show the efficacy of BEZ235 alone (red), JQ1 alone (blue), or a combination of the two agents (purple, equimolar ratio) in four basal-like cell lines using a colorimetric proliferation assay. E-infinity (Einf) values of single agent BEZ235 (red) and BEZ235 + JQ1 (purple) are displayed. n = 4–8 with SEM. c Maximal inhibition (Emax) by the agents shown in (b) is displayed for each basal-like cell line, asterisks depict significant gains in Emax with JQ1 + BEZ235 compared to BEZ235 alone, *P < 0.05, **P < 0.01, ***P < 0.001, ****P < 0.0001. d Graph showing combination indices for the BEZ235 + JQ1 drug combination at 75% (CI75), and 90% (CI90) inhibitory doses for four basal-like and two luminal B BCCLs, n = 5 with SEM. e Graph showing the percent of dying cells (YO-PRO-1+) in HCC1143 following the addition of 1 μM BEZ235, 1 μM Trametinib, 2 μM JQ1, the combinations of these agents, or a DMSO control. Asterisks denote significant gains in percent cell death in combination-treated cells vs. single agent BEZ235 or Trametinib, n = 3 with SEM. f Graph showing the percent of Ki67 positive HCC1143 cells following 72 h of DMSO, 2 μM JQ1, 1 μM Trametinib, 1 μM BEZ235, or combinations with JQ1. Asterisks denote significant difference in Ki67+ frequency, n = 16 with SD. g IF images of HCC1143 cells following 72 h exposure to DMSO, 400 nM BEZ235, 400 nM Trametinib, 8 μM JQ1, or the combination of these agents, scale bars = 100 μm. h, i Graphs show total cell number and the frequency of K14hi cells following the treatments outlined in (e). Asterisks denote significant change in the frequency of K14hi cells, or cell number, n = 27 with SDCC BY · PubMed Central
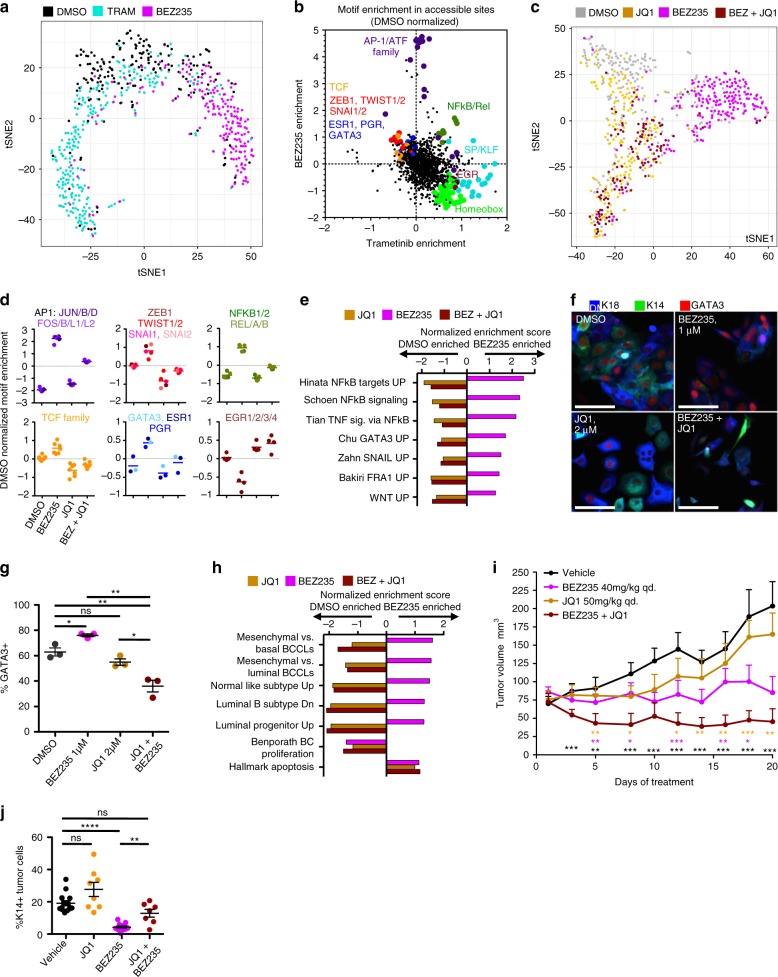
Fig. 6 Changes in open chromatin architecture underlie DTP transition and are inhibited by JQ1. a t-SNE plot of all cells following 72 h of 1 μM BEZ235, 1 μM Trametinib, or a DMSO control in HCC1143, calculated from sciATAC-seq results. Single cells are colored based on treatment, BEZ235 (magenta), Trametinib (cyan), DMSO (gray). b A dot plot showing enriched DNA-binding protein motifs in the open chromatin sites following BEZ235 or Trametinib treatment, normalized to DMSO values. Select related transcription factor motifs are enlarged, colored, and labeled. c t-SNE plot of all cells following 72 h of 1 μM JQ1 (yellow), 1 μM BEZ235 (magenta), JQ1 + BEZ235 (maroon), or a DMSO control (gray), calculated as in (a). d Line graph showing the level of motif-enrichment for six groups of transcription factors is shown for DMSO, BEZ235, JQ1, and JQ1 + BEZ235 treatments. e Graph of GSEA results showing transcription-factor activity-related genesets shown to be significantly enriched (P < 0.05) following 72 h of BEZ235 treatment. The NES in JQ1-treated, and BEZ235 + JQ1-treated cells shown adjacently. f IF images showing K18, K14, and GATA3 expression in HCC1143 cells following 72 h treatment, scale bars = 100 μm. g Graph showing the frequency of GATA3+ cells in HCC1143 following treatment, asterisks depict significant differences in GATA3+ frequency, *P < 0.05, **P < 0.01, ****P < 0.001, n = 3 with SEM. h Graph of GSEA results showing the NES of breast phenotype genesets shown to be significantly enriched (P < 0.05) following 72 h of BEZ235 treatment, with the subsequent NES of that geneset in JQ1-treated, and BEZ235 + JQ1-treated cells shown adjacently. i A graph showing change in tumor volume in HCC70 xenografts treated with vehicle control (black), BEZ235 (red), JQ1 (blue), or BEZ235 + JQ1 (purple). Asterisks denote significant difference in tumor volume between combination-treated tumors and other groups, denoted by color, n = 8 with SEM. j Graph showing the frequency of K14+ human (KU80+) tumor cells in each HCC70 xenograft following treatment with BEZ235, JQ1, the combination of agents, or vehicle control, n = 8 with SEM
Fig. 6 Changes in open chromatin architecture underlie DTP transition and are inhibited by JQ1. a t-SNE plot of all cells following 72 h of 1 μM BEZ235, 1 μM Trametinib, or a DMSO control in HCC1143, calculated from sciATAC-seq results. Single cells are colored based on treatment, BEZ235 (magenta), Trametinib (cyan), DMSO (gray). b A dot plot showing enriched DNA-binding protein motifs in the open chromatin sites following BEZ235 or Trametinib treatment, normalized to DMSO values. Select related transcription factor motifs are enlarged, colored, and labeled. c t-SNE plot of all cells following 72 h of 1 μM JQ1 (yellow), 1 μM BEZ235 (magenta), JQ1 + BEZ235 (maroon), or a DMSO control (gray), calculated as in (a). d Line graph showing the level of motif-enrichment for six groups of transcription factors is shown for DMSO, BEZ235, JQ1, and JQ1 + BEZ235 treatments. e Graph of GSEA results showing transcription-factor activity-related genesets shown to be significantly enriched (P < 0.05) following 72 h of BEZ235 treatment. The NES in JQ1-treated, and BEZ235 + JQ1-treated cells shown adjacently. f IF images showing K18, K14, and GATA3 expression in HCC1143 cells following 72 h treatment, scale bars = 100 μm. g Graph showing the frequency of GATA3+ cells in HCC1143 following treatment, asterisks depict significant differences in GATA3+ frequency, *P < 0.05, **P < 0.01, ****P < 0.001, n = 3 with SEM. h Graph of GSEA results showing the NES of breast phenotype genesets shown to be significantly enriched (P < 0.05) following 72 h of BEZ235 treatment, with the subsequent NES of that geneset in JQ1-treated, and BEZ235 + JQ1-treated cells shown adjacently. i A graph showing change in tumor volume in HCC70 xenografts treated with vehicle control (black), BEZ235 (red), JQ1 (blue), or BEZ235 + JQ1 (purple). Asterisks denote significant difference in tumor volume between combination-treated tumors and other groups, denoted by color, n = 8 with SEM. j Graph showing the frequency of K14+ human (KU80+) tumor cells in each HCC70 xenograft following treatment with BEZ235, JQ1, the combination of agents, or vehicle control, n = 8 with SEMCC BY · PubMed Central

Verification

Claims the paper makes

The claims and statistics of this paper haven’t been checked yet.

Run the check — free, no account needed. It reads the open-access text and checks the sources it cites.

A few free checks a day · papers already verified open instantly · results are public

Claims other papers make about this one

Each is checked against this paper’s own text: does it say what the citing paper says it does?

Self-check

Percentages, sums and reported differences re-computed from the paper’s own numbers.

The self-check needs the paper’s full text.

Citations

Cites

Show all 75 references

Research works printed but not linked: 1

  1. Shannon, C. E. & Weaver, W. The Mathematical Theory of Communication (University of Illinois Press, 1963).

Cited by

Sorted by citations

See all 180

Metadata

Authors
Risom, T., Langer, E. M., Chapman, M. P., Rantala, J., Fields, A. J., Boniface, C., Alvarez, M. J., Kendsersky, N. D., Pelz, C. R., Johnson-Camacho, K., Dobrolecki, L. E., Chin, K., Aswani, A. J., Wang, N. J., Califano, A., Lewis, M. T., Tomlin, C. J., Spellman, P. T., Adey, A., Gray, J. W., & Sears, R. C.
Affiliations
  • Oregon Health & Science University (US)
  • University of California, Berkeley (US)
  • DarwinHealth (United States) (US)
  • Baylor College of Medicine (US)
Corresponding author
  • Gray, Joe W.
  • Sears, Rosalie C.
Venue
Nature Communications
Published
2018-09-19
Volume
9
Issue
1
Pages
3815-3815
ISSN
2041-1723 (ISSN-L)
OpenAlex
W2891378535
Cited by
174
References
75
Citations by year
2026: 8 · 2025: 15 · 2024: 19 · 2023: 30 · 2022: 23 · 2021: 36 · 2020: 21 · 2019: 18 · 2018: 3
FWCI
7.89
Type
journal article
Language
en
Open access
Locations
  • Nature Communications (publishedVersion, cc-by)
  • Europe PMC (PubMed Central) (publishedVersion, other-oa)
  • PubMed Central (publishedVersion, cc-by)
  • PubMed (publishedVersion)
  • RePEc: Research Papers in Economics (submittedVersion)
  • DOAJ (DOAJ: Directory of Open Access Journals) (submittedVersion)
  • DOAJ (DOAJ: Directory of Open Access Journals) (submittedVersion, cc-by-sa)
  • eScholarship (California Digital Library) (submittedVersion)
Funders
  • U.S. Department of Health & Human Services | NIH | National Cancer Institute (5T32GM071338-09, CA209988, CA112970, CA129040, CA100855)
  • U.S. Department of Defense (BC103625)
Topics
  • Health Sciences › Medicine › Oncology › Cancer Cells and Metastasis
  • Life Sciences › Biochemistry, Genetics and Molecular Biology › Cancer Research › Breast Cancer Treatment Studies
  • Life Sciences › Biochemistry, Genetics and Molecular Biology › Molecular Biology › PI3K/AKT/mTOR signaling in cancer
Keywords
basal-like breast cancer, triple-negative breast cancer, drug resistance, intratumoral heterogeneity, drug-tolerant persister cells, cell state transitions, MEK inhibitors, PI3K/mTOR inhibitors, BEZ235, JQ1, BET inhibitors, BRD4, chromatin remodeling, epigenetic plasticity
MeSH terms
Cell Plasticity, Animals, Antineoplastic Agents, Azepines, Breast Neoplasms, Cell Differentiation, Chromatin, Female, Humans, Triazoles, Mice, SCID, Mice, Inbred NOD, Drug Resistance, Neoplasm, Cell Line, Tumor, Molecular Targeted Therapy, Triple Negative Breast Neoplasms

About these checks

Registry, retraction, Cites and statistics results are computed, not judged, with one exception: a printed reference that no index lists is read once by a model before it counts as a citation error. Claims are extracted by a model and kept only when their quote appears verbatim in the text; each cited source is then checked, with a model’s help, for whether it says what the claim relies on. Those verdicts can be wrong — read the claim’s quote and the cited source before relying on one.

Statistics and arithmetic are recomputed, not judged.

Confidence bands are shown only for fields calibrated on our annotated test set. None is calibrated yet, so no band is shown.

What counts as a claim ›How we measure confidence ›How we check this ›

Are you an author, or do you see a problem with this page? Request a review