

The DOI matches its Crossref record; 70 of the 70 references it cites were found in a registry or an index.
Galanin neurons in the ventrolateral preoptic area promote sleep and heat loss in mice
Open accessAbstract
The preoptic area (POA) is necessary for sleep, but the fundamental POA circuits have remained elusive. Previous studies showed that galanin (GAL)- and GABA-producing neurons in the ventrolateral preoptic nucleus (VLPO) express cFos after periods of increased sleep and innervate key wake-promoting regions. Although lesions in this region can produce insomnia, high frequency photostimulation of the POA GAL neurons was shown to paradoxically cause waking, not sleep. Here we report that photostimulation of VLPO GAL neurons in mice promotes sleep with low frequency stimulation (1–4 Hz), but causes conduction block and waking at frequencies above 8 Hz. Further, optogenetic inhibition reduces sleep. Chemogenetic activation of VLPO GAL neurons confirms the increase in sleep, and also reduces body temperature. In addition, chemogenetic activation of VLPO GAL neurons induces short-latency sleep in an animal model of insomnia. Collectively, these findings establish a causal role of VLPO GAL neurons in both sleep induction and heat loss.
Overview
The claims and statistics of this paper haven’t been checked yet.
Run the check — free, no account needed. It reads the open-access text and checks the sources it cites.
Integrity signals
Registry
Cites
Statistics
Figures
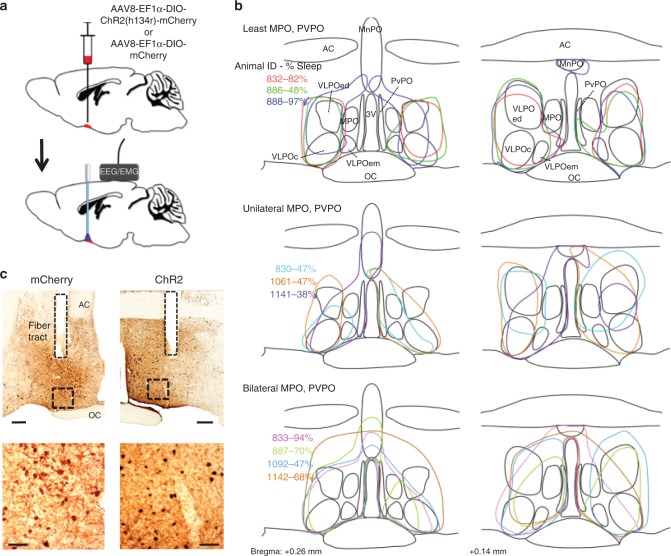
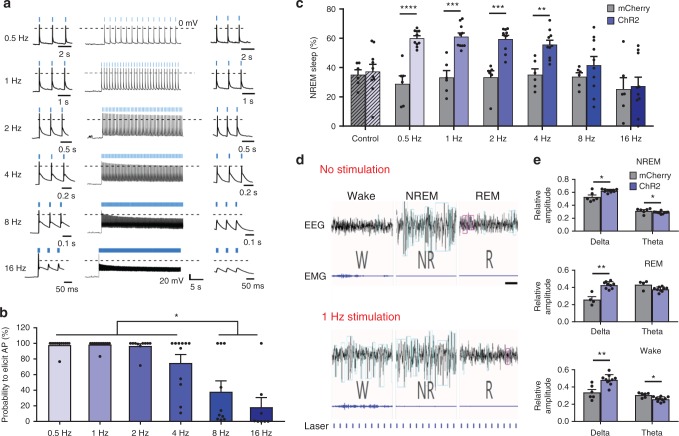
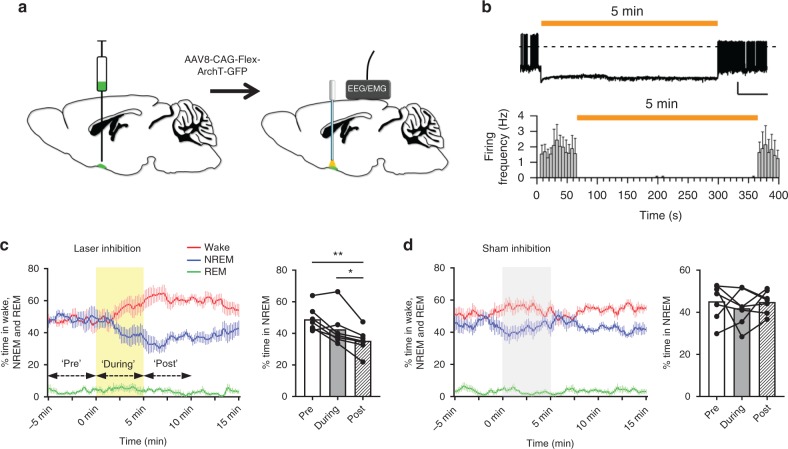
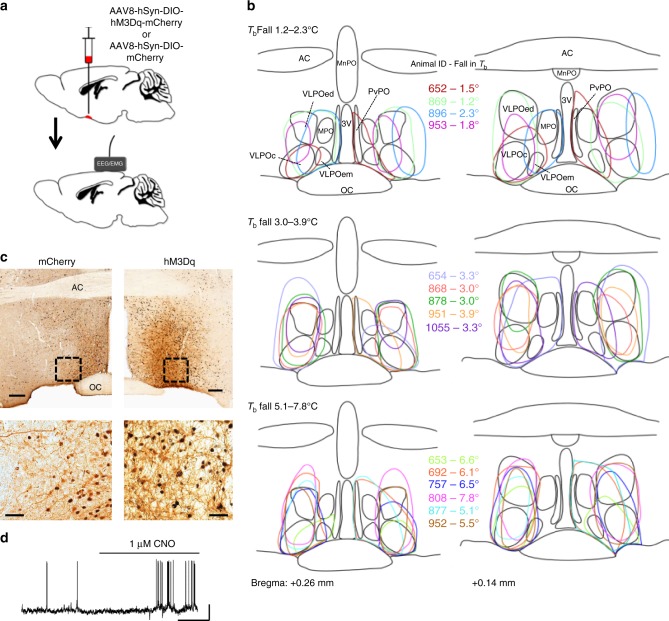
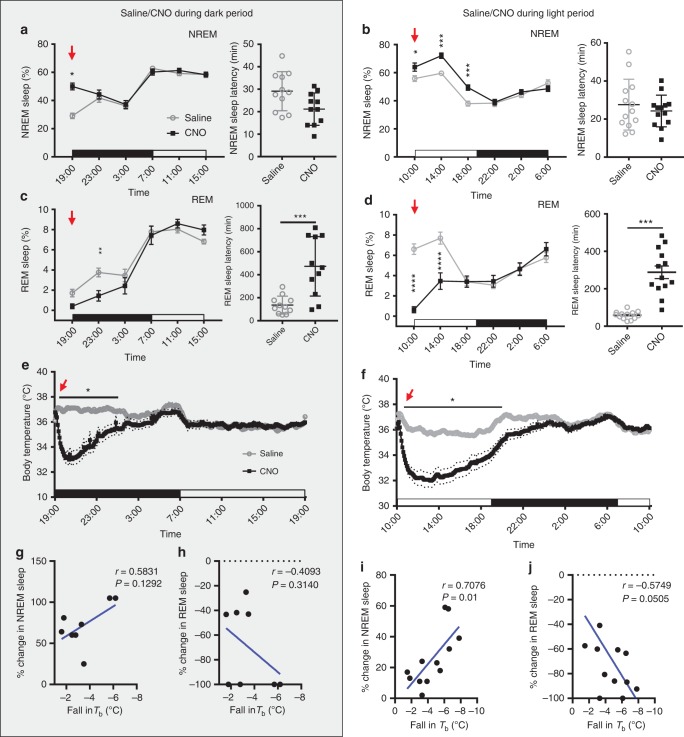
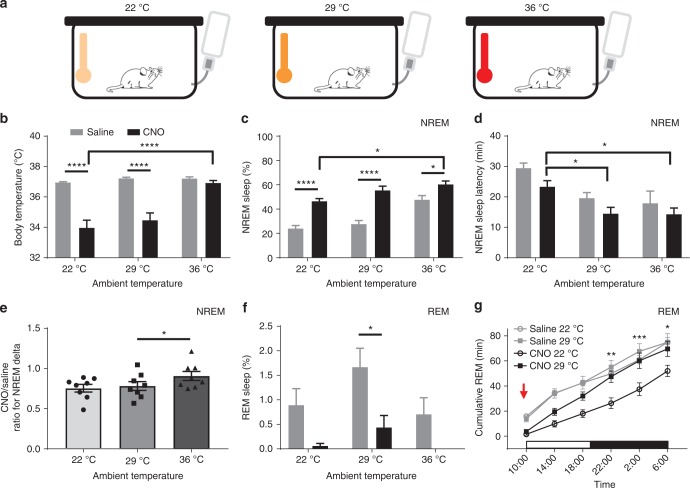
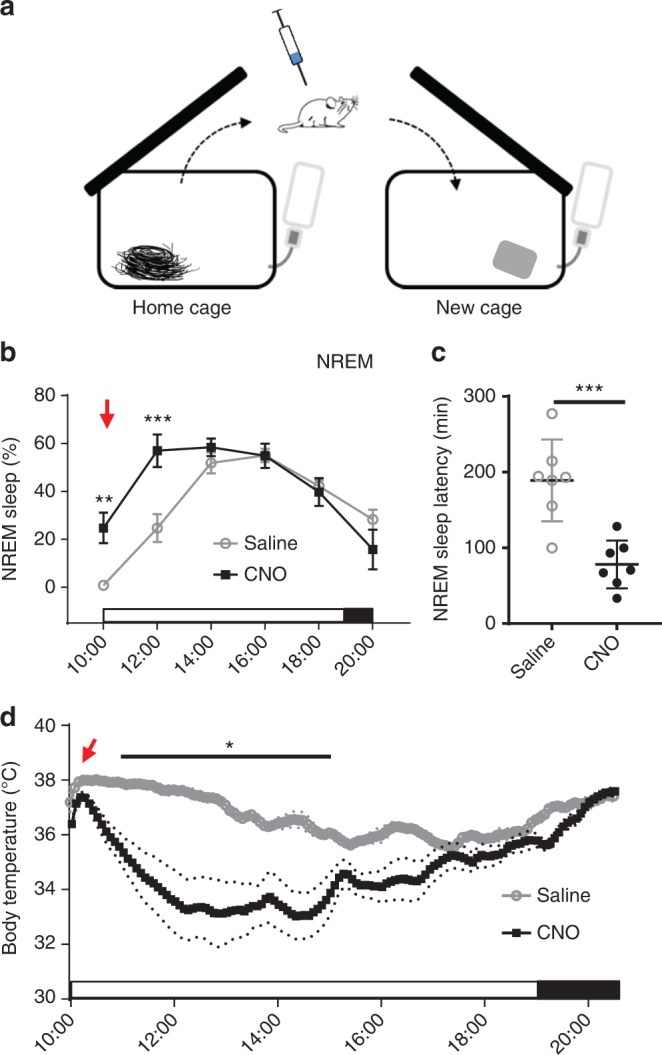
Verification
Claims the paper makes
The claims and statistics of this paper haven’t been checked yet.
Run the check — free, no account needed. It reads the open-access text and checks the sources it cites.
Claims other papers make about this one
Each is checked against this paper’s own text: does it say what the citing paper says it does?
The source backs part of the claim, not all of it — or backs it for a different population, condition or comparison.
In the citing paper
“Recent work suggests that general anesthetics coopt such “dual purpose” warm-sensing and sleep-active subsets of neurons both to elicit hypnosis and to drive central cooling of body temperature, which occurs during anesthetics states [99, 103, 110].”
From The Biology of General Anesthesia from Paramecium to Primate (2019) · cites this paper as [110]
Experimental — accuracy not yet measured
Self-check
Percentages, sums and reported differences re-computed from the paper’s own numbers.
The self-check needs the paper’s full text.
Citations
Cites
The Mouse Brain in Stereotaxic Coordinates
Paxinos, G. (2001) · Cited by 12,859
Rapid, reversible activation of AgRP neurons drives feeding behavior in mice
Krashes, M. J., Koda, S., Ye, C., Rogan, S. C., Adams, A. C., Cusher, D. S., Maratos-Flier, E., Roth, B. L., & Lowell, B. B. (2011) · Journal of Clinical Investigation · doi:10.1172/jci46229 · Cited by 1,578
A putative flip–flop switch for control of REM sleep
Lu, J., Sherman, D. L., Devor, M. G., & Saper, C. B. (2006) · Nature · doi:10.1038/nature04767 · Cited by 1,265
Self-citationActivation of ventrolateral preoptic neurons during sleep
Sherin, J. E., Shiromani, P. J., McCarley, R. W., & Saper, C. B. (1996) · Science · doi:10.1126/science.271.5246.216 · Cited by 1,111
Self-citationChemogenetics revealed: DREADD occupancy and activation via converted clozapine
Gomez, J. L., Bonaventura, J., Lesniak, W., Mathews, W. B., Sysa-Shah, P., Rodriguez, L. A., Ellis, R. J., Richie, C. T., Harvey, B. K., Dannals, R. F., et al. (2017) · Science · doi:10.1126/science.aan2475 · Cited by 980
Sherin, J. E., Elmquist, J. K., Torrealba, F., & Saper, C. B. (1998) · Journal of Neuroscience · doi:10.1523/jneurosci.18-12-04705.1998 · Cited by 746
Self-citationSLEEP AS A PROBLEM OF LOCALIZATION
von Economo, C. (1930) · The Journal of Nervous and Mental Disease · doi:10.1097/00005053-193003000-00001 · Cited by 691
Central neural pathways for thermoregulation
Shaun, F. M. (2010) · Frontiers in bioscience · doi:10.2741/3677 · Cited by 671
HYPOTHALAMIC REGULATION OF SLEEP IN RATS. AN EXPERIMENTAL STUDY
Nauta, W. J. H. (1946) · Journal of Neurophysiology · doi:10.1152/jn.1946.9.4.285 · Cited by 668
Effect of Lesions of the Ventrolateral Preoptic Nucleus on NREM and REM Sleep
Lu, J., Greco, M. A., Shiromani, P. J., & Saper, C. B. (2000) · Journal of Neuroscience · doi:10.1523/jneurosci.20-10-03830.2000 · Cited by 667
Self-citation
Cited by
Sorted by citations
Items 201–275 of 275
Ingestive Peptides – An Emerging Tool for Diagnostics and Therapeutics: A Review
(2021) · International Journal of Veterinary Science · doi:10.47278/journal.ijvs/2021.052 · Cited by 1
Sleep, Ageing, and Cognitive Decline
Melnattur, K. V. (2023) · Healthy ageing and longevity · doi:10.1007/978-3-031-22468-3_9 · Cited by 1
Sheremet, M. I., Bulyk, R. Y., Yosypenko, V. R., Protsak, Т. V., Kryvchanska, M. I., Vlasova, K. V., Voloshyn, V. L., Smetaniuk, O. V., Lukan, Y. R., Bulyk, T. S., et al. (2023) · Journal of Medicine and Life · doi:10.25122/jml-2023-0049 · Cited by 3
Medulla glutamatergic neurons control wake-sleep transitionsPreprint
Teng, S., Zhen, F., Schalchli, J. C., Chen, X., Jin, H., Wang, L., & Peng, Y. (2021) · bioRxiv (Cold Spring Harbor Laboratory) · doi:10.1101/2021.03.07.434263 · Cited by 1
Overview of physiological processes during sleep
Amici, R., Cerri, M., Hitrec, T., & Zoccoli, G. (2021) · Elsevier eBooks · doi:10.1016/b978-0-12-822963-7.00178-x · Cited by 2
Morrison, S. F. (2021) · Springer eBooks · doi:10.1007/978-3-319-19650-3_715 · Cited by 1
Bárez‐López, S., Elsamad, G., Bishop, P., Searby, D., Kershaw, Y. M., Conway-Campbell, B. L., Murphy, D., & Greenwood, M. P. (2022) · bioRxiv (Cold Spring Harbor Laboratory) · doi:10.1101/2022.07.28.501815 · Cited by 1
Homeostatic regulation of REM sleep by the preoptic area of the hypothalamusPreprint
Maurer, J. J., Lin, A., Jin, X., Hong, J., Sathi, N., Cardis, R., Osorio-Forero, A., Lüthi, A., Weber, F., & Chung, S. (2023) · eLife · doi:10.7554/elife.92095.1 · Cited by 1
Guardian of Excitability: Multifaceted Role of Galanin in Whole Brain ExcitabilityPreprint
Rieser, N. N., Ronchetti, M., Hotz, A. L., & Neuhauss, S. C. F. (2024) · eLife · doi:10.7554/elife.98634.1 · Cited by 1
A thalamic hub integrates brainstem and stress signals to dynamically regulate REM sleepPreprint
Magyar, A., Berki, P., Borbély, S., Barsy, B., Bakacsi, A. V., Lörincz, M. L., Liu, D., & Mátyás, F. (2025) · bioRxiv (Cold Spring Harbor Laboratory) · doi:10.1101/2025.07.22.665932 · Cited by 1
Morones, N., Jovanović, P., Sanetra, A. M., Jang, K., Keshishian, N., Cui, Z., Novinbakht, E., Breunig, J. J., Berg, A. H., Pirtskhalava, T., et al. (2025) · bioRxiv (Cold Spring Harbor Laboratory) · doi:10.1101/2025.11.03.686336 · Cited by 1
Does the Sleep-Related Neurons Modulate the Sensation of Pain under the Use of GA?
Fang, Y., Zong, J., & Kunes, S. M. (2019) · Advances in Bioscience and Biotechnology · doi:10.4236/abb.2019.1011028
Efeitos termorregulatórios e neuroimunomodulatórios da serotonina
Mota, C. M. D. (2020) · Digital Library of Theses and Dissertations (Universidade de São Paulo) · doi:10.11606/t.17.2020.tde-13042020-153828
Exploration of neuronal ensembles responsible for sleep and body temperature regulation
Ma, Y. (2019) · Spiral (Imperial College London) · doi:10.25560/80152
Bulyk, R. Y., & Yosypenko, V. R. (2020) · Bukovinian Medical Herald · doi:10.24061/2413-0737.xxiv.2.94.2020.36
Schmidt, M. H., Lippert, J., Adamantidis, A., & Huber, R. (2020) · Elsevier eBooks · doi:10.1016/b978-3-437-21321-2.00002-8
Bulyk, R. Y., & Yosypenko, V. R. (2020) · Здобутки клінічної і експериментальної медицини · doi:10.11603/1811-2471.2020.v.i3.11581
Hoffman, G. E., & Koban, M. (2020) · Contemporary Endocrinology · doi:10.1007/978-3-030-62187-2_13
Electrophysiological studies and sleep-wake cycle
Alam, A., Kostin, A., & Alam, M. N. (2021) · Elsevier eBooks · doi:10.1016/b978-0-323-85235-7.00008-9
Yu, X., & Li, W. (2021) · General and Comparative Endocrinology · doi:10.1016/j.ygcen.2021.113945
Bulyk, R. Y., Yosypenko, V. R., Kryvchanska, M. I., Vlasova, K. V., & Lukan, Y. (2021) · Journal of Education Health and Sport · doi:10.12775/jehs.2021.11.10.025
Yosypenko, V. R., Bulyk, R. Y., Kryvchanska, M. I., & Lukan, Y. R. (2021) · Clinical & experimental pathology · doi:10.24061/1727-4338.xx.3.77.2021.4
Structural insights into the galanin receptors signalingPreprint
Jiang, W., & Zheng, S. (2022) · bioRxiv (Cold Spring Harbor Laboratory) · doi:10.1101/2022.01.17.476689
Alonso, I. P., & España, R. A. (2021) · Elsevier eBooks · doi:10.1016/b978-0-12-822963-7.00166-3
Optogenetics in the study of the central nervous system during sleep
Angelakos, C. C., & de Lecea, L. (2022) · Elsevier eBooks · doi:10.1016/b978-0-12-822963-7.00230-9
(2019) · BJPsych International · doi:10.1192/bji.2019.7
Editorial: Behaviors and Neural Circuits in Sleep and Sedation
Harding, E. C., Zhang, Z., Dong, H., & Yu, X. (2022) · Frontiers in Neuroscience · doi:10.3389/fnins.2022.930591
Bulyk, R. Y., Yosypenko, V. R., Yosypenko, Y. R., Proniaiev, D. V., Vlasova, K. V., Voloshyn, V. L., & Smetaniuk, O. V. (2023) · World of Medicine and Biology · doi:10.26724/2079-8334-2023-3-85-195-200
Parental Brain Through Time: function, anatomy, and molecular mechanisms in contextsPreprint
Kuroda, K. O., Fukumitsu, K., Kurachi, T., Ohmura, N., Shiraishi, Y., & Yoshihara, C. (2023) · doi:10.32942/x2x31d
Homeostatic regulation of REM sleep by the preoptic area of the hypothalamusPreprint
Maurer, J. J., Lin, A., Jin, X., Hong, J., Sathi, N., Cardis, R., Osorio-Forero, A., Lüthi, A., Weber, F., & Chung, S. (2024) · eLife · doi:10.7554/elife.92095.2
An Intra-Hypothalamic Pathway Modulating Body Temperature and FeedingPreprint
Nencini, S., & Siemens, J. (2024) · bioRxiv (Cold Spring Harbor Laboratory) · doi:10.1101/2024.04.16.589686
The neurotransmitters of sleep and arousal
Fan, C. (2024) · Theoretical and Natural Science · doi:10.54254/2753-8818/37/20240186
Sakai, N., Komi, K., Nishino, N., Kuroki, Y., & Nishino, S. (2024) · SLEEP Advances · doi:10.1093/sleepadvances/zpae047
Author response: Guardian of Excitability: Multifaceted Role of Galanin in Whole Brain Excitability
Rieser, N. N., Ronchetti, M., Hotz, A. L., & Neuhauss, S. C. F. (2024) · eLife · doi:10.7554/elife.98634.1.sa0
eLife Assessment: Guardian of Excitability: Multifaceted Role of Galanin in Whole Brain Excitability
Scharfman, H. E. (2024) · eLife · doi:10.7554/elife.98634.1.sa4
Regulation of REM Sleep Onset and Homeostasis by Preoptic Glutamatergic NeuronsPreprint
Mondino, A., Jadidian, A., Toth, B. A., Hambrecht‐Wiedbusch, V. S., Floran-Garduno, L., Li, D., York, A. K., Torterolo, P., Pal, D., Burgess, C. R., et al. (2024) · bioRxiv (Cold Spring Harbor Laboratory) · doi:10.1101/2024.10.03.616573
Cherrad, N., Foustoukos, G., Fernandez, L. M. J., Osorio-Forero, A., Emmenegger, Y., Franken, P., & Lüthi, A. (2025) · bioRxiv (Cold Spring Harbor Laboratory) · doi:10.1101/2025.03.14.643122
Guardian of Excitability: Multifaceted Role of Galanin in Whole Brain ExcitabilityPreprint
Rieser, N. N., Ronchetti, M., Hotz, A. L., & Neuhauss, S. C. F. (2025) · eLife · doi:10.7554/elife.98634.2
Circuits and Neurotransmitter Systems Controlling Sleep and Wake
Arrigoni, E., & Fuller, P. M. (2025) · doi:10.1093/med/9780197756782.003.0006
Self-citationGuardian of Excitability: Multifaceted Role of Galanin in Whole Brain ExcitabilityPreprint
Rieser, N. N., Ronchetti, M., Hotz, A. L., & Neuhauss, S. C. F. (2025) · eLife · doi:10.7554/elife.98634.3
Chandler, P. W., Lee, S., Duncan, L. H., Kim, D. W., Wu, M. N., & Blackshaw, S. (2025) · bioRxiv (Cold Spring Harbor Laboratory) · doi:10.1101/2025.07.30.667705
Thermal challenge and food intake: Mutual regulatory mechanisms
Alpár, A. (2025) · Neural Regeneration Research · doi:10.4103/nrr.nrr-d-25-00170
Slow intrinsic oscillations in the ventrolateral preoptic nucleus
Perrenoud, Q., Ribot, J., Geoffroy, H., Gallopin, T., Rouach, N., & Rancillac, A. (2026) · iScience · doi:10.1016/j.isci.2026.116477
Hypothalamic and physiological regulation of sleep in cancer
Boyd, L., & Borniger, J. C. (2025) · Elsevier eBooks · doi:10.1016/b978-0-443-28938-5.00007-6
Chen, Q., Zhang, X.-Y., Wang, Y.-P., Fu, Y.-J., Cao, F., Xu, Y.-N., Kong, J.-G., Tian, N.-X., Xu, Y., & Wang, Y. (2023) · Figshare · doi:10.6084/m9.figshare.24439339
Chen, Q., Zhang, X.-Y., Wang, Y.-P., Fu, Y.-J., Cao, F., Xu, Y.-N., Kong, J.-G., Tian, N.-X., Xu, Y., & Wang, Y. (2024) · Figshare · doi:10.6084/m9.figshare.26632048
Chen, Q., Zhang, X.-Y., Wang, Y.-P., Fu, Y.-J., Cao, F., Xu, Y.-N., Kong, J.-G., Tian, N.-X., Xu, Y., & Wang, Y. (2024) · Figshare · doi:10.6084/m9.figshare.26632027
Chen, Q., Zhang, X.-Y., Wang, Y.-P., Fu, Y.-J., Cao, F., Xu, Y.-N., Kong, J.-G., Tian, N.-X., Xu, Y., & Wang, Y. (2024) · Figshare · doi:10.6084/m9.figshare.26632045
Chen, Q., Zhang, X.-Y., Wang, Y.-P., Fu, Y.-J., Cao, F., Xu, Y.-N., Kong, J.-G., Tian, N.-X., Xu, Y., & Wang, Y. (2024) · Figshare · doi:10.6084/m9.figshare.26632030
Chen, Q., Zhang, X.-Y., Wang, Y.-P., Fu, Y.-J., Cao, F., Xu, Y.-N., Kong, J.-G., Tian, N.-X., Xu, Y., & Wang, Y. (2024) · Figshare · doi:10.6084/m9.figshare.26632039
Chen, Q., Zhang, X.-Y., Wang, Y.-P., Fu, Y.-J., Cao, F., Xu, Y.-N., Kong, J.-G., Tian, N.-X., Xu, Y., & Wang, Y. (2024) · Figshare · doi:10.6084/m9.figshare.24439484
Chen, Q., Zhang, X.-Y., Wang, Y.-P., Fu, Y.-J., Cao, F., Xu, Y.-N., Kong, J.-G., Tian, N.-X., Xu, Y., & Wang, Y. (2024) · Figshare · doi:10.6084/m9.figshare.26632036
Chen, Q., Zhang, X.-Y., Wang, Y.-P., Fu, Y.-J., Cao, F., Xu, Y.-N., Kong, J.-G., Tian, N.-X., Xu, Y., & Wang, Y. (2024) · Figshare · doi:10.6084/m9.figshare.26632033
Chen, Q., Zhang, X.-Y., Wang, Y.-P., Fu, Y.-J., Cao, F., Xu, Y.-N., Kong, J.-G., Tian, N.-X., Xu, Y., & Wang, Y. (2024) · Figshare · doi:10.6084/m9.figshare.26632042
Hypothalamic-Pituitary-Ovarian Axis and its Disarray in PCOS
Chowdhury, S., & Gargari, P. (2025) · BENTHAM SCIENCE PUBLISHERS eBooks · doi:10.2174/9798898810931125010016
Hypothalamic control of arousal
Seigneur, E. M., & de Lecea, L. (2026) · Reviews in Endocrine and Metabolic Disorders · doi:10.1007/s11154-026-10015-y
PACAP/PAC 1 modulates light-induced sleep via the ipRGC-VLPO pathway
Wang, W., Zhang, Y., Li, L., Xu, Y., Zhang, W., Chen, X., Wang, X., 童广安, & Zhang, P. (2026) · Biochemical and Biophysical Research Communications · doi:10.1016/j.bbrc.2026.153462
Cai, S., Yang, W. Z., Xu, M., Chen, H., Zhou, L., Luo, T., Yu, S., Zhang, K., Wang, H., Yu, T., et al. (2026) · iScience · doi:10.1016/j.isci.2026.115542
Body-Brain Integration: The Lower Brainstem in Sleep-Wake Regulation
Yao, Y., & Dan, Y. (2026) · Annual Review of Neuroscience · doi:10.1146/annurev-neuro-082625-012115 · Cited by 1
A preoptic circuit triggers rewarming from torporPreprint
Ohba, A., Narushima, M., Shao, C., Hung, C., Uchida, H., Fukatsu, N., Angarag, U., Takemoto‐Kimura, S., Yamanaka, A., Tainaka, K., et al. (2026) · bioRxiv (Cold Spring Harbor Laboratory) · doi:10.64898/2026.04.30.722109
The ventrolateral preoptic nucleus: a multisystem integrator in sleep–wake regulation
Wang, C., Hua, X., Chen, Y., Xu, W., Wu, Z., Wan, Y., Jia, X., Xu, F., Shao, X., & Jiang, S. (2026) · Frontiers in Neuroscience · doi:10.3389/fnins.2026.1773131
Neural mechanisms and architecture of sleep
Salim, M., Qatanany, B., Sharafkhaneh, A., Rao, K. S. J., & Nami, M. (2026) · Progress in brain research · doi:10.1016/bs.pbr.2026.07.006
Gut–autonomic–brain loops in sleep regulation: From mechanisms to clinical implications
Gao, T., Tesmer, A. L., Liu, S., Zhang, Y., Que, J., Chen, S., Wang, Z., & Lu, L. (2026) · Sleep Medicine Reviews · doi:10.1016/j.smrv.2026.102347
Molecular and functional heterogeneity of hypothalamic preoptic neurons
Carta, I., Arora, T., Bambah-Mukku, D., & Autry, A. E. (2026) · Neuroscience & Biobehavioral Reviews · doi:10.1016/j.neubiorev.2026.106891
Duan, Y., Jia, Q., Luo, J., Wang, Y., Liu, Y., Lu, X., Shan, J., Cao, J., Ma, Y., Mi, W., et al. (2026) · Nanotechnology and Precision Engineering · doi:10.1063/5.0328124
Burnjaković, B., Moy, H., Sič, A., & Knežević, N. N. (2026) · International Journal of Molecular Sciences · doi:10.3390/ijms27177852
A male-biased hypothalamic circuit modulates postmating sleep suppression in mice
Zhao, J., Jiang, L., Zhang, Q., Huang, S., Gao, X., Song, M., Xue, L., Pan, S., Zha, X., Jin, L., et al. (2026) · Science Advances · doi:10.1126/sciadv.aeb6839
Dehnad, M., Bjorness, T. E., Kulkarni, A., Thai, T., Pandey, R., Konopka, G., Loer, S. A., & Greene, R. W. (2026) · bioRxiv (Cold Spring Harbor Laboratory) · doi:10.64898/2026.10.18.760000
Metadata
- Authors
- Kroeger, D., Absi, G., Gagliardi, C., Bandaru, S. S., Madara, J. C., Ferrari, L. L., Arrigoni, E., Münzberg, H., Scammell, T. E., Saper, C. B., & Vetrivelan, R.
- Affiliations
- Beth Israel Deaconess Medical Center (US)
- Pennington Biomedical Research Center (US)
- Corresponding author
- Saper, Clifford B.
- Vetrivelan, Ramalingam
- ORCID
- Venue
- Nature Communications
- Published
- 2018-10-08
- Volume
- 9
- Issue
- 1
- Pages
- 4129-4129
- ISSN
- 2041-1723 (ISSN-L)
- PMC
- PMC6175893
- OpenAlex
- W2895180682
- Cited by
- 276
- References
- 70
- Citations by year
- 2026: 26 · 2025: 29 · 2024: 46 · 2023: 37 · 2022: 32 · 2021: 46 · 2020: 29 · 2019: 31
- FWCI
- 15.78
- Type
- journal article
- Language
- en
- Open access
- gold
- doi.org
- Locations
- Nature Communications (publishedVersion, cc-by)
- Europe PMC (PubMed Central) (publishedVersion, cc-by)
- PubMed Central (publishedVersion, cc-by)
- PubMed (publishedVersion)
- RePEc: Research Papers in Economics (submittedVersion)
- DOAJ (DOAJ: Directory of Open Access Journals) (submittedVersion)
- DOAJ (DOAJ: Directory of Open Access Journals) (submittedVersion, cc-by-sa)
- Funders
- Office of Extramural Research, National Institutes of Health (NS091126, NS085477, HL095491, AG009975)
- Topics
- Life Sciences › Neuroscience › Cognitive Neuroscience › Sleep and Wakefulness Research
- Life Sciences › Neuroscience › Endocrine and Autonomic Systems › Circadian rhythm and melatonin
- Life Sciences › Neuroscience › Endocrine and Autonomic Systems › Neuroscience of respiration and sleep
- Keywords
- ventrolateral preoptic area, sleep regulation, heat loss, body temperature, photostimulation, optogenetics, chemogenetics, insomnia, c-fos, wakefulness, neuronal firing rate
- MeSH terms
- Animals, Body Temperature Regulation, Electroencephalography, Electromyography, Sleep Initiation and Maintenance Disorders, Male, Mice, Transgenic, Neurons, Preoptic Area, Sleep, Galanin, Gene Expression Profiling
About these checks
Registry, retraction, Cites and statistics results are computed, not judged, with one exception: a printed reference that no index lists is read once by a model before it counts as a citation error. Claims are extracted by a model and kept only when their quote appears verbatim in the text; each cited source is then checked, with a model’s help, for whether it says what the claim relies on. Those verdicts can be wrong — read the claim’s quote and the cited source before relying on one.
Statistics and arithmetic are recomputed, not judged.
Confidence bands are shown only for fields calibrated on our annotated test set. None is calibrated yet, so no band is shown.
What counts as a claim ›How we measure confidence ›How we check this ›
Are you an author, or do you see a problem with this page? Request a review
