

A rapid and robust method for single cell chromatin accessibility profiling
Open accessPublished version of a preprint
The DOI matches its Crossref record; 52 of the 52 references it cites were found in a registry or an index.
Abstract
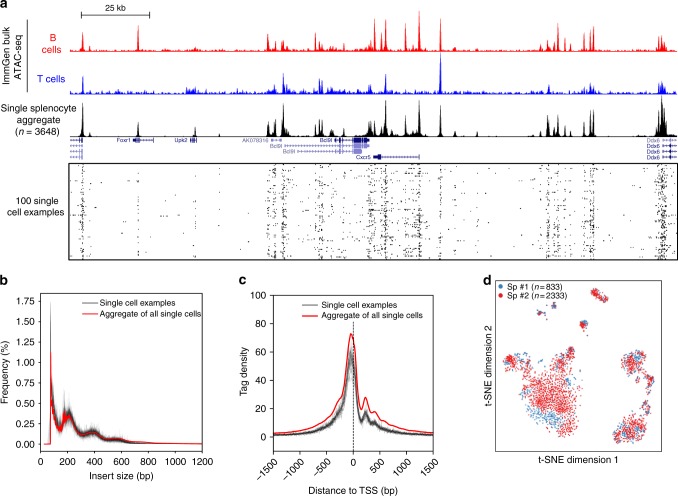
The assay for transposase-accessible chromatin using sequencing (ATAC-seq) is widely used to identify regulatory regions throughout the genome. However, very few studies have been performed at the single cell level (scATAC-seq) due to technical challenges. Here we developed a simple and robust plate-based scATAC-seq method, combining upfront bulk Tn5 tagging with single-nuclei sorting. We demonstrate that our method works robustly across various systems, including fresh and cryopreserved cells from primary tissues. By profiling over 3000 splenocytes, we identify distinct immune cell types and reveal cell type-specific regulatory regions and related transcription factors.
Overview
The claims and statistics of this paper haven’t been checked yet.
Free: it reads the open-access text and checks the first 5 claims that cite a source we can check. Create a free account to check every claim.
Integrity signals
Registry
Cites
Statistics
Figures



Verification
Claims the paper makes
The claims and statistics of this paper haven’t been checked yet.
Free: it reads the open-access text and checks the first 5 claims that cite a source we can check. Create a free account to check every claim.
Claims other papers make about this one
Each is checked against this paper’s own text: does it say what the citing paper says it does?
In the citing paper
“and we observed a largely consistent pattern when compared to dimensionality reduction and clustering using the latent semantic index (LSI) of our dscATAC-seq data as has been previously performed27,28 (Supplementary Fig. 4e).”
From Droplet-based combinatorial indexing for massive-scale single-cell chromatin accessibility (2019) · cites this paper as [28]
Self-check
Percentages, sums and reported differences re-computed from the paper’s own numbers.
The self-check needs the paper’s full text.
Citations
Cites
Scikit-learn: Machine Learning in Python
Pedregosa, F., Varoquaux, G., Gramfort, A., Michel, V., Thirion, B., Grisel, O., Blondel, M., Müller, A., Nothman, J., Louppe, G., et al. (2012) · arXiv · doi:10.48550/arxiv.1201.0490 · Cited by 71,016
The Sequence Alignment/Map format and SAMtools
Li, H., Handsaker, B., Wysoker, A., Fennell, T., Ruan, J., Homer, N., Marth, G., Abecasis, G., Durbin, R., & 1000 Genome Project Data Processing Subgroup (2009) · Bioinformatics · doi:10.1093/bioinformatics/btp352 · Cited by 62,041
Cutadapt removes adapter sequences from high-throughput sequencing reads
Martin, M. (2011) · EMBnet.journal · doi:10.14806/ej.17.1.200 · Cited by 33,889
(2008) · Journal of Machine Learning Research · Cited by 33,051
BEDTools: a flexible suite of utilities for comparing genomic features
Quinlan, A. R., & Hall, I. M. (2010) · Bioinformatics · doi:10.1093/bioinformatics/btq033 · Cited by 27,437
HISAT: a fast spliced aligner with low memory requirements
Kim, D., Langmead, B., & Salzberg, S. L. (2015) · Nature Methods · doi:10.1038/nmeth.3317 · Cited by 24,112
Model-based Analysis of ChIP-Seq (MACS)
Zhang, Y., Liu, T., Meyer, C. A., Eeckhoute, J., Johnson, D. S., Bernstein, B. E., Nusbaum, C., Myers, R. M., Brown, M., Li, W., et al. (2008) · Genome Biology · doi:10.1186/gb-2008-9-9-r137 · Cited by 18,386
Heinz, S., Benner, C., Spann, N., Bertolino, E., Lin, Y. C., Laslo, P., Cheng, J. X., Murre, C., Singh, H., & Glass, C. K. (2010) · Molecular Cell · doi:10.1016/j.molcel.2010.05.004 · Cited by 13,382
A tutorial on spectral clustering
von Luxburg, U. (2007) · Statistics and Computing · doi:10.1007/s11222-007-9033-z · Cited by 10,349
Buenrostro, J. D., Giresi, P. G., Zaba, L. C., Chang, H. Y., & Greenleaf, W. J. (2013) · Nature Methods · doi:10.1038/nmeth.2688 · Cited by 6,422
Cited by
Microplastics affect sedimentary microbial communities and nitrogen cycling
Seeley, M. E., Song, B., Passie, R., & Hale, R. C. (2020) · Nature Communications · doi:10.1038/s41467-020-16235-3 · Cited by 1,232
The technological landscape and applications of single-cell multi-omics
Baysoy, A., Bai, Z., Satija, R., & Fan, R. (2023) · Nature Reviews Molecular Cell Biology · doi:10.1038/s41580-023-00615-w · Cited by 1,037
Ultrasensitive and visual detection of SARS-CoV-2 using all-in-one dual CRISPR-Cas12a assay
Ding, X., Yin, K., Li, Z., Lalla, R. V., Ballesteros, E., Sfeir, M. M., & Liu, C. (2020) · Nature Communications · doi:10.1038/s41467-020-18575-6 · Cited by 919
Tumor-infiltrating lymphocytes in the immunotherapy era
Paijens, S. T., Vledder, A., de Bruyn, M., & Nijman, H. W. (2021) · Cellular & Molecular Immunology · doi:10.1038/s41423-020-00565-9 · Cited by 880
Zhang, Y., Chen, H., Mo, H., Hu, X., Gao, R., Zhao, Y., Liu, B., Niu, L., Sun, X., Yu, X., et al. (2021) · Cancer Cell · doi:10.1016/j.ccell.2021.09.010 · Cited by 783
Metadata
- Authors
- Chen, X., Miragaia, R. J., Natarajan, K. N., & Teichmann, S. A.
- Affiliations
- Wellcome Sanger Institute (GB)
- University of Southern Denmark (DK)
- European Bioinformatics Institute (GB)
- Corresponding author
- Teichmann, Sarah A.
- Venue
- Nature Communications
- Published
- 2018-12-17
- Volume
- 9
- Issue
- 1
- Pages
- 5345-5345
- ISSN
- 2041-1723 (ISSN-L)
- PMC
- PMC6297232
- OpenAlex
- W2951054376
- Cited by
- 1,147
- References
- 50
- Citations by year
- 2026: 17 · 2025: 22 · 2024: 27 · 2023: 31 · 2022: 32 · 2021: 562 · 2020: 349 · 2019: 86 · 2018: 20
- FWCI
- 90.90
- Type
- journal article
- Language
- en
- Open access
- gold
- doi.org
- Licence
- cc-by
- creativecommons.org/licenses/by/4.0 (tdm)
- creativecommons.org/licenses/by/4.0 (vor)
- Locations
- Nature Communications (publishedVersion, cc-by)
- bioRxiv (Cold Spring Harbor Laboratory) (acceptedVersion, cc-by)
- Europe PMC (PubMed Central) (publishedVersion, cc-by)
- PubMed Central (publishedVersion, cc-by)
- PubMed (publishedVersion)
- University of Southern Denmark Research Portal (University of Southern Denmark) (acceptedVersion, cc-by)
- RePEc: Research Papers in Economics (submittedVersion)
- DOAJ (DOAJ: Directory of Open Access Journals) (submittedVersion)
- DOAJ (DOAJ: Directory of Open Access Journals) (submittedVersion, cc-by-sa)
- Apollo (University of Cambridge) (submittedVersion, cc-by)
- Apollo (cc-by)
- Funders
- Wellcome Trust (WT206194)
- Topics
- Life Sciences › Biochemistry, Genetics and Molecular Biology › Molecular Biology › Genomics and Chromatin Dynamics
- Life Sciences › Biochemistry, Genetics and Molecular Biology › Molecular Biology › Single-cell and spatial transcriptomics
- Life Sciences › Biochemistry, Genetics and Molecular Biology › Molecular Biology › Chromatin Remodeling and Cancer
- Keywords
- single-cell chromatin accessibility, single-cell ATAC-seq, plate-based assay, cryopreserved cells, splenocytes, immune cell types, transcription factors
- MeSH terms
- Animals, Cell Line, Chromatin, Humans, Mice, Inbred C57BL, Spleen, Transcription Factors, 3T3 Cells, Sequence Analysis, DNA, Transposases, Mice, HEK293 Cells, Single-Cell Analysis, High-Throughput Nucleotide Sequencing
About these checks
Registry, retraction, Cites and statistics results are computed, not judged, with one exception: a printed reference that no index lists is read once by a model before it counts as a citation error. Claims are extracted by a model and kept only when their quote appears verbatim in the text; each cited source is then checked, with a model’s help, for whether it says what the claim relies on. Those verdicts can be wrong — read the claim’s quote and the cited source before relying on one.
Statistics and arithmetic are recomputed, not judged.
Confidence bands are shown only for fields calibrated on our annotated test set. None is calibrated yet, so no band is shown.
What counts as a claim ›How we measure confidence ›How we check this ›
Are you an author, or do you see a problem with this page? Request a review
How to cite
Cite CoChat for the checks on this page, and the paper for its own findings.
- This page
- CoChat. (2026). Citation check: A rapid and robust method for single cell chromatin accessibility profiling. https://app.cochat.ai/papers/10.1038/s41467-018-07771-0
- The paper
- Chen, X., Miragaia, R. J., Natarajan, K. N., & Teichmann, S. A. (2018). A rapid and robust method for single cell chromatin accessibility profiling. Nature Communications. https://doi.org/10.1038/s41467-018-07771-0
Data sources
Bibliographic data: Semantic Scholar, OpenAlex, Crossref.
Contains information from the Semantic Scholar Academic Graph Datasets, made available under the ODC Attribution License (ODC-BY 1.0).
Semantic Scholar’s data is described in: Kinney, R., et al. (2023). The Semantic Scholar Open Data Platform. arXiv:2301.10140.
