Cited by 64

The DOI matches its Crossref record; 10 of the 10 references it cites were found in a registry or an index.

Gigaxonin E3 ligase governs ATG16L1 turnover to control autophagosome production

Scrivo, Aurora, Codogno, Patrice, Bomont, Pascale·2019·Nature Communications

Abstract

Autophagy is an essential self-digestion machinery for cell survival and homoeostasis. Membrane elongation is fundamental, as it drives the formation of the double-membrane vesicles that engulf cytosolic material. LC3-lipidation, the signature of autophagosome formation, results from a complex ubiquitin-conjugating cascade orchestrated by the ATG16L1 protein, whose regulation is unknown. Here, we identify the Gigaxonin-E3 ligase as the first regulator of ATG16L1 turn-over and autophagosome production. Gigaxonin interacts with the WD40 domain of ATG16L1 to drive its ubiquitination and subsequent degradation. Gigaxonin depletion induces the formation of ATG16L1 aggregates and impairs LC3 lipidation, hence altering lysosomal fusion and degradation of the main autophagy receptor p62. Altogether, we demonstrate that the Gigaxonin-E3 ligase controls the production of autophagosomes by a reversible, ubiquitin-dependent process selective for ATG16L1. Our findings unveil the fundamental mechanisms of the control of autophagosome formation, and provide a molecular switch to fine-tune the activation of autophagy.

Overview

The claims and statistics of this paper haven’t been checked yet.

Run the check — free, no account needed. It reads the open-access text and checks the sources it cites.

A few free checks a day · papers already verified open instantly · results are public

Integrity signals

Registry

Crossref · 10.1038/s41467-019-08331-w

Cites

10 of 10 references verified0 citation errors · 0 not checkable

Statistics

Figures

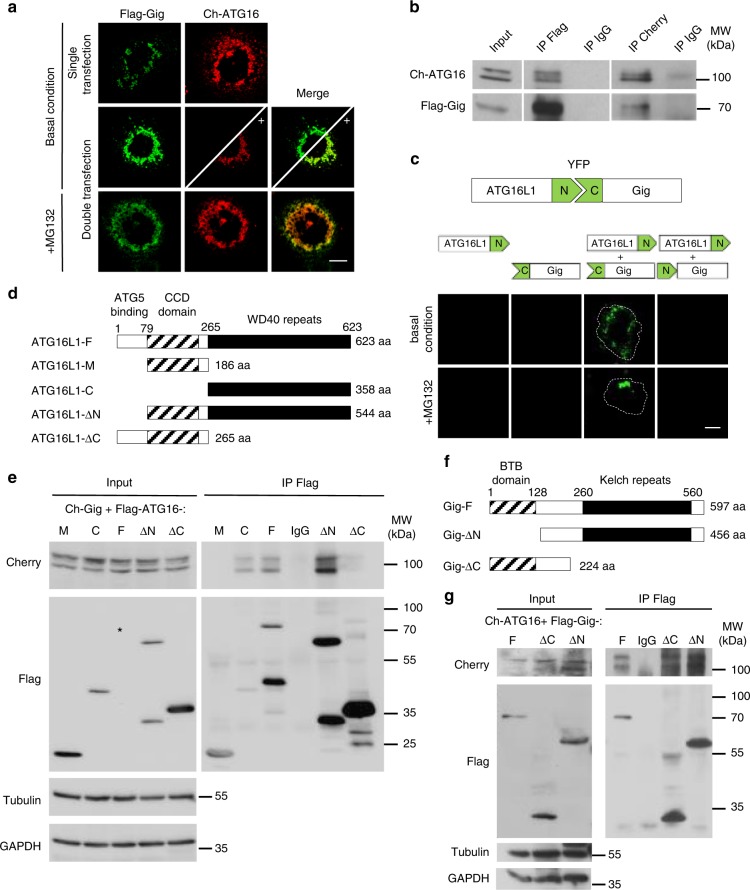
Fig. 1 Gigaxonin interacts with the WD40 domain of ATG16L1. a Immunofluorescence of COS-7 cells expressing Cherry-ATG16L1 (Ch-ATG16) with or without Flag-Gigaxonin (Flag-Gig). Boosting of Ch-ATG16 intensity (as shown by plus sign in the bottom panel delineated by the diagonal line) in normal condition, and MG132 treatment condition revealed a colocalisation between Gigaxonin and ATG16L1. b Reverse immunoprecipitation experiment was performed in COS-7 cells transfected with Ch-ATG16 and Flag-Gig and treated with MG132. Gigaxonin and ATG16L1 complexes were recovered using anti-flag (IP Flag) and anti-cherry (IP Cherry) antibodies and revealed by immunoblotting with Cherry/Flag antibodies. Immunoprecipitation with anti-IgG antibodies (IP IgG) served as negative control. c Interaction between ATG16L1 and Gigaxonin was demonstrated by bimolecular fluorescence complementation (BiFC) assay, in transfected COS-7 cells ± MG132. Interaction is visualised by the physical interaction between the N-terminal portion of YFP carrying construct (ATG16L1-N) and the C-terminal YFP construct (C-Gig). Negative controls include single transfection of ATG16L1-N, C-Gig or cotransfection of ATG16L1-N with N-Gig constructs. The dashed lines delineate the cells. d Schematic representation of the mouse ATG16L1 (ATG16L1-F) and its deletion constructs. N-terminal, central coiled-coil and C-terminal WD40 repeat domains are indicated in white, grey stripes and black, respectively. e The domain of interaction of ATG16L1 with Gigaxonin was evidenced by immunoprecipitation. Full-length and deletion constructs of Flag-ATG16 were transfected in COS-7 cells with Ch-Gig in presence of MG132. Please not that the Full-length ATG16L1 band (black star in the input panel) is enriched in pull down condition (in the IP Flag panel). Immunoprecipitation using anti-Flag antibodies evidenced Gigaxonin in the immunocomplexes formed by the Full-length-, C- and ∆N- ATG16L1 proteins. Negative controls include immunoprecipitation of the Ch-Gig + Flag-ATG16L1-F cell lysate with anti-IgG antibodies (IP IgG). f Schematic representation of the human Gigaxonin (Gig-F) with its N-terminal BTB (stripes) and C-terminal Kelch (black) domains and the BTB and Kelch deletion constructs. g Immunoprecipitation of Flag-Gig complexes identified Ch-ATG16 with both deletion constructs of Gigaxonin, Scale bar: 10 µm
Fig. 1 Gigaxonin interacts with the WD40 domain of ATG16L1. a Immunofluorescence of COS-7 cells expressing Cherry-ATG16L1 (Ch-ATG16) with or without Flag-Gigaxonin (Flag-Gig). Boosting of Ch-ATG16 intensity (as shown by plus sign in the bottom panel delineated by the diagonal line) in normal condition, and MG132 treatment condition revealed a colocalisation between Gigaxonin and ATG16L1. b Reverse immunoprecipitation experiment was performed in COS-7 cells transfected with Ch-ATG16 and Flag-Gig and treated with MG132. Gigaxonin and ATG16L1 complexes were recovered using anti-flag (IP Flag) and anti-cherry (IP Cherry) antibodies and revealed by immunoblotting with Cherry/Flag antibodies. Immunoprecipitation with anti-IgG antibodies (IP IgG) served as negative control. c Interaction between ATG16L1 and Gigaxonin was demonstrated by bimolecular fluorescence complementation (BiFC) assay, in transfected COS-7 cells ± MG132. Interaction is visualised by the physical interaction between the N-terminal portion of YFP carrying construct (ATG16L1-N) and the C-terminal YFP construct (C-Gig). Negative controls include single transfection of ATG16L1-N, C-Gig or cotransfection of ATG16L1-N with N-Gig constructs. The dashed lines delineate the cells. d Schematic representation of the mouse ATG16L1 (ATG16L1-F) and its deletion constructs. N-terminal, central coiled-coil and C-terminal WD40 repeat domains are indicated in white, grey stripes and black, respectively. e The domain of interaction of ATG16L1 with Gigaxonin was evidenced by immunoprecipitation. Full-length and deletion constructs of Flag-ATG16 were transfected in COS-7 cells with Ch-Gig in presence of MG132. Please not that the Full-length ATG16L1 band (black star in the input panel) is enriched in pull down condition (in the IP Flag panel). Immunoprecipitation using anti-Flag antibodies evidenced Gigaxonin in the immunocomplexes formed by the Full-length-, C- and ∆N- ATG16L1 proteins. Negative controls include immunoprecipitation of the Ch-Gig + Flag-ATG16L1-F cell lysate with anti-IgG antibodies (IP IgG). f Schematic representation of the human Gigaxonin (Gig-F) with its N-terminal BTB (stripes) and C-terminal Kelch (black) domains and the BTB and Kelch deletion constructs. g Immunoprecipitation of Flag-Gig complexes identified Ch-ATG16 with both deletion constructs of Gigaxonin, Scale bar: 10 µmCC BY · PubMed Central
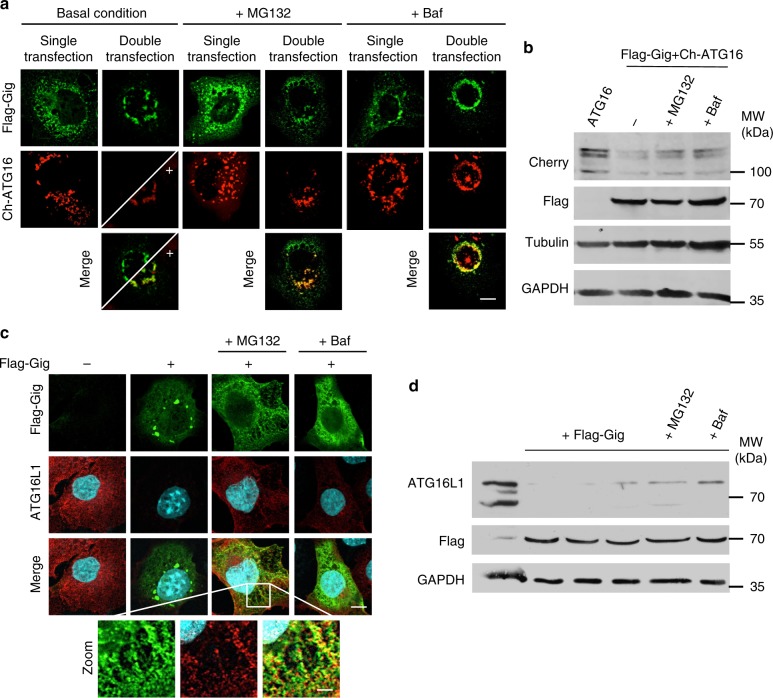
Fig. 2 Gigaxonin induces the degradation of ATG16L1, through the proteasome and the lysosomal pathways. a Immunofluorescence of COS-7 cells transfected with Flag-Gigaxonin and Cherry-ATG16L1 alone (single transfection) or together (double transfection), in basal condition, or treated with MG132 or Bafilomycin A1 (Baf). Gigaxonin-dependent degradation of ATG16L1 is rescued upon both treatments. b Immunoblotting of cell extracts prepared as in a to show the proteasome and autophagy-dependent degradation of ATG16L1 by Gigaxonin. Immunofluorescence (c) and immunoblotting (d) showed that endogenous ATG16L1 protein is greatly diminished in Gigaxonin transfected cells, and partially restored under MG132 or Bafilomycin A1 treatment. Scale bar: 10 µm and 50 µm for zoom pictures
Fig. 2 Gigaxonin induces the degradation of ATG16L1, through the proteasome and the lysosomal pathways. a Immunofluorescence of COS-7 cells transfected with Flag-Gigaxonin and Cherry-ATG16L1 alone (single transfection) or together (double transfection), in basal condition, or treated with MG132 or Bafilomycin A1 (Baf). Gigaxonin-dependent degradation of ATG16L1 is rescued upon both treatments. b Immunoblotting of cell extracts prepared as in a to show the proteasome and autophagy-dependent degradation of ATG16L1 by Gigaxonin. Immunofluorescence (c) and immunoblotting (d) showed that endogenous ATG16L1 protein is greatly diminished in Gigaxonin transfected cells, and partially restored under MG132 or Bafilomycin A1 treatment. Scale bar: 10 µm and 50 µm for zoom picturesCC BY · PubMed Central
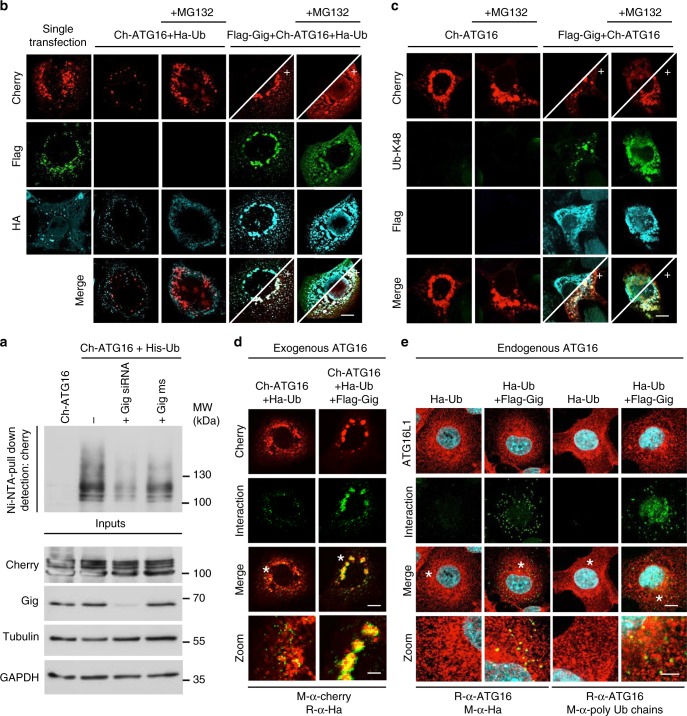
Fig. 3 Gigaxonin promotes the ubiquitination of ATG16L1. a In vivo ubiquitination assay for ATG16L1. COS-7 cells were transfected with Ch-ATG16 alone, or in combination with His-Ubiquitin construct (His-Ub) in the presence or absence of short interfering RNA (siRNA) against endogenous Gigaxonin (Gig siRNA) or the mismatch counterpart (Gig ms) and treated with MG132. The pull down of ubiquitinated ATG16L1 is performed in denaturing conditions using nickel agarose beads. b Colocalisation of ubiquitin with ATG16L1 upon Gigaxonin expression. COS-7 cells were transfected with Flag-Gig, Ch-ATG16 and HA-Ubiquitin (Ha-Ub) constructs ± MG132. The expression of Gigaxonin induces a drastic degradation of Ch-ATG16, and all remaining ATG16L1 (as revealed by +) colocalises with Gigaxonin and ubiquitin. c Gigaxonin promotes the K48-ubiquitination of ATG16L1. Specific labelling of K48 ubiquitin chain did not show substantial colocalisation of this ubiquitin motif on ch-ATG16, when transfected alone in COS-7 cells. In presence of Flag-Gig, Ch-ATG16L1 was degraded and fully decorated by K48-ubiquitin, as shown by the colocalisation of anti-K48 antibodies with ch-ATG16 in boosted pictures ± MG132. d Additional evidence for the ubiquitination of ATG16L1 by the Gigaxonin-E3 ligase using proximity ligation assay (PLA). The physical proximity between ubiquitin and ATG16L1 was revealed after transfection of HA-Ubiquitin with Cherry-ATG16L1 ± Flag-Gigaxonin under MG132 treatment. The specificity of the reactions of the PLA assay is provided in Supplementary Fig. 1a. e The poly-ubiquitination of the endogenous ATG16L1 is promoted by Gigaxonin. PLA was performed on COS-7 cells, transfected only with the HA-Ub ± Flag-Gigaxonin under MG132 treatment. The specificity of the reactions of the assay is provided in Supplementary Fig. 1b. Left panel: PLA amplification using anti-HA/anti-ATG16L1 antibodies. Right panel: The PLA amplification using anti-polyubiquitin chains/anti-ATG16L1 antibodies. Scale bar: 10 µm and 30 µm for zoom pictures
Fig. 3 Gigaxonin promotes the ubiquitination of ATG16L1. a In vivo ubiquitination assay for ATG16L1. COS-7 cells were transfected with Ch-ATG16 alone, or in combination with His-Ubiquitin construct (His-Ub) in the presence or absence of short interfering RNA (siRNA) against endogenous Gigaxonin (Gig siRNA) or the mismatch counterpart (Gig ms) and treated with MG132. The pull down of ubiquitinated ATG16L1 is performed in denaturing conditions using nickel agarose beads. b Colocalisation of ubiquitin with ATG16L1 upon Gigaxonin expression. COS-7 cells were transfected with Flag-Gig, Ch-ATG16 and HA-Ubiquitin (Ha-Ub) constructs ± MG132. The expression of Gigaxonin induces a drastic degradation of Ch-ATG16, and all remaining ATG16L1 (as revealed by +) colocalises with Gigaxonin and ubiquitin. c Gigaxonin promotes the K48-ubiquitination of ATG16L1. Specific labelling of K48 ubiquitin chain did not show substantial colocalisation of this ubiquitin motif on ch-ATG16, when transfected alone in COS-7 cells. In presence of Flag-Gig, Ch-ATG16L1 was degraded and fully decorated by K48-ubiquitin, as shown by the colocalisation of anti-K48 antibodies with ch-ATG16 in boosted pictures ± MG132. d Additional evidence for the ubiquitination of ATG16L1 by the Gigaxonin-E3 ligase using proximity ligation assay (PLA). The physical proximity between ubiquitin and ATG16L1 was revealed after transfection of HA-Ubiquitin with Cherry-ATG16L1 ± Flag-Gigaxonin under MG132 treatment. The specificity of the reactions of the PLA assay is provided in Supplementary Fig. 1a. e The poly-ubiquitination of the endogenous ATG16L1 is promoted by Gigaxonin. PLA was performed on COS-7 cells, transfected only with the HA-Ub ± Flag-Gigaxonin under MG132 treatment. The specificity of the reactions of the assay is provided in Supplementary Fig. 1b. Left panel: PLA amplification using anti-HA/anti-ATG16L1 antibodies. Right panel: The PLA amplification using anti-polyubiquitin chains/anti-ATG16L1 antibodies. Scale bar: 10 µm and 30 µm for zoom picturesCC BY · PubMed Central
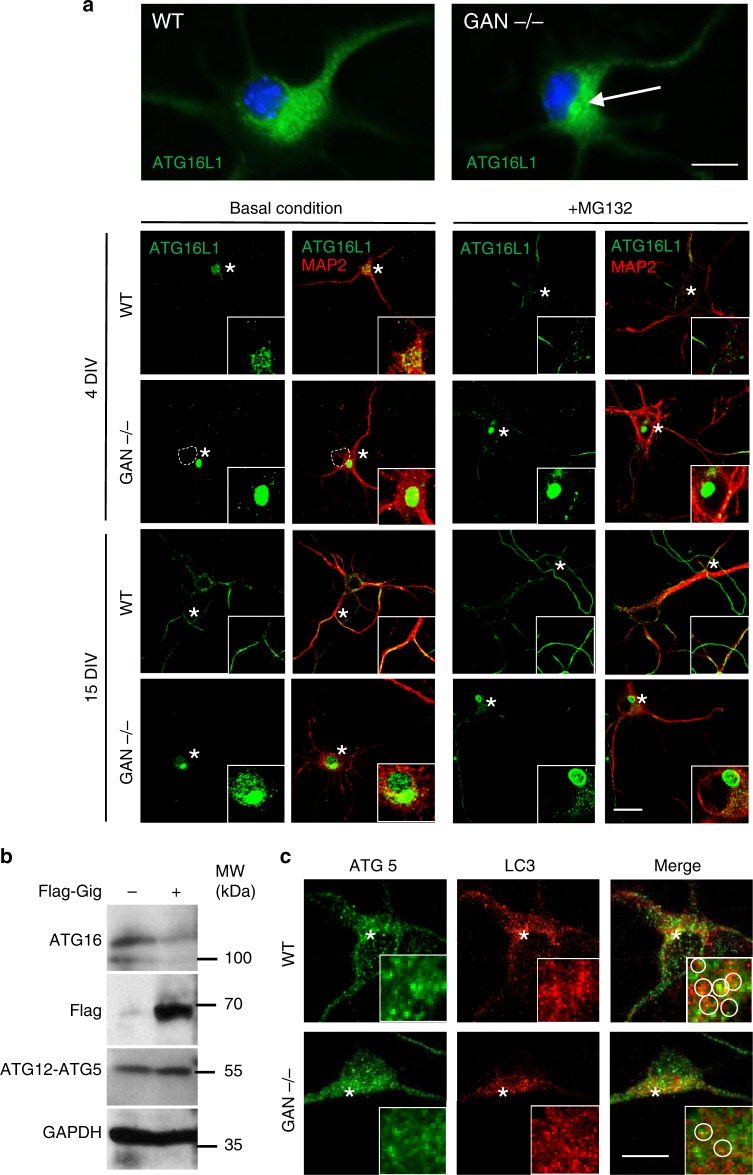
Fig. 4 ATG16L1 accumulates in GAN-/- cortical neurons and impairs the autophagy elongation conjugate. a MAP2 positive neurons, prepared from cortices of E15.5 GAN embryos were immunostained with ATG16L1 antibody after 4 and 15 div (days in vitro) ± proteasome inhibitor. Top panel shows an enlarge picture of the single perinuclear bundle of ATG16L1 found in the soma of GAN-/- cells. Dashed line shows the nucleus. Scale bar: 10 µm for upper panel and 20 µm for bottom panel. b The effect of Gigaxonin in the conjugation of ATG12-ATG5 was evidenced in COS-7 cells. Transfected Flag-Gigaxonin degraded endogenous ATG16L1 but did not alter the formation of ATG12-ATG5 elongation complex, which migrates at 55 kDa. c ATG5 does not aggregate in Gigaxonin-null neurons. The visualisation of the docking of endogenous ATG5 to autophagosomes was hampered by the high density of LC3 dots in cortical neurons, but would reveal a decreased density around autophagic structures in the GAN-/- neurons (inserts: circles drawn to highlight LC3-ATG5 proximity in individual dots). Scale bar: 10 µm
Fig. 4 ATG16L1 accumulates in GAN-/- cortical neurons and impairs the autophagy elongation conjugate. a MAP2 positive neurons, prepared from cortices of E15.5 GAN embryos were immunostained with ATG16L1 antibody after 4 and 15 div (days in vitro) ± proteasome inhibitor. Top panel shows an enlarge picture of the single perinuclear bundle of ATG16L1 found in the soma of GAN-/- cells. Dashed line shows the nucleus. Scale bar: 10 µm for upper panel and 20 µm for bottom panel. b The effect of Gigaxonin in the conjugation of ATG12-ATG5 was evidenced in COS-7 cells. Transfected Flag-Gigaxonin degraded endogenous ATG16L1 but did not alter the formation of ATG12-ATG5 elongation complex, which migrates at 55 kDa. c ATG5 does not aggregate in Gigaxonin-null neurons. The visualisation of the docking of endogenous ATG5 to autophagosomes was hampered by the high density of LC3 dots in cortical neurons, but would reveal a decreased density around autophagic structures in the GAN-/- neurons (inserts: circles drawn to highlight LC3-ATG5 proximity in individual dots). Scale bar: 10 µmCC BY · PubMed Central
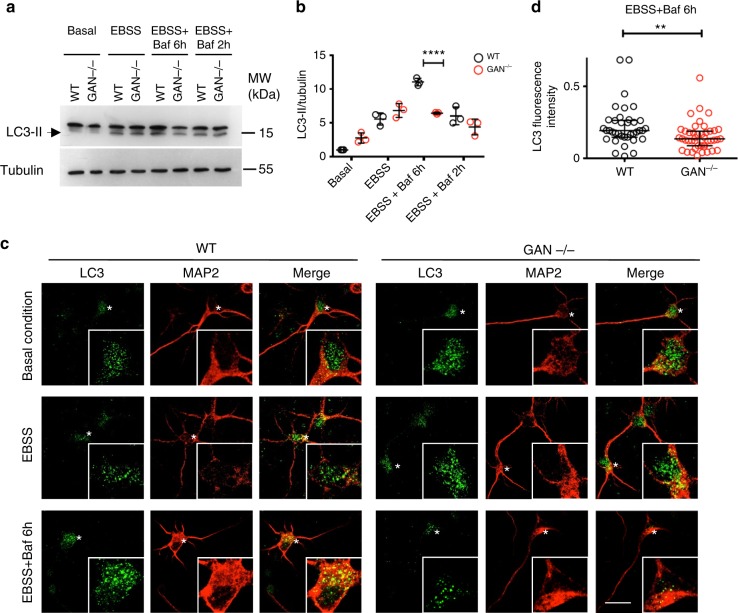
Fig. 5 Gigaxonin depletion causes a defect in autophagosome production. a–d Wild-type and GAN-/- cortical neurons were cultured for 4 div under basal condition, or with different treatments to evaluate autophagy activity. Starvation was induced with EBSS, autophagosome-lysosome fusion was blocked with Bafilomycin A1 (Baf). a Immunoblotting of cortical neurons to show the lipidation of LC3 under different conditions, in control and mutant neurons. b Quantification of the lipidation of LC3 was measured with the LC3-II to tubulin ratio, and expressed as a fold increase over the control level in the basal condition. The defect in autophagy in GAN-/- neurons, evidenced by the decreased LC3 lipidation in EBBS + Baf 6h condition was further defined as a decreased production of autophagosomes, by comparing the EBBS + Baf ratio at two different times (2 h and 6 h of treatment). WT and mutant values are represented in black and red circles, respectively. n = 3 independent experiments and values are means ± SD. Differences between WT and mutant values are only significant for the (EBSS + Baf 6h) condition ****P < 0.0001 using two-way ANOVA test (Bonferroni post-hoc test). Other multiple comparisons, not presented on the figure for clarity purpose are: (1) control values: ****P < 0.0001 between basal and EBSS, ****P < 0.0001 between EBSS and (EBSS + Baf 6h); ****P < 0.0001 between (EBSS + Baf 6h) and (EBSS + Baf 2h); (2) for the mutant cells: ***P < 0.001 between basal and EBSS. c The decrease of autophagosomes, visualised by the reduced density of LC3 dots, was evidenced in GAN-/- neurons labelled with the MAP2 antibodies under EBBS + Baf 6h treatment. Scale bar: 25 µm. d The quantification of LC3 dots was obtained by measuring the fluorescence intensity of LC3 staining in EBSS + Baf 6h condition (n = 37 for WT cells represented in black circles, n = 43 cells for mutant cells represented in red circles, from three independent experiments). Individual measures and medians with interquartile range are represented; statistical significance was obtained using the two-tailed Mann–Whitney test with a **P < 0.01 value
Fig. 5 Gigaxonin depletion causes a defect in autophagosome production. a–d Wild-type and GAN-/- cortical neurons were cultured for 4 div under basal condition, or with different treatments to evaluate autophagy activity. Starvation was induced with EBSS, autophagosome-lysosome fusion was blocked with Bafilomycin A1 (Baf). a Immunoblotting of cortical neurons to show the lipidation of LC3 under different conditions, in control and mutant neurons. b Quantification of the lipidation of LC3 was measured with the LC3-II to tubulin ratio, and expressed as a fold increase over the control level in the basal condition. The defect in autophagy in GAN-/- neurons, evidenced by the decreased LC3 lipidation in EBBS + Baf 6h condition was further defined as a decreased production of autophagosomes, by comparing the EBBS + Baf ratio at two different times (2 h and 6 h of treatment). WT and mutant values are represented in black and red circles, respectively. n = 3 independent experiments and values are means ± SD. Differences between WT and mutant values are only significant for the (EBSS + Baf 6h) condition ****P < 0.0001 using two-way ANOVA test (Bonferroni post-hoc test). Other multiple comparisons, not presented on the figure for clarity purpose are: (1) control values: ****P < 0.0001 between basal and EBSS, ****P < 0.0001 between EBSS and (EBSS + Baf 6h); ****P < 0.0001 between (EBSS + Baf 6h) and (EBSS + Baf 2h); (2) for the mutant cells: ***P < 0.001 between basal and EBSS. c The decrease of autophagosomes, visualised by the reduced density of LC3 dots, was evidenced in GAN-/- neurons labelled with the MAP2 antibodies under EBBS + Baf 6h treatment. Scale bar: 25 µm. d The quantification of LC3 dots was obtained by measuring the fluorescence intensity of LC3 staining in EBSS + Baf 6h condition (n = 37 for WT cells represented in black circles, n = 43 cells for mutant cells represented in red circles, from three independent experiments). Individual measures and medians with interquartile range are represented; statistical significance was obtained using the two-tailed Mann–Whitney test with a **P < 0.01 valueCC BY · PubMed Central
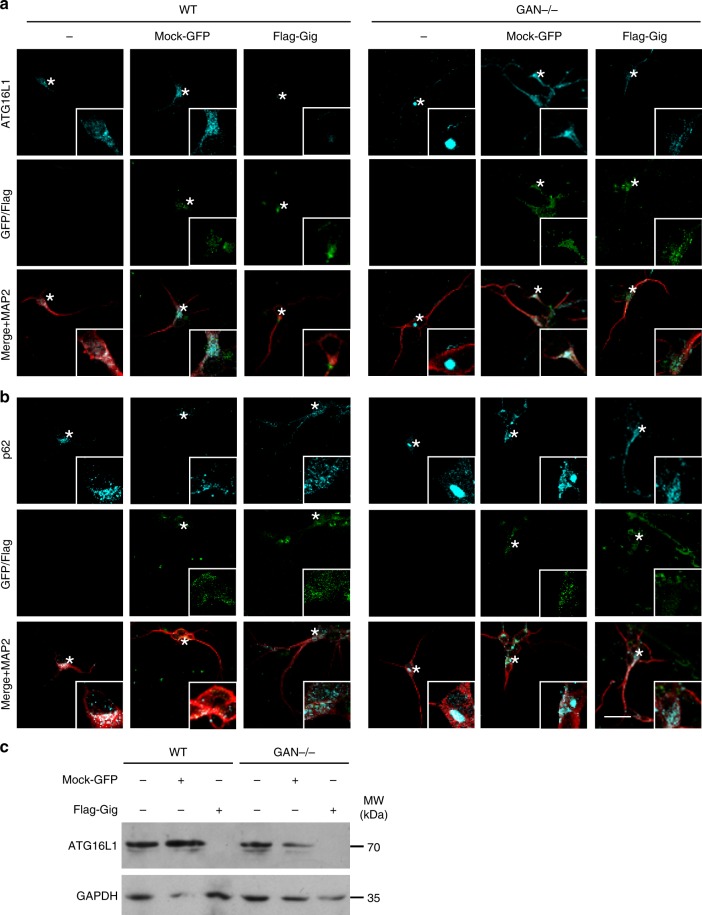
Fig. 6 Early and late autophagy steps are rescued by lentiviral-Gigaxonin in GAN-/- neurons. Immunostaining (a) and immunoblots (c) for ATG16L1 were performed on 4 div control and mutant neurons, after transduction with mock-GFP or Flag-Gigaxonin lentivirus. Both normal and bundled ATG16L1 were cleared upon expression of Gigaxonin in control and GAN-/- neurons, respectively. b Gigaxonin expression restored p62 levels in mutant cells, supporting an effective maturation of autophagosomes and autophagy degradation. Scale bar: 20 µm
Fig. 6 Early and late autophagy steps are rescued by lentiviral-Gigaxonin in GAN-/- neurons. Immunostaining (a) and immunoblots (c) for ATG16L1 were performed on 4 div control and mutant neurons, after transduction with mock-GFP or Flag-Gigaxonin lentivirus. Both normal and bundled ATG16L1 were cleared upon expression of Gigaxonin in control and GAN-/- neurons, respectively. b Gigaxonin expression restored p62 levels in mutant cells, supporting an effective maturation of autophagosomes and autophagy degradation. Scale bar: 20 µmCC BY · PubMed Central
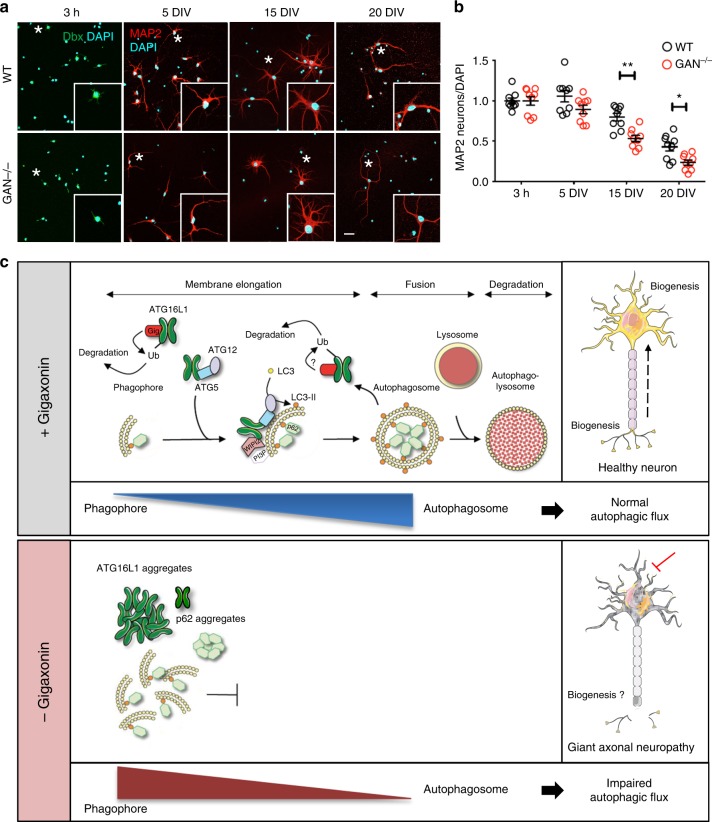
Fig. 7 Progressive degeneration of GAN-/- neurons and model of action of Gigaxonin. a Immunostaining with Doublecortine (Dbx) and MAP2 identified neurons from control and GAN-/- mice after 3 hours, 5, 15 and 20 div. Scale bar: 25 µm. b Neurodegeneration of GAN-/- neurons was evidenced from 15 div onwards, as measured by the decreased proportion of neurons (as expressed by a MAP2 to DAPI ratio), relatively to the 3 h time point (Dbx to Dapi ratio). WT and mutant cells are represented in black and red circles, respectively. n = 3 independent experiments with triplicate measures (161–821 DAPI-positive cells counted per measure). Individual measures and means ± SEM are represented; **P < 0.01 and *P < 0.05 values at 15 and 20 div, respectively using the two-way ANOVA test (Bonferroni post-hoc test). c Schematic model of Gigaxonin action. Top panel: Gigaxonin controls the steady-state level of ATG16L1, by interacting with its C-terminal WD40 domain and promoting its K48 poly-ubiquitination and clearance by the proteasome and the autophagy pathways. ATG16L1 binds to the ATG12-ATG5 elongation conjugate and targets it to the nascent autophagic membrane, through its interaction with WIPI2. Thus, the E3 ligase activity of the ATG12-ATG5-ATG16 complex lipidates LC3 onto the membranes, allowing the elongation of the phagophore. The mature autophagosome sequesters cytosolic materials, including p62 bound cargo, which are degraded upon fusion to the lysosome. Thus, by controlling ATG16L1 steady-state, the Gigaxonin-E3 ligase promotes autophagosome production and ensures a normal autophagic flux within cells. In a physiological context, autophagosome biogenesis occurs at the neurite tip but also in the soma of primary neurons. Bottom panel: Gigaxonin depletion in primary neurons induces aggregation of ATG16L1, without impairing the formation of the ATG12-ATG5 conjugate. We propose that the impairment in LC3 lipidation observed in GAN-/- neurons is due to a defect in anchoring ATG12-ATG5 to the autophagic membranes. Overall, Gigaxonin depletion alters autophagosome synthesis and causes an abnormal accumulation of the main autophagy receptor p62, hence impairing the autophagic flux. ATG16L1 and P62 accumulation are localised within the soma, opening interesting perspectives on the study of autophagy compartimentalisation within neurons, and on its role in human neuropathy, as exemplified in GAN. (Image templates coming from Servier Medical Art (https://na01.safelinks.protection.outlook.com/?url=http%3A%2F%2Fsmart.servier.com%2F&data=02%7C01%7Caurora.scrivo%40einstein.yu.edu%7Cc44f29f2622d461b35a508d654507f0e%7C04c70eb48f2648079934e02e89266ad0%7C1%7C0%7C636789102036800397&sdata=zpNk9F6HX1iwcI%2Fdm5MXXUj3yRUvykH64lwEWuH1J8U%3D&reserved=0)
Fig. 7 Progressive degeneration of GAN-/- neurons and model of action of Gigaxonin. a Immunostaining with Doublecortine (Dbx) and MAP2 identified neurons from control and GAN-/- mice after 3 hours, 5, 15 and 20 div. Scale bar: 25 µm. b Neurodegeneration of GAN-/- neurons was evidenced from 15 div onwards, as measured by the decreased proportion of neurons (as expressed by a MAP2 to DAPI ratio), relatively to the 3 h time point (Dbx to Dapi ratio). WT and mutant cells are represented in black and red circles, respectively. n = 3 independent experiments with triplicate measures (161–821 DAPI-positive cells counted per measure). Individual measures and means ± SEM are represented; **P < 0.01 and *P < 0.05 values at 15 and 20 div, respectively using the two-way ANOVA test (Bonferroni post-hoc test). c Schematic model of Gigaxonin action. Top panel: Gigaxonin controls the steady-state level of ATG16L1, by interacting with its C-terminal WD40 domain and promoting its K48 poly-ubiquitination and clearance by the proteasome and the autophagy pathways. ATG16L1 binds to the ATG12-ATG5 elongation conjugate and targets it to the nascent autophagic membrane, through its interaction with WIPI2. Thus, the E3 ligase activity of the ATG12-ATG5-ATG16 complex lipidates LC3 onto the membranes, allowing the elongation of the phagophore. The mature autophagosome sequesters cytosolic materials, including p62 bound cargo, which are degraded upon fusion to the lysosome. Thus, by controlling ATG16L1 steady-state, the Gigaxonin-E3 ligase promotes autophagosome production and ensures a normal autophagic flux within cells. In a physiological context, autophagosome biogenesis occurs at the neurite tip but also in the soma of primary neurons. Bottom panel: Gigaxonin depletion in primary neurons induces aggregation of ATG16L1, without impairing the formation of the ATG12-ATG5 conjugate. We propose that the impairment in LC3 lipidation observed in GAN-/- neurons is due to a defect in anchoring ATG12-ATG5 to the autophagic membranes. Overall, Gigaxonin depletion alters autophagosome synthesis and causes an abnormal accumulation of the main autophagy receptor p62, hence impairing the autophagic flux. ATG16L1 and P62 accumulation are localised within the soma, opening interesting perspectives on the study of autophagy compartimentalisation within neurons, and on its role in human neuropathy, as exemplified in GAN. (Image templates coming from Servier Medical Art (https://na01.safelinks.protection.outlook.com/?url=http%3A%2F%2Fsmart.servier.com%2F&data=02%7C01%7Caurora.scrivo%40einstein.yu.edu%7Cc44f29f2622d461b35a508d654507f0e%7C04c70eb48f2648079934e02e89266ad0%7C1%7C0%7C636789102036800397&sdata=zpNk9F6HX1iwcI%2Fdm5MXXUj3yRUvykH64lwEWuH1J8U%3D&reserved=0)CC BY · PubMed Central

Verification

Claims the paper makes

The claims and statistics of this paper haven’t been checked yet.

Run the check — free, no account needed. It reads the open-access text and checks the sources it cites.

A few free checks a day · papers already verified open instantly · results are public

Claims other papers make about this one

Each is checked against this paper’s own text: does it say what the citing paper says it does?

Self-check

Percentages, sums and reported differences re-computed from the paper’s own numbers.

The self-check needs the paper’s full text.

Citations

Cites

Research works printed but not linked: 37

  1. Mizushima, N., Levine, B., Cuervo, A. M. & Klionsky, D. J. Autophagy fights disease through cellular self-digestion. Nature 451, 1069–1075 (2008). · DOI · Paper page
  2. Schneider, J. L. & Cuervo, A. M. Autophagy and human disease: emerging themes. Curr. Opin. Genet. Dev. 26, 16–23 (2014). · DOI
  3. Klionsky, D. J. & Emr, S. D. Autophagy as a regulated pathway of cellular degradation. Science 290, 1717–1721 (2000). · DOI
  4. Rogov, V., Dotsch, V., Johansen, T. & Kirkin, V. Interactions between autophagy receptors and ubiquitin-like proteins form the molecular basis for selective autophagy. Mol. Cell 53, 167–178 (2014). · DOI · Paper page
  5. Shpilka, T., Mizushima, N. & Elazar, Z. Ubiquitin-like proteins and autophagy at a glance. J. Cell Sci. 125, 2343–2348 (2012). · DOI
  6. Klionsky, D. J. & Schulman, B. A. Dynamic regulation of macroautophagy by distinctive ubiquitin-like proteins. Nat. Struct. Mol. Biol. 21, 336–345 (2014). · DOI
  7. Mizushima, N., Noda, T. & Ohsumi, Y. Apg16p is required for the function of the Apg12p-Apg5p conjugate in the yeast autophagy pathway. EMBO J. 18, 3888–3896 (1999). · DOI
  8. Matsushita, M. et al. Structure of Atg5.Atg16, a complex essential for autophagy. J. Biol. Chem. 282, 6763–6772 (2007). · DOI
  9. Metlagel, Z., Otomo, C., Ohashi, K., Takaesu, G. & Otomo, T. Structural insights into E2-E3 interaction for LC3 lipidation. Autophagy 10, 522–523 (2014). · DOI
  10. Noda, N. N., Fujioka, Y., Hanada, T., Ohsumi, Y. & Inagaki, F. Structure of the Atg12-Atg5 conjugate reveals a platform for stimulating Atg8-PE conjugation. EMBO Rep. 14, 206–211 (2013). · DOI
  11. Zavodszky, E., Vicinanza, M. & Rubinsztein, D. C. Biology and trafficking of ATG9 and ATG16L1, two proteins that regulate autophagosome formation. FEBS Lett. 587, 1988–1996 (2013). · DOI
  12. Fujita, N. et al. The Atg16L complex specifies the site of LC3 lipidation for membrane biogenesis in autophagy. Mol. Biol. Cell 19, 2092–2100 (2008). · DOI
  13. Romanov, J. et al. Mechanism and functions of membrane binding by the Atg5-Atg12/Atg16 complex during autophagosome formation. EMBO J. 31, 4304–4317 (2012). · DOI
  14. Saitoh, T. et al. Loss of the autophagy protein Atg16L1 enhances endotoxin-induced IL-1beta production. Nature 456, 264–268 (2008). · DOI
  15. Suzuki, K. et al. The pre-autophagosomal structure organized by concerted functions of APG genes is essential for autophagosome formation. EMBO J. 20, 5971–5981 (2001). · DOI
  16. Botti-Millet, J., Nascimbeni, A. C., Dupont, N., Morel, E. & Codogno, P. Fine-tuning autophagy: from transcriptional to post-translational regulation. Am. J. Physiol. Cell Physiol. 311, C351–62 (2016). · DOI
  17. Xie, Y. et al. Posttranslational modification of autophagy-related proteins in macroautophagy. Autophagy 11, 28–45 (2015). · DOI · Paper page
  18. Diamanti, M. A. et al. IKKalpha controls ATG16L1 degradation to prevent ER stress during inflammation. J. Exp. Med. 214, 423–437 (2017). · DOI
  19. Bomont, P. et al. The gene encoding gigaxonin, a new member of the cytoskeletal BTB/kelch repeat family, is mutated in giant axonal neuropathy. Nat. Genet. 26, 370–374 (2000). · DOI
  20. Furukawa, M., He, Y. J., Borchers, C. & Xiong, Y. Targeting of protein ubiquitination by BTB-Cullin 3-Roc1 ubiquitin ligases. Nat. Cell Biol. 5, 1001–1007 (2003). · DOI
  21. Fujita, N. et al. Recruitment of the autophagic machinery to endosomes during infection is mediated by ubiquitin. J. Cell Biol. 203, 115–128 (2013). · DOI
  22. Ganay, T., Boizot, A., Burrer, R., Chauvin, J. P. & Bomont, P. Sensory-motor deficits and neurofilament disorganization in gigaxonin-null mice. Mol. Neurodegene 12, 25 (2011). · DOI
  23. Cui, D., Xiong, X. & Zhao, Y. Cullin-RING ligases in regulation of autophagy. Cell. Div. 11, 8 (2016). · DOI
  24. Kuang, E., Qi, J. & Ronai, Z. Emerging roles of E3 ubiquitin ligases in autophagy. Trends Biochem. Sci. 38, 453–460 (2013). · DOI
  25. Dooley, H. C., Wilson, M. I. & Tooze, S. A. WIPI2B links PtdIns3P to LC3 lipidation through binding ATG16L1. Autophagy 11, 190–191 (2015).
  26. Dooley, H. C. et al. WIPI2 links LC3 conjugation with PI3P, autophagosome formation, and pathogen clearance by recruiting Atg12-5-16L1. Mol. Cell 55, 238–252 (2014). · DOI
  27. Polson, H. E. et al. Mammalian Atg18 (WIPI2) localizes to omegasome-anchored phagophores and positively regulates LC3 lipidation. Autophagy 6, 506–522 (2010). · DOI · Paper page
  28. Hollenbeck, P. J. Products of endocytosis and autophagy are retrieved from axons by regulated retrograde organelle transport. J. Cell Biol. 121, 305–315 (1993). · DOI
  29. Maday, S. & Holzbaur, E. L. Autophagosome biogenesis in primary neurons follows an ordered and spatially regulated pathway. Dev. Cell 30, 71–85 (2014). · DOI · Paper page
  30. Yue, Z. Regulation of neuronal autophagy in axon: implication of autophagy in axonal function and dysfunction/degeneration. Autophagy 3, 139–141 (2007). · DOI
  31. Maday, S. Mechanisms of neuronal homeostasis: Autophagy in the axon. Brain Res. 1649: 143–150 (2016). · DOI
  32. Wong, Y. C. & Holzbaur, E. L. Autophagosome dynamics in neurodegeneration at a glance. J. Cell Sci. 128, 1259–1267 (2015). · DOI
  33. Saitsu, H. et al. De novo mutations in the autophagy gene WDR45 cause static encephalopathy of childhood with neurodegeneration in adulthood. Nat. Genet. 45, 445–449 (2013). 449e441. · DOI · Paper page
  34. Park, C. & Cuervo, A. M. Selective autophagy: talking with the UPS. Cell Biochem. Biophys. 67, 3–13 (2013). · DOI
  35. Mahammad, S. et al. Giant axonal neuropathy-associated gigaxonin mutations impair intermediate filament protein degradation. J. Clin. Invest. 123, 1964–1975 (2013). · DOI
  36. Bomont, P. & Koenig, M. Intermediate filament aggregation in fibroblasts of giant axonal neuropathy patients is aggravated in non dividing cells and by microtubule destabilization. Hum. Mol. Genet. 12, 813–822 (2003). · DOI
  37. Cleveland, D. W., Yamanaka, K. & Bomont, P. Gigaxonin controls vimentin organization through a tubulin chaperone-independent pathway. Hum. Mol. Genet. 18, 1384–1394 (2009). · DOI

Cited by

Sorted by citations

See all 64

Metadata

Authors
Scrivo, A., Codogno, P., & Bomont, P.
Venue
Nature Communications
Published
2019-02-15
Volume
10
Issue
1
ISSN
2041-1723
Cited by
64
References
10
Language
en

About these checks

Registry, retraction, Cites and statistics results are computed, not judged, with one exception: a printed reference that no index lists is read once by a model before it counts as a citation error. Claims are extracted by a model and kept only when their quote appears verbatim in the text; each cited source is then checked, with a model’s help, for whether it says what the claim relies on. Those verdicts can be wrong — read the claim’s quote and the cited source before relying on one.

Statistics and arithmetic are recomputed, not judged.

Confidence bands are shown only for fields calibrated on our annotated test set. None is calibrated yet, so no band is shown.

What counts as a claim ›How we measure confidence ›How we check this ›

Are you an author, or do you see a problem with this page? Request a review